Only subscribers can read the full article. Please login to read the entire article.
 Unlock This Article
To become a subscriber, subscribe to our free newsletter services. Our service is free for all.
Continue reading
Looking for reliable and free stock tips? Look no further than Moneymunch! We provide intraday and positional trading calls, technical analysis, research reports, and daily or weekly charts to help you make informed trading decisions in the stock market. Subscribe now and stay ahead of the game!
Only subscribers can read the full article. Please login to read the entire article.
To become a subscriber, subscribe to our free newsletter services. Our service is free for all.
To become a subscriber, subscribe to our free newsletter services. Our service is free for all.
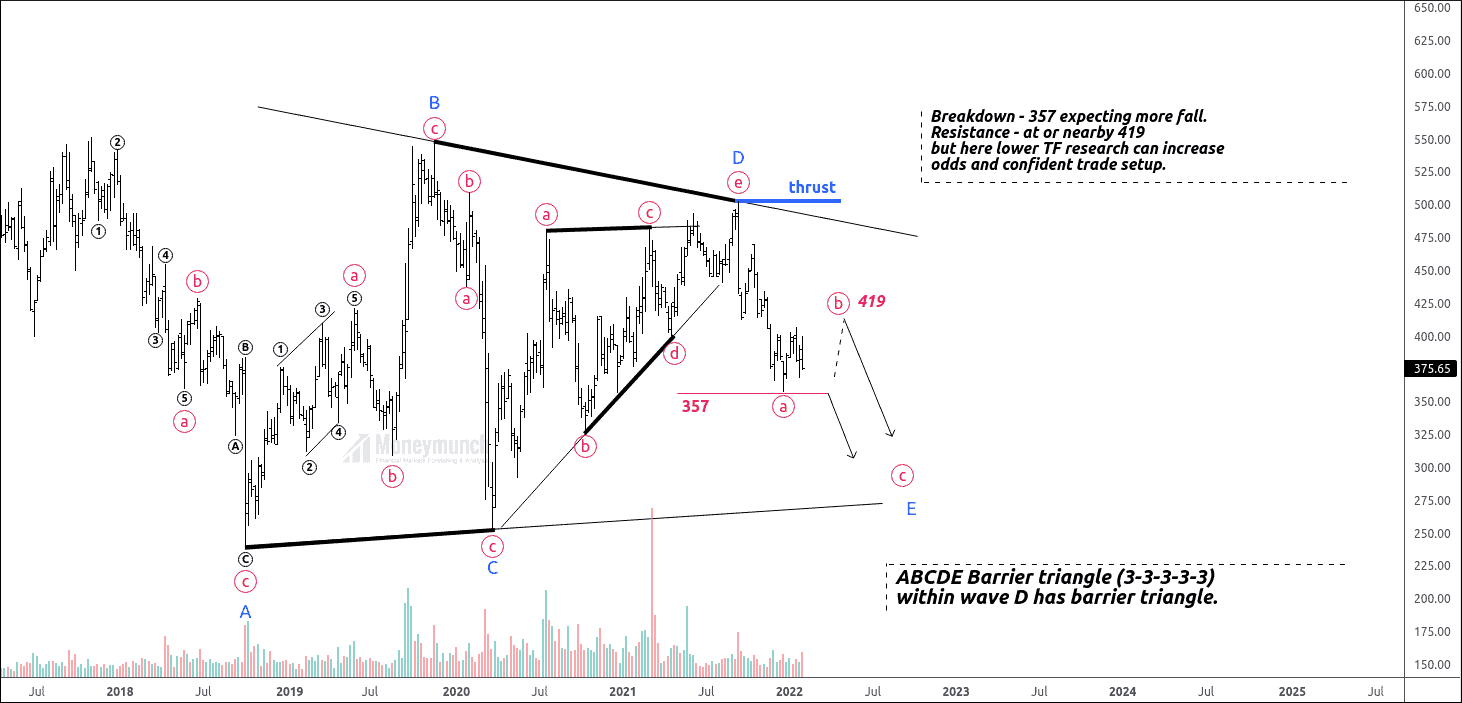
Timeframe -Weekly
Today, I’m talking about real-time “Barrier Triangles” which developing on BPCL and very specific aspect of this triangle that I’ve encountered numerous times and that’s the frustrating aspect or characteristic of a triangle stuff to sometimes. In this instance, we are looking at a triangle where we actually have a triangle within triangle.
Let me explain you my price chart over real quick, and you’ll see exactly what I’m talking about. Notice we have connected by trend line waves A and C is horizontal and waves B and D sloping downward therefore, we reveal barrier triangle.
Breakdown – 357 expecting more fall.
Resistance – at or nearby 419
But here, lower TF research can increase odds and confident for trade setup.
I will shortly update – lower TF here.
To become a subscriber, subscribe to our free newsletter services. Our service is free for all.
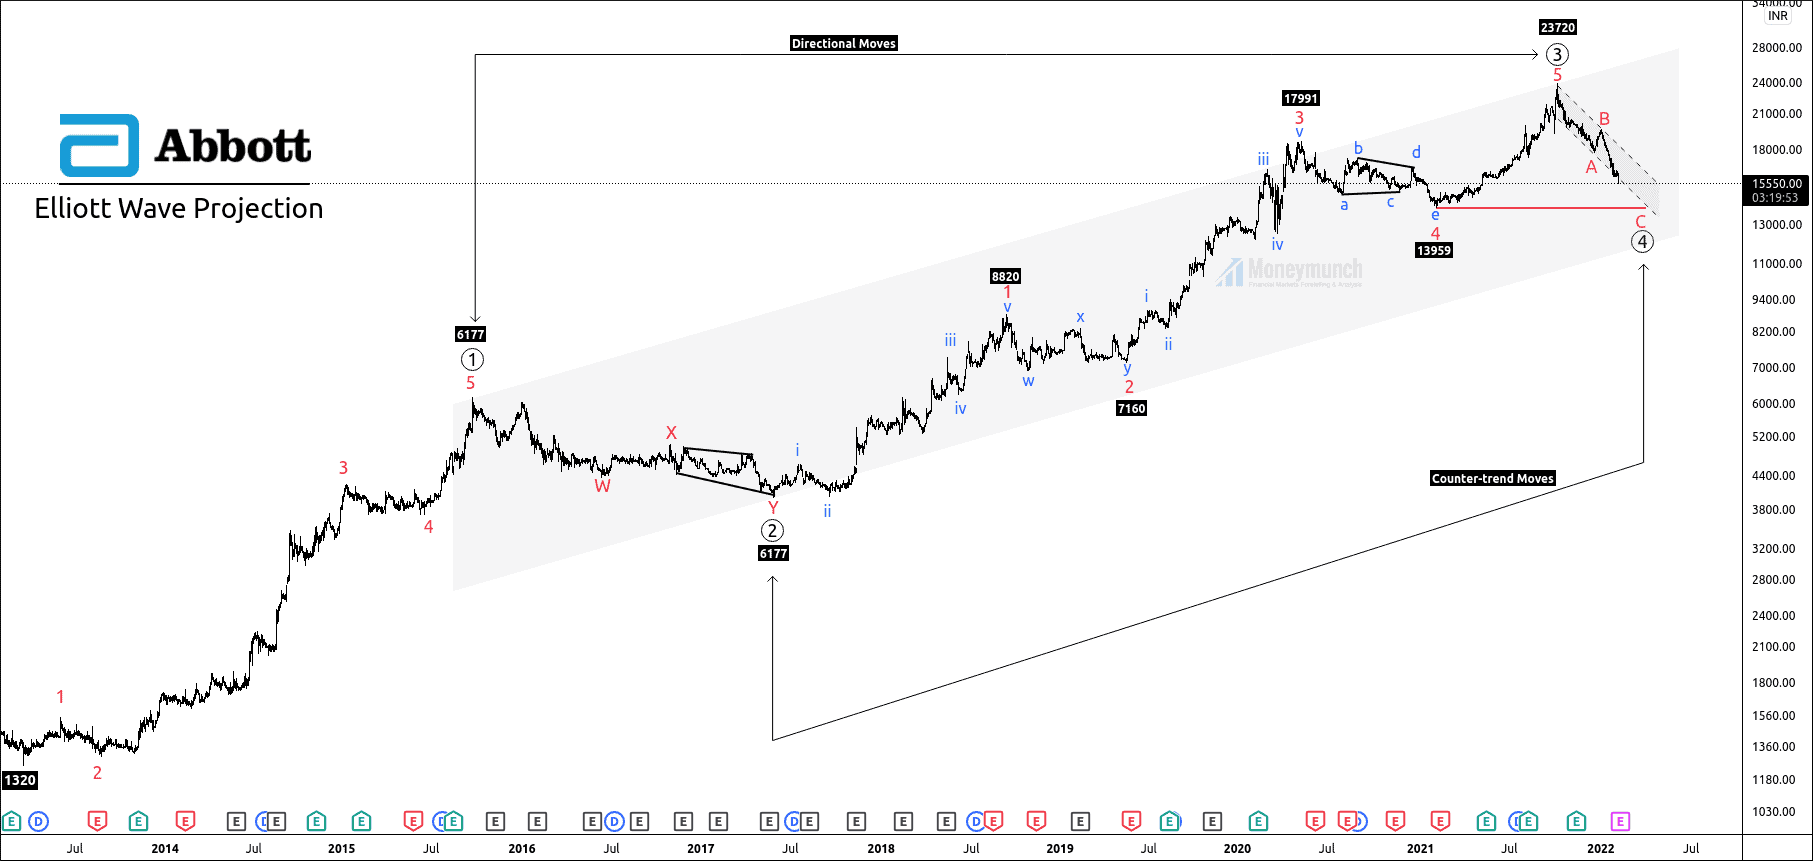
Overview:
Abbott India has accomplished the impulsive wave 3, and the price is forming corrective wave 4. Price has occurred the sub-wave A. and Sub-wave B. Sub-wave C of 4th wave is in progress.
After completion of wave 4, the price will start its bull run.
Fibonacci relationship and wave Formations:
Wave ((1)) is a five-wave impulse.
Wave ((2)) retraced 50% of wave ((1)).
Wave ((2)) has taken 23 months to finalize.
Wave ((3)) is a five-wave impulse.
Wave ((4)) looks like a sharp correction.
Rule of alternation indicates variation between two corrective waves in terms of time, distance, and formation.
Because wave ((2)) was a complex correction, wave ((4)) should be a sharp correction.
Destiny of wave ((4)):
Wave ((4)) can terminate near the previous corrective wave (iv) at 13994.
Wave 4 can end at, 15064, which is a crucial support level.
The common retracement of wave ((4)) is 38.2%, but the price has broken down to this level. Next Fibonacci retracement level is 50% at, 13967.
Please note that the corrective channel has broken down, so bulls can enter when the price renter into the parallel lines. Otherwise, the price has bearish sentiments.
To become a subscriber, subscribe to our free newsletter services. Our service is free for all.
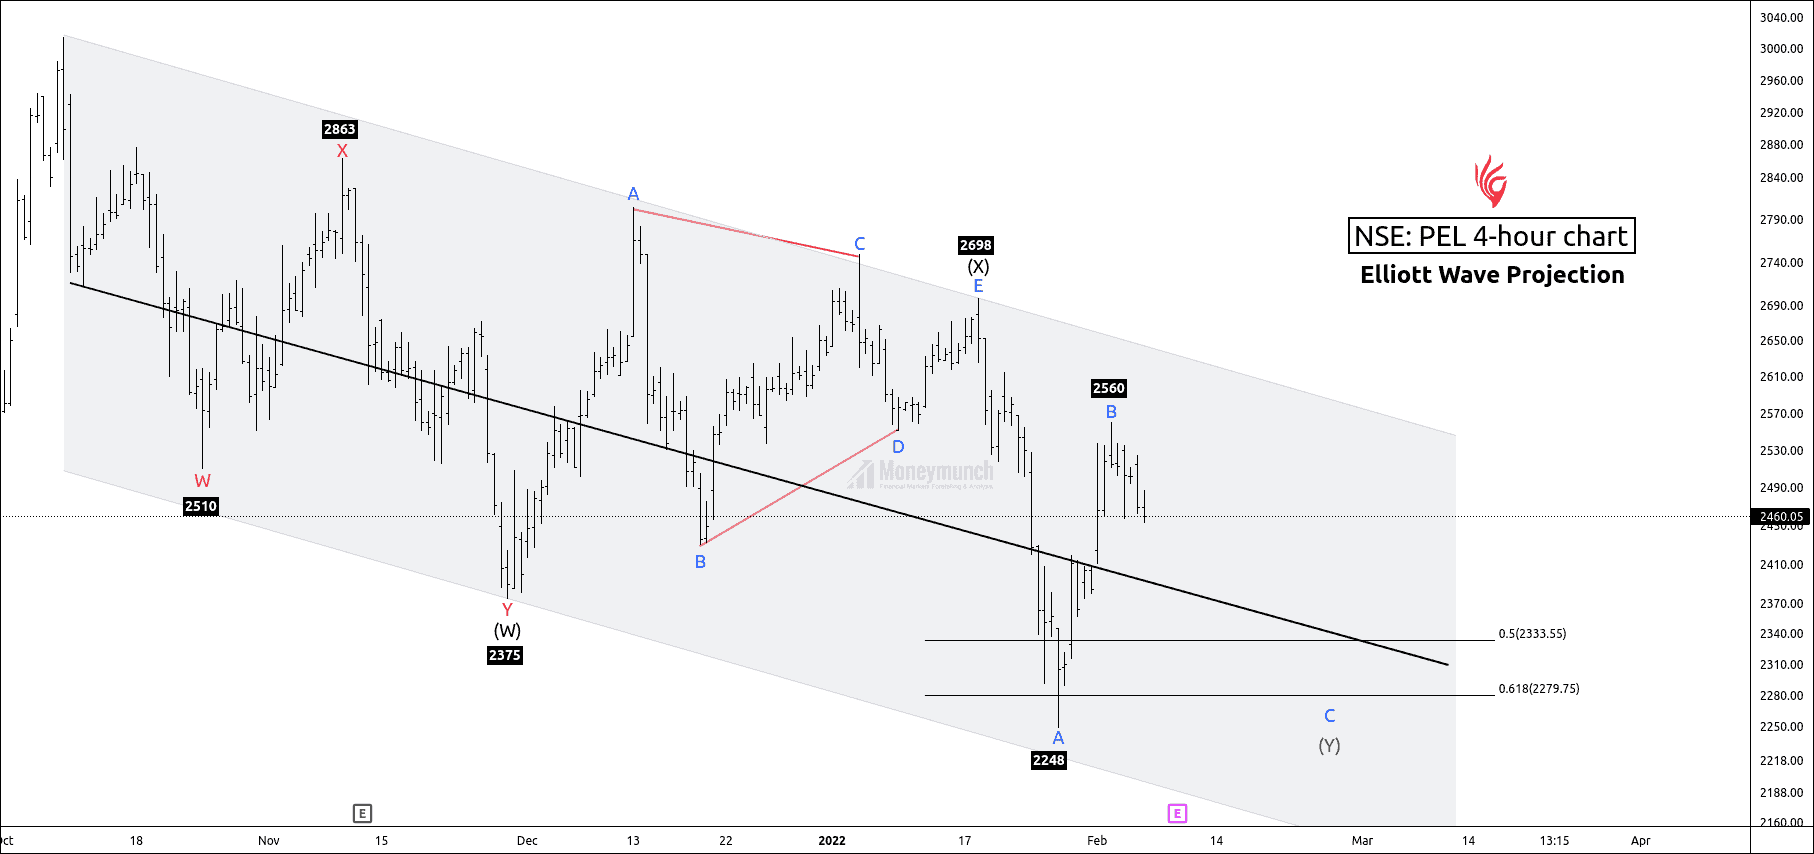
TARGETS:
Traders can initiate short positions for the following targets:
2400 – 2376 – 2301 – 2279
BUT DON’T TRADE BLINDLY. Read this following research to get how it is making selling opportunities for the intraday traders.
PEL is forming a double combination pattern on the 4-hour timeframe chart. Price has constructed LL(lower-low) and LH(lower-high) to confirm the bear’s existence.
Wave Formations:
Wave (W) is a double zigzag formation with seven wave structures.
Wave (X) is a contracting triangle with five sub-wave structures.
Wave (Y):
Sub-wave wave A & B has occurred, and wave C is progressing.
Sub-wave B has completed at 61.8% Fibonacci retracement of wave A at 2531.
The culmination point of wave C:
Wave C can end at 61.8% of wave A at 2279.
Wave C can cease at 50% of wave A at 2333.
Wave C can conclude at the control line, and 61.8% of wave ((W)) at 2376.
After completion of wave C, the price will start its bull run.
To become a subscriber, subscribe to our free newsletter services. Our service is free for all.
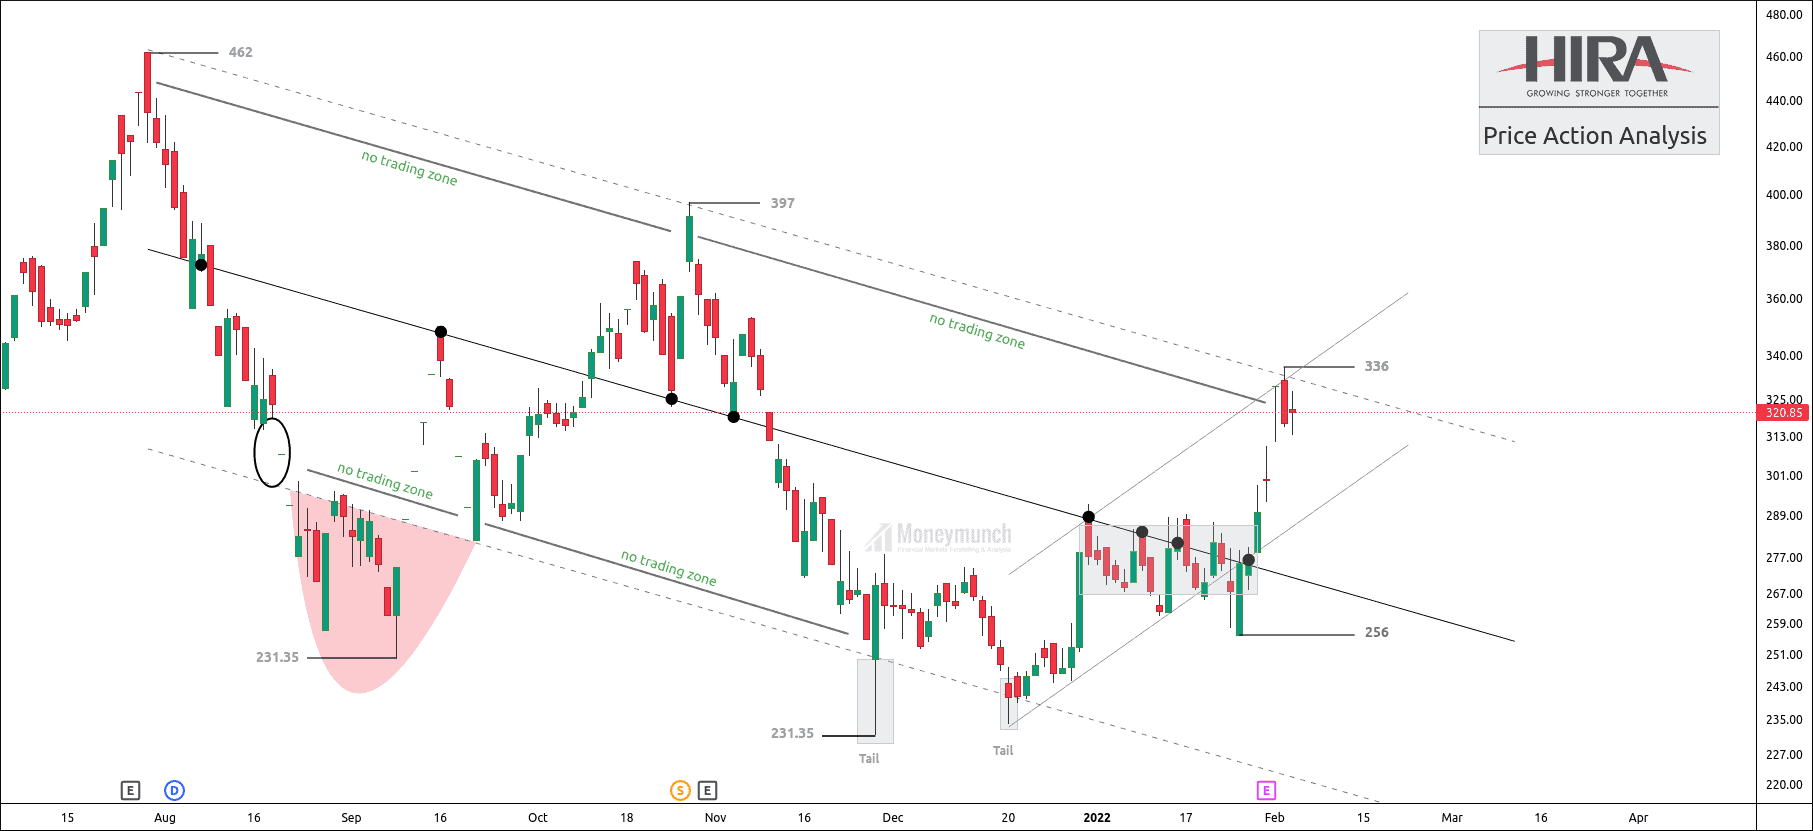
GPIL has formed a downtrend channel for the last six months.
Price has created 5 no trading zones. No trading zone is an area where trading activities haven’t taken place. It has constituted 2 excess on the lower band and 3 rejections, 2 rejections from the upper bend.
The control line has made eight touches.
Currently, the price is on the upper band of the parallel channel.
Don’t forget that price has provided two successful rejections from the upper band.
The trader can initiate a short position for the following targets of 313 – 304 – 290.
Invalidation: Breakout of the parallel channel.
To become a subscriber, subscribe to our free newsletter services. Our service is free for all.