Mr.Dev (s)

Mr.Dev(s) is a team of non-biased certified technical and research analysts with extensive experience in the financial markets dating back to 1997. They accurately forecast market movements and position their clients accordingly. They are popular online contributors on many channels and platforms, known for their non-biased advice and commitment to helping investors make informed decisions. The team is also the founder of forex account management services on Moneymunch.com, demonstrating their knowledge and experience in the financial world. Investors can rely on Mr.Dev(s) for research reports and opinions, as well as trading guidance.

Join Today (Free): Commodity Tips | Forex Signals

AUDUSD, EURUSD, USDCAD – Premium Setups

BUY AUDUSD – Wave Setup

BUY EURUSD – Price Action Breakdown

USDCAD – Premium Swing Trade

Continue reading

MCX Gold Analysis & Economic Outlook: Feb 25 – Mar 1, 2024

mcx gold weekly chart calls

Analyzing Gold’s Technical Trends and Economic Influences

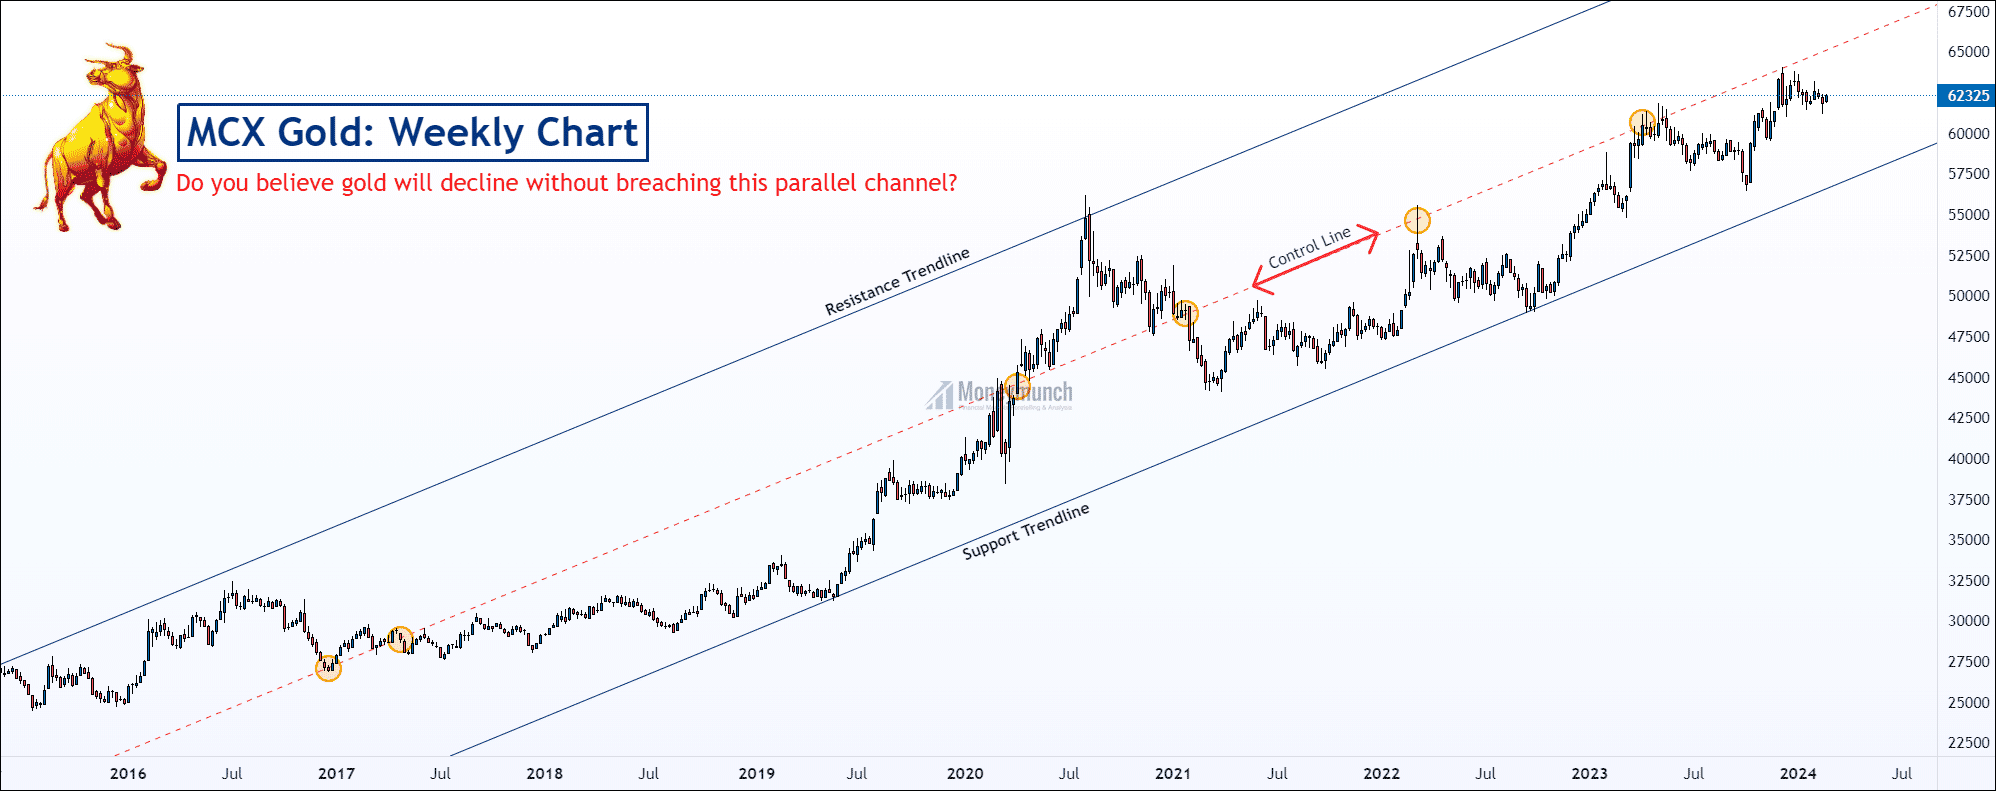
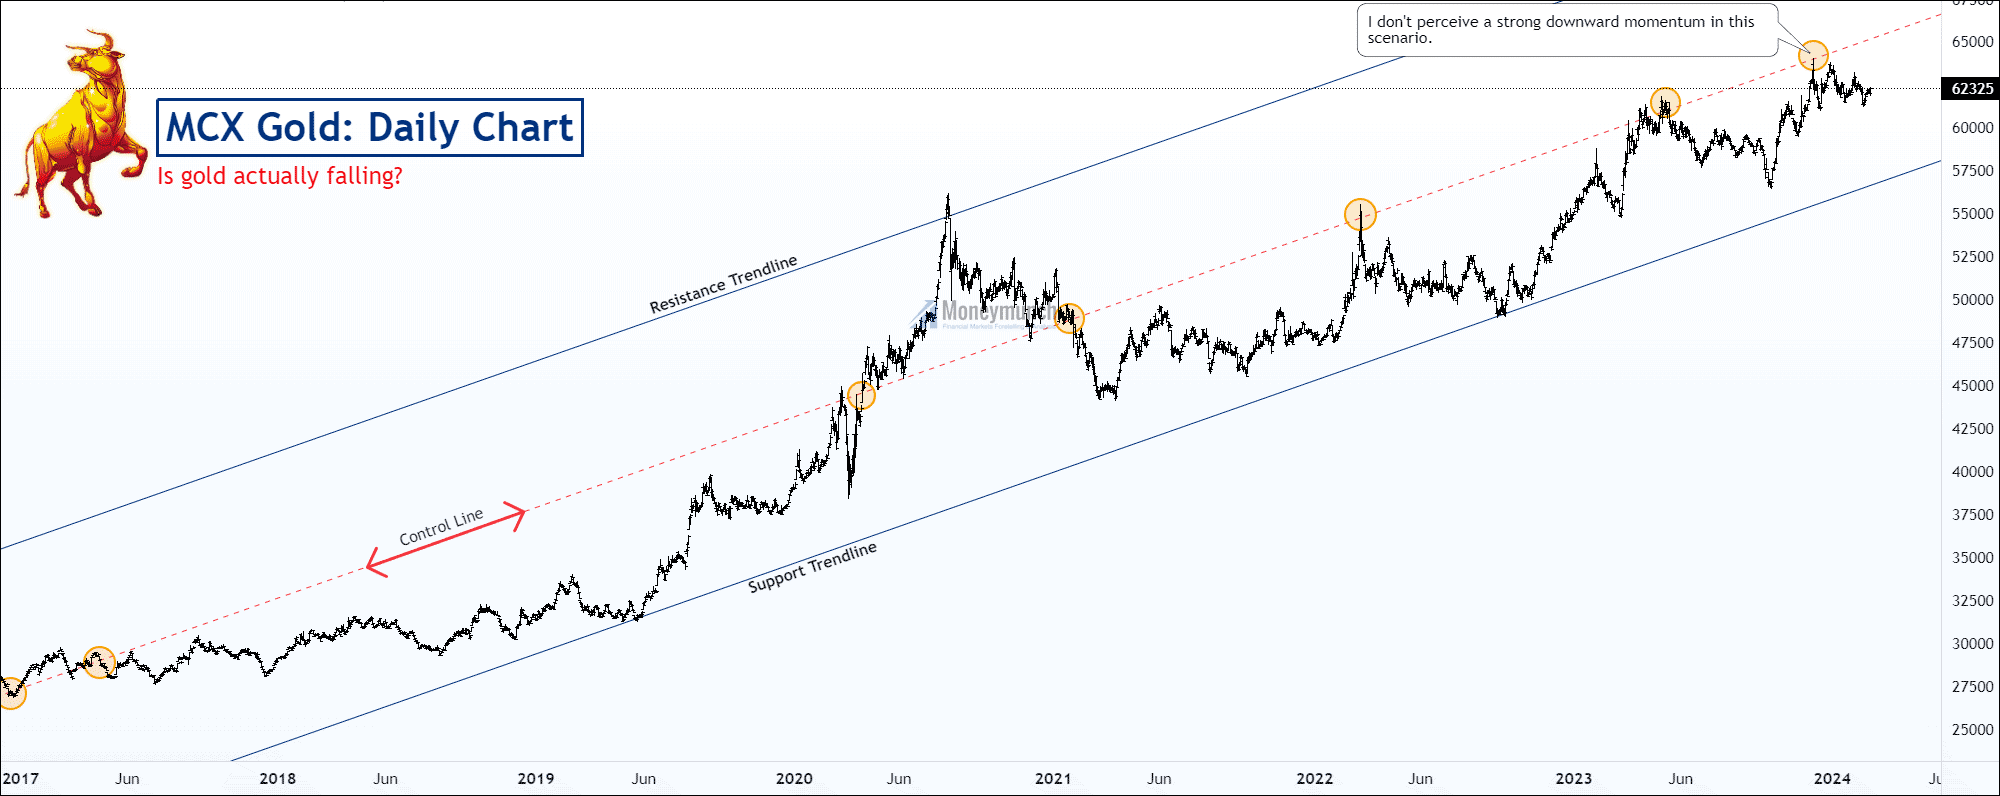
MCX Gold is currently moving within a parallel channel, suggesting potential upticks to 63600 – 64160 – 65000 levels. Last week, it rose by 0.75%, gaining 467 points. free commodity mcx daily chart tips Gold faces selling pressure near the Control Line. To maintain an upward trend, it must break the 62600 level. If not, it may drop to 61160 – 59600, especially for intraday traders. Key Economic Events: These events might affect gold, silver, crude oil, and natural gas prices: Continue reading
Part 1 – Monthly Examination of EUR/USD Utilizing Varied Approaches

Free forex EURUSD chart calls

Price action Breakdown Analysis:

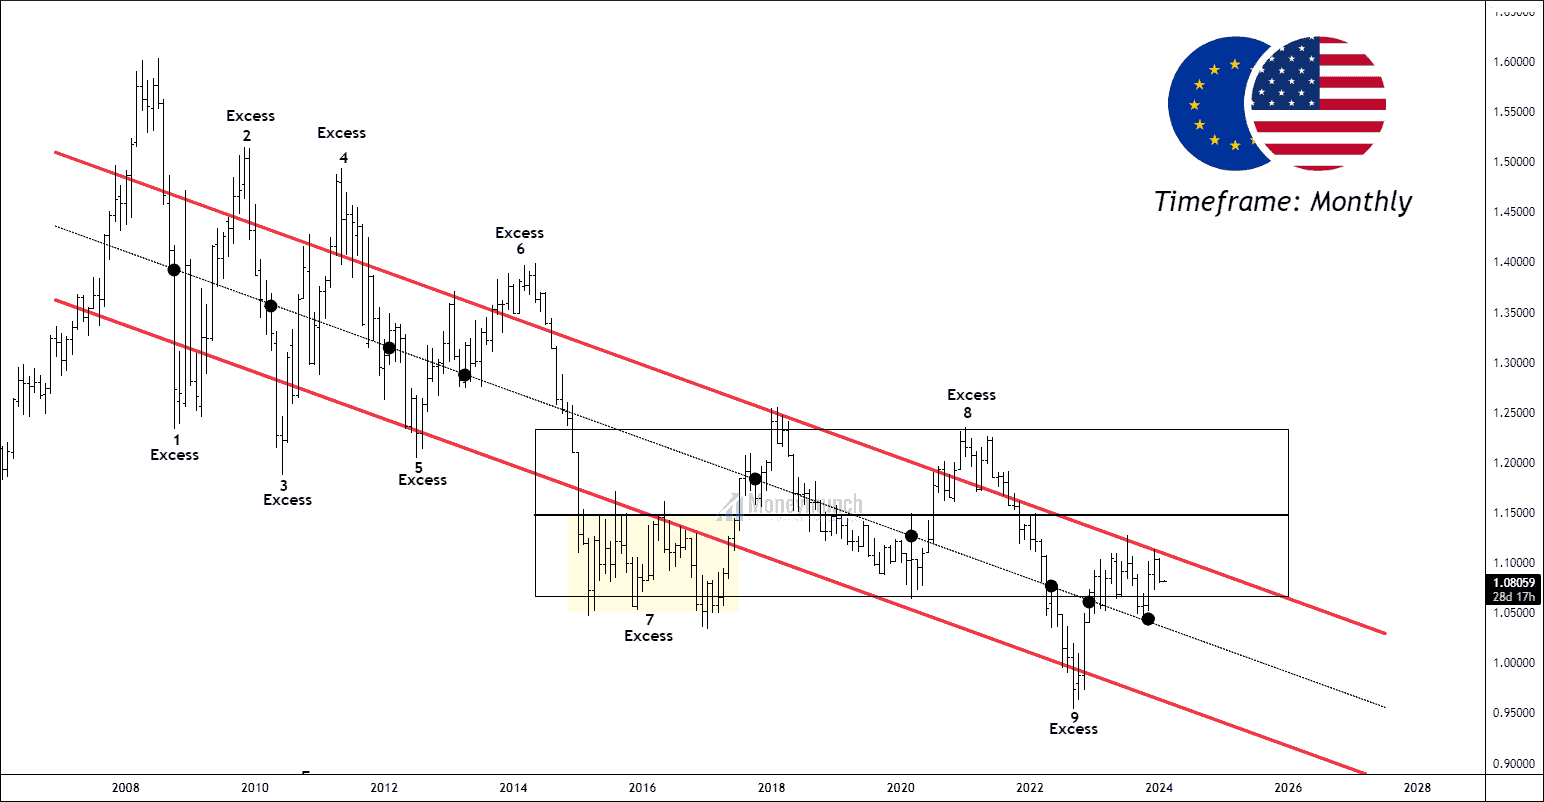
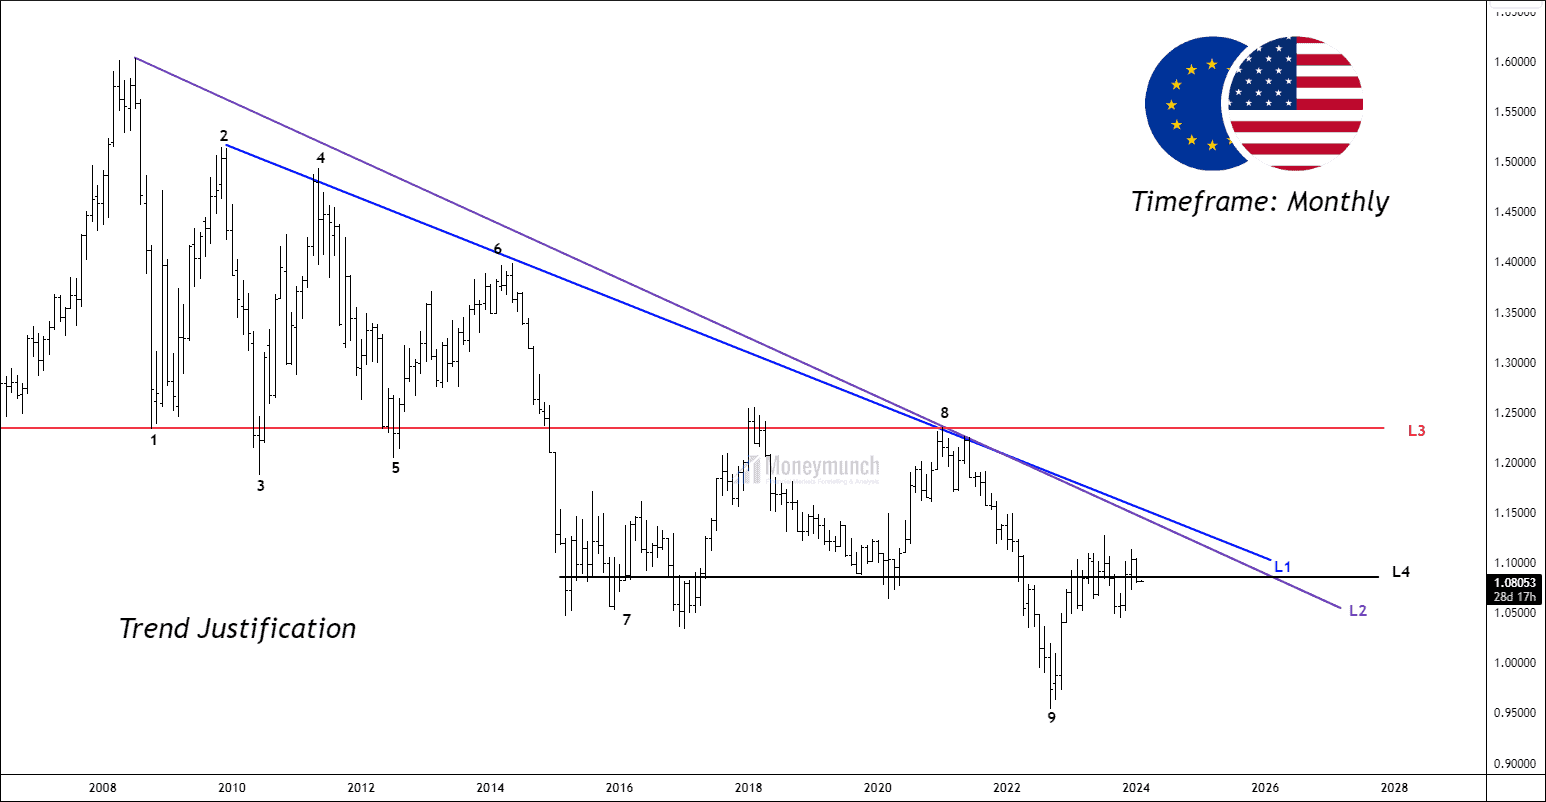
It is the EURUSD monthly timeframe, and it shows a downtrend for more than 15 years. The price has settled in a downward value area.

Elements of price action Breakdown:
  1. Excess:
    There are nine price excesses, four on the upper band and five on the lower band. It shows that the sellers were too aggressive when the price touched the upper band of the channel in comparison with the lower band at buyers. Buyers/Bulls tries makes the initiative to breakout the structure but end up when another party finds the price convenient for them. 
  2. Control line:
    The control line represents the gravitational force to the price. The price can’t stay away until it breaks the range. There are twelve touches on the control line, and few are mentioned on the chart.
  3. No Trading Activity Zone:
    No trading activity is the zone where one party, either bull or bear, takes control and outnumbers the other. There are a total of 14 no-trading activities zone. Both of the participants have seen each other.
  4. Sub-value area:
    A rectangle sub-value area has taken place from March 2015 till now. An excess became a great place to buy the move, yet the upper band of the sub-value area provides strong resistance. The control line of this value area at 1.1480 is sharp enough to act as a pivot level. It could be a resistance to the current price.
Free fx eurusd chart callsContinue reading