Timeframe: Daily
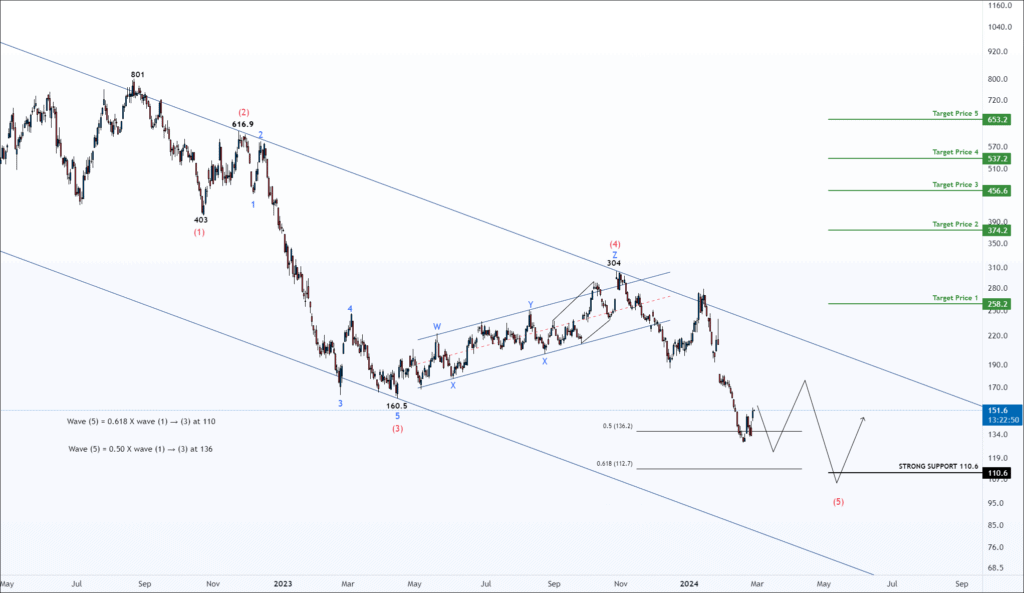
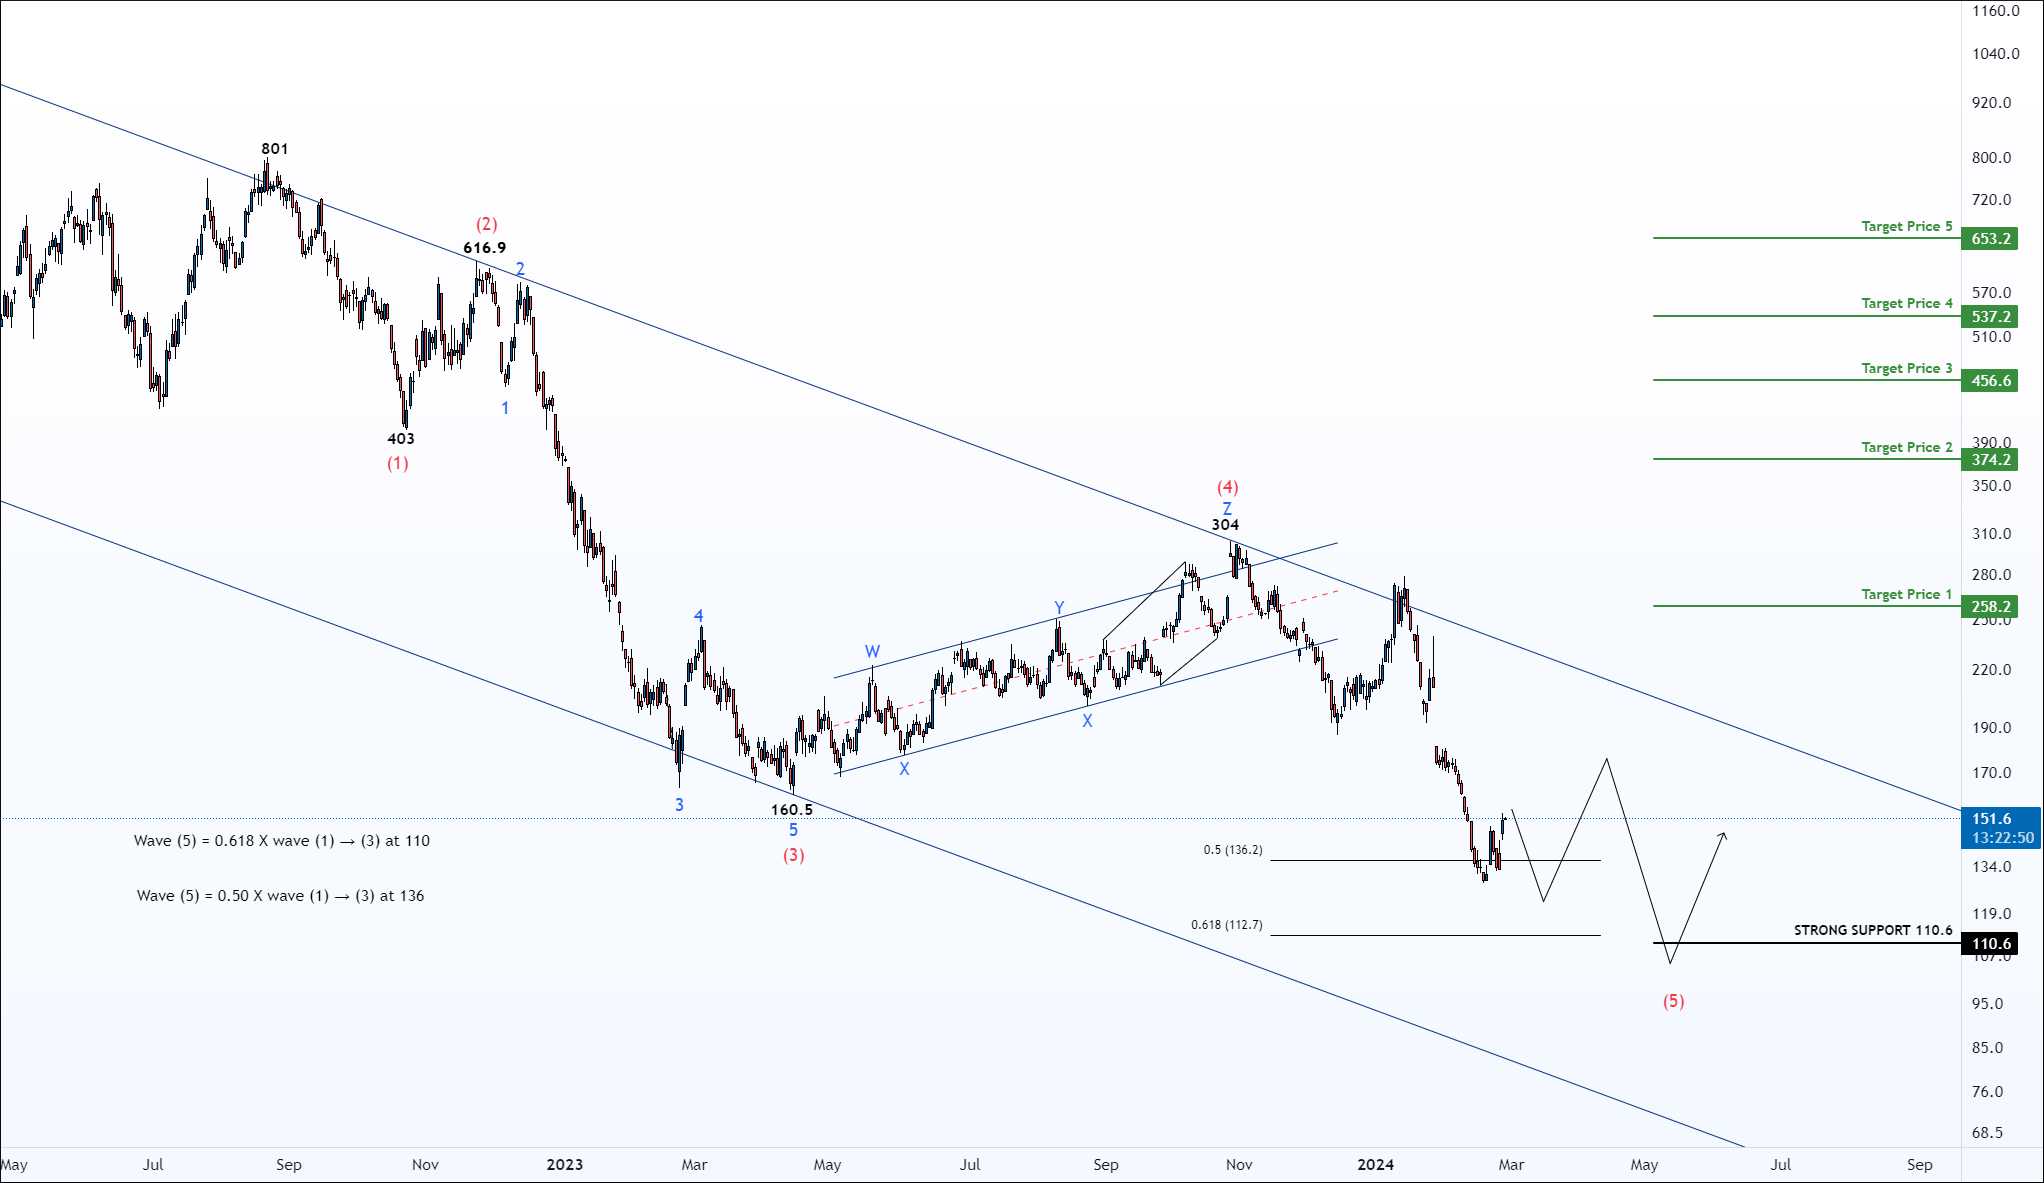
After reaching a peak at 801, the price underwent a significant bearish movement, amounting to more than an 83% decrease. This decline is categorized as an impulse, with a potential alternative being an A-B-C corrective structure. Currently, the price is situated below the 50/100/200 Moving Average lines, indicating a prevailing bearish sentiment.
Applying the Elliott Wave Principle, it appears that the price has completed a complex correction for wave (4) and has initiated a descent for wave (5). Within this sub-structure, wave 3 of wave 5 is currently unfolding. It is anticipated that wave (5) as a whole could terminate near the 50% retracement level of waves 1 through 3, around 136. Alternatively, it might reach the 61.8% retracement level at 110. The confluence of levels at 110 is expected to serve as robust support for potential buyers.
Only paying members can see how to trade this setup.
Get free MCX ideas, chart setups, and analysis for the upcoming session: Commodity Tips →
Have you any questions/feedback about this article? Please leave your queries in the comment box for answers.


 Lock
Lock
Tnx for sharing
Happy to see this chart. I was looking for the natural gas wave analysis for longtime.
Sir, kindly share research on gold and silver.