Mr.Dev (s)

Mr.Dev(s) is a team of non-biased certified technical and research analysts with extensive experience in the financial markets dating back to 1997. They accurately forecast market movements and position their clients accordingly. They are popular online contributors on many channels and platforms, known for their non-biased advice and commitment to helping investors make informed decisions. The team is also the founder of forex account management services on Moneymunch.com, demonstrating their knowledge and experience in the financial world. Investors can rely on Mr.Dev(s) for research reports and opinions, as well as trading guidance.

Join Today (Free): Commodity Tips | Forex Signals

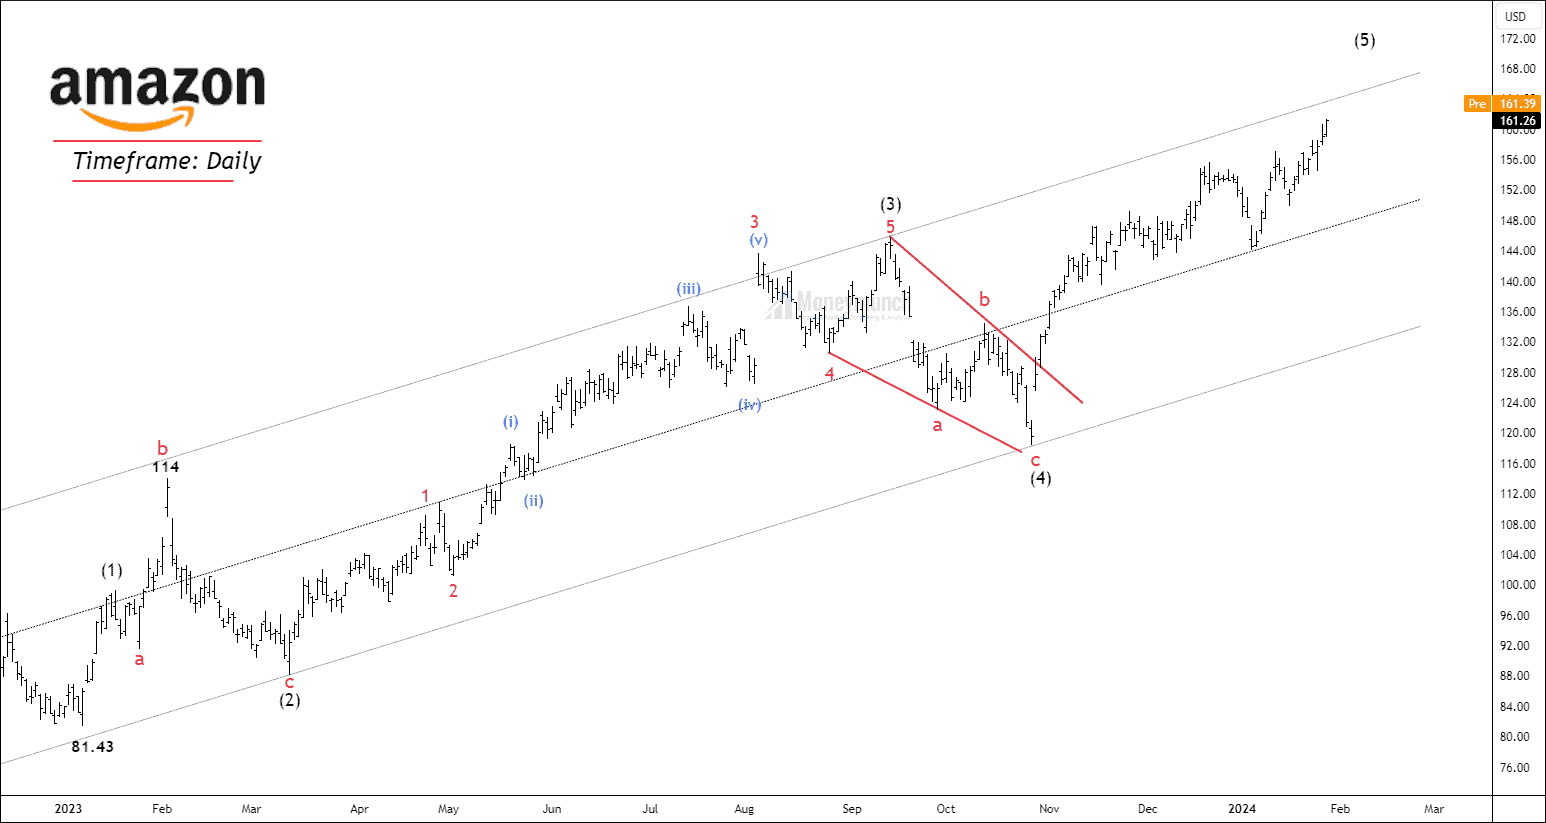
NASDAQ AMAZON – Wave Strength Analysis On Daily Chart

Free nse amazon chart calls

NASDAQ AMZN has started an impulsive cycle from 81.33, and the price is forming the final wave (5). The price has accomplished a corrective wave (4) and formed sub-waves of the impulsive wave (5). Wave Formation & Fibonacci relationships: Wave (2):
  • Wave 2 has formed an expanded flat with a 3-3-5 structure.
  • Price retraced 78.6% of wave (1).
Wave (3):
  • Wave 3 has constructed a motive structure.
  • Wave 3 is an extensive wave with a 3.618 multiple of wave (1).
  • The sub-structure and element structure is visible.
Wave (4)
  • Wave 4 is a zigzag formation and can be mentioned as a triangle by changing the labels.
  • Wave (4) retraced 50% of wave (3).
Wave (5)
  • The structure of wave (5) does not look like an ending diagonal. So, the last option for us is to assume it is an impulse.
  • The common Fibonacci relationships are: – Wave 5 = Wave 1 – Wave 5 = 0.618 reverse Fibonacci of wave 4 – Wave 5 = 0.618 X Waves 1 through 3 – The upper band of the parallel channel and throw-out out in many cases.

ADX (average directional index): The ADX (14-day setting) shows strength coming but doesn’t advocate the cause of the shart surge. Traders must note to take high probability traders after ADX crosses 30. It only measures whatever trend it is, should one trade or not, by measuring the strength of the trend. ADX level of 22 shows that the market can be choppy in many instances. Weekly Trend: The weekly trend looks strong, as the price has broken out a crucial resistance zone at 143. If the weekly trend & Daily trend are bullish, day traders can take long traders to be within the trend. To look in-depth, we have to analyze the shorter timeframe. This way, we can get a clear story of wave (5) before initiating any position.Continue reading

Gold & Aluminum Updates: Hits Target Prices Swiftly

Did you check out yesterday’s newsletter about gold? If not, you can read it here: Gold Price Analysis – Key Levels and Targets for Intraday Traders
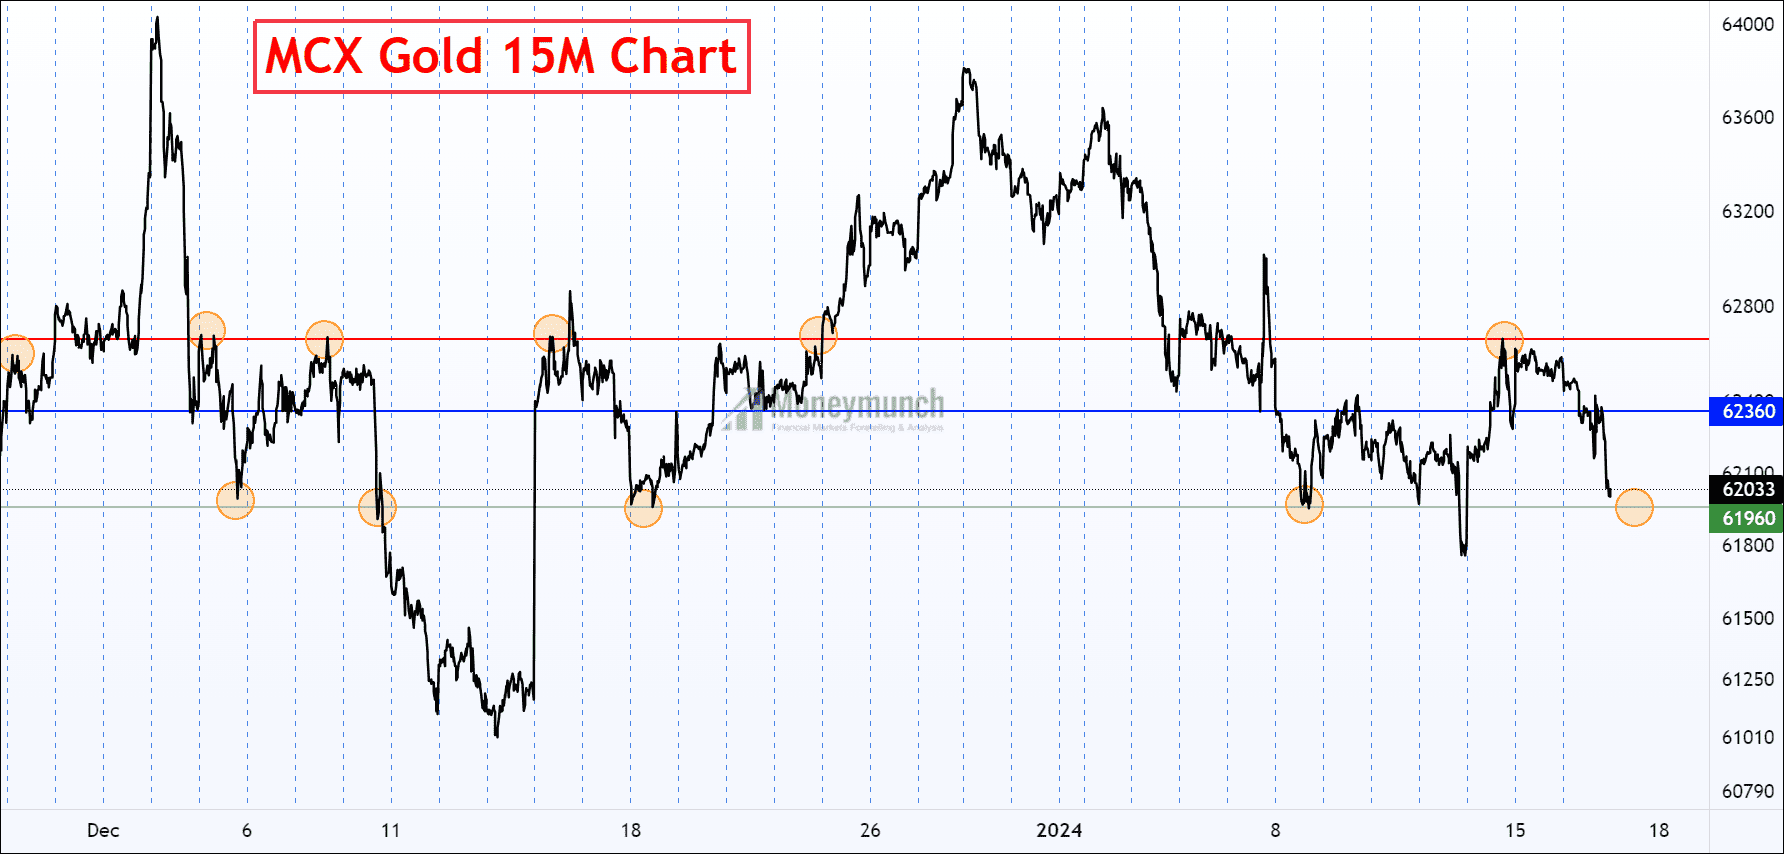
Highlighted in bold yesterday, we emphasized, “Finding a foothold at 61960, MCX Gold prices hinge on a crucial juncture. A crossover and break today could lead to target prices of 61860, 61760, and 61560.”
mcx gold tips target

Gold successfully achieved all target prices within a single trading session.

Reminder to our premium subscribers: Aluminum Reportit’s on the verge of hitting our first target.Continue reading

MCX Zinc & Aluminum: Technical Insights

free commodity market mcx zinc daily chart and tips

MCX Zinc Analysis

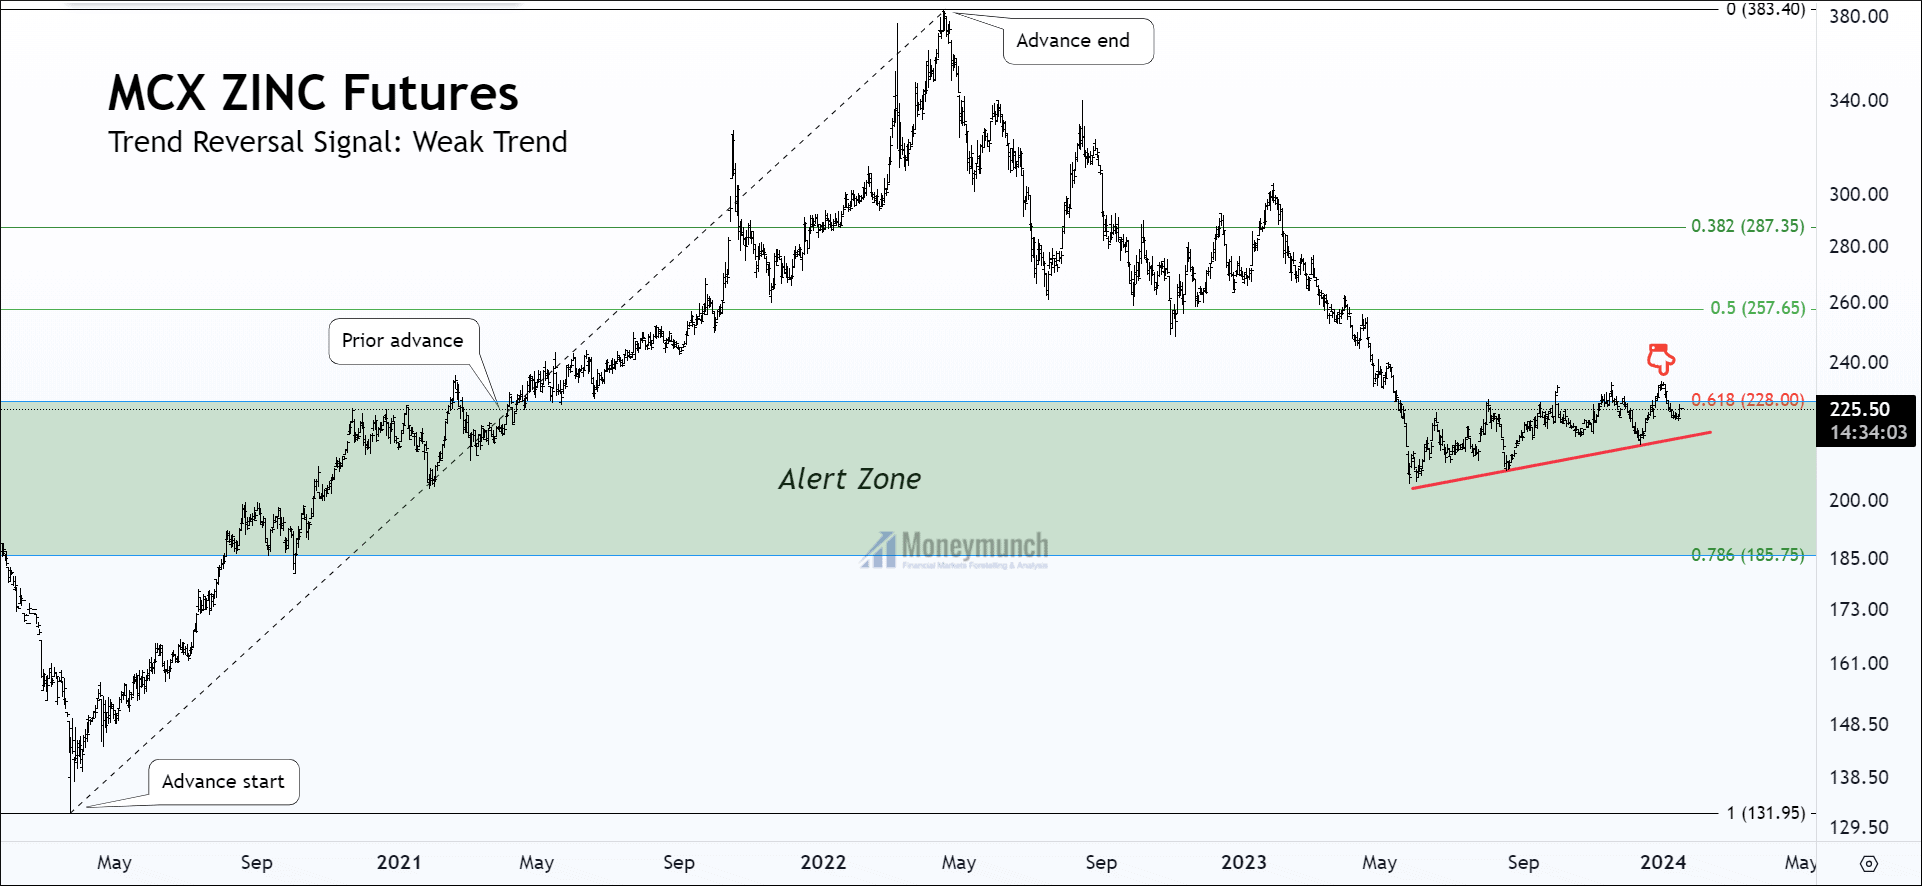
Examining the daily chart of MCX Zinc utilizing Fibonacci retracement, notable developments are observed. In May 2023, Zinc breached the 61.8% retracement level but did not test the subsequent level at 78.6%. Instead, it retraced back to the 61.8% level. The pivotal level of 228 suggests that the downtrend in Zinc may have concluded. This level holds significance as it could propel Zinc upwards, targeting levels of 236, 242, and potentially 257.6.

According to the principles of Fibonacci retracement, a weak trend reversal signal is indicative of a weak trend. Therefore, if Zinc breaches the red trendline, a potential downside with target prices of 212, 206, and 200 could be anticipated. Caution is advised between the 61.8% retracement level and the trendline.

MCX Aluminum Outlook

Get free MCX ideas, chart setups, and analysis for the upcoming session: Commodity Tips

Have you any questions/feedback about this article? Please leave your queries in the comment box for answers.

Disclaimer: The information provided on this website, including but not limited to stock, commodity, and forex trading tips, technical analysis, and research reports, is solely for educational and informational purposes. It should not be considered as financial advice or a recommendation to engage in any trading activity. Trading in stocks, commodities, and forex involves substantial risks, and you should carefully consider your financial situation and consult with a professional advisor before making any trading decisions. Moneymunch.com and its authors do not guarantee the accuracy, completeness, or reliability of the information provided, and shall not be held responsible for any losses or damages incurred as a result of using or relying on such information. Trading in the financial markets is subject to market risks, and past performance is not indicative of future results. By accessing and using this website, you acknowledge and agree to the terms of this disclaimer.

MCX GOLD & SILVER – Trading Insights & Update

MCX Gold Technical Analysis: A U-Turn in the Control Channel Signals Potential Targets

Have you traded MCX GOLD price action analysis?
Click here: MCX Gold Technical Analysis: A U-Turn in the Control Channel Signals Potential Targets

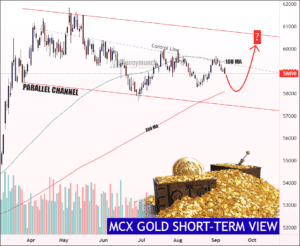
We had mentioned clearly, It is reasonable to anticipate potential price levels at 58660, 58360, and 58000 before the commodity resumes its upward trend.

Timeline: [12 September 2023]
  • 04:45 PM – Price touched the first target of 58660.
[14 September 2023]
  • 06:00 PM – MCX GOld Touched the second target of 58360
If you have traded this setup, you could have made more than ₹63,300 / lot. We will update further information for premium subscribers soon.Continue reading