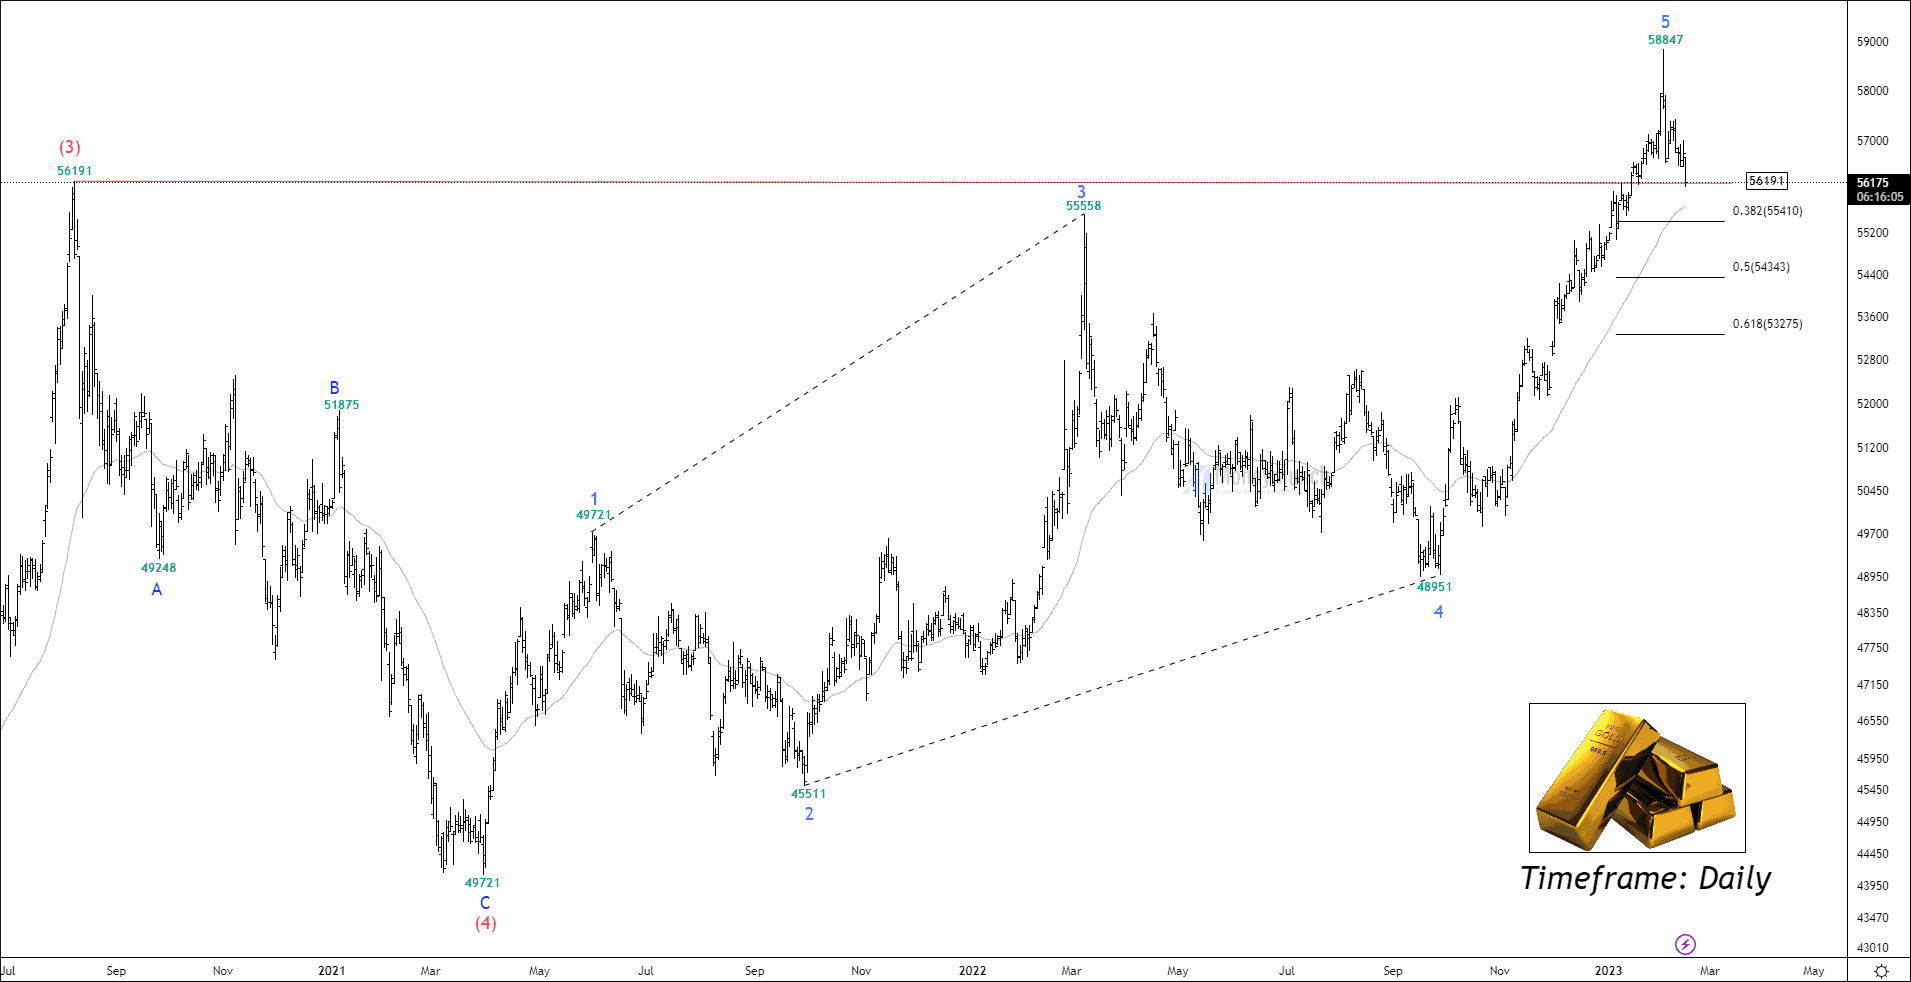
EWT – Is MCX Gold Preparing For A Steep Correction?
MCX MENTHAOIL – Trade Setup
 Unlock This Article
Only subscribers can read the full article. Please login to read the entire article.
Will MCX Gold Hit The Final Target?
Did you read MCX Gold’s Previous Research Report?
Click here: Will gold’s uptrend survive till the 60000 level?
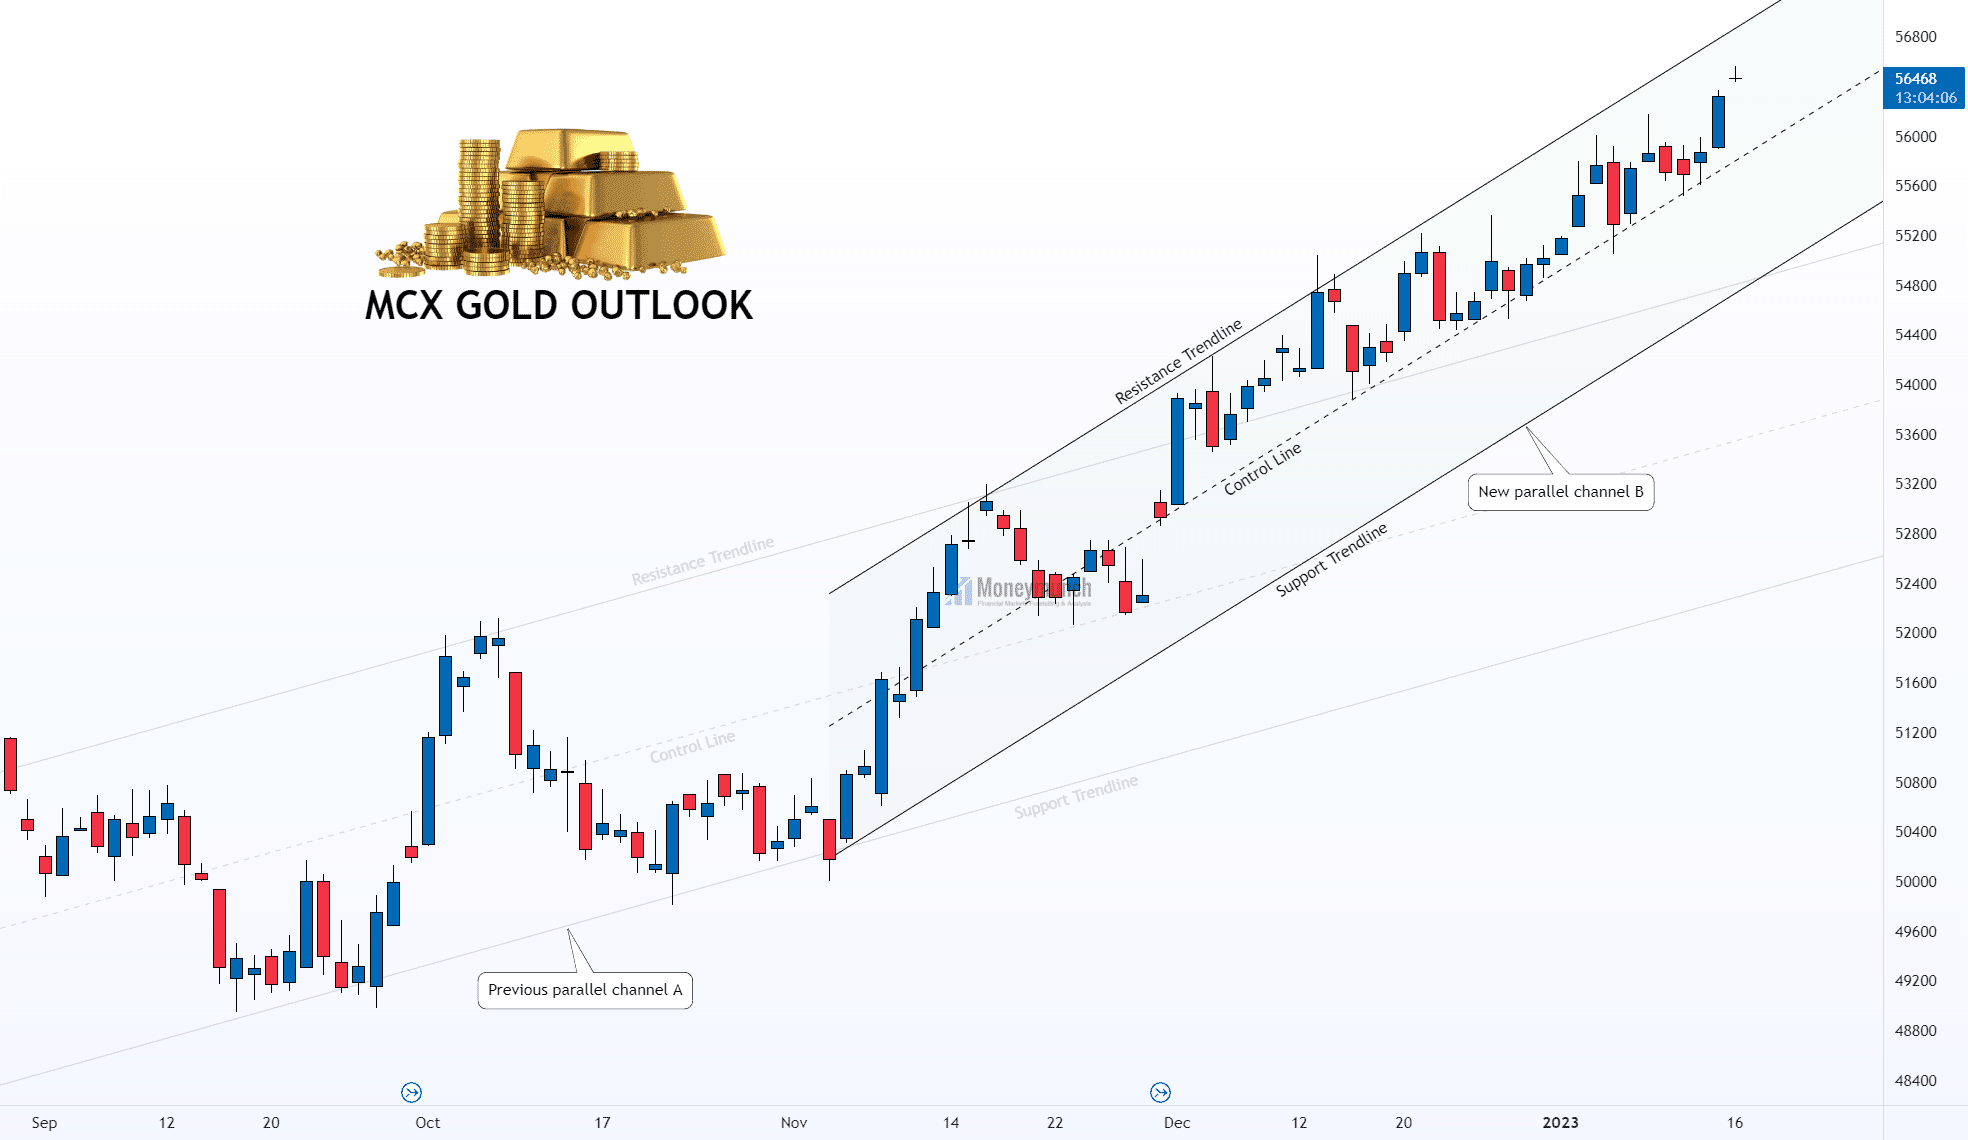
I have written clearly, I don’t see any reversal sign still yet. Hence, we can expect 56800 – 57000 – 57200+ levels.”
Timeline: [20 January 2023]
- 01:34 PM – Price touched the first target of 56800.
- 09:00 AM – Price hit the final target of 57000.
- 09:22 AM – MCX Gold made a new high of 57099.
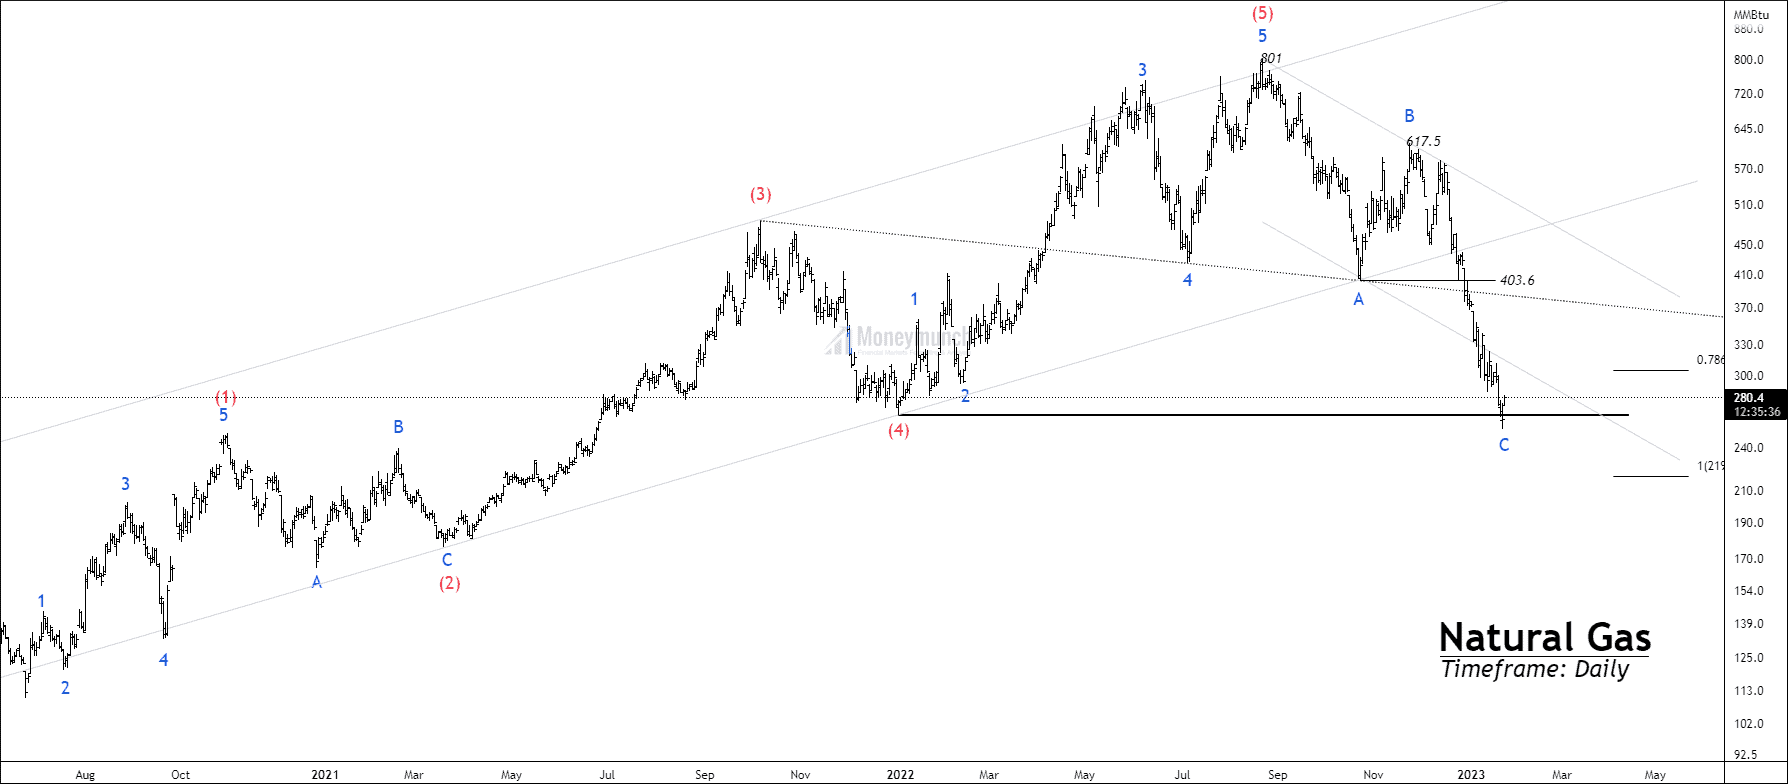
EWT – Is Natural Gas Prepared for a Reversal?
In our previous article, we discussed impulsive wave C and its continuation. On 20 January 2023, Price achieved our all given targets.
Click here: MCX Natural Gas – Elliott Wave projection
 Continue reading