
Price action Breakdown Analysis:
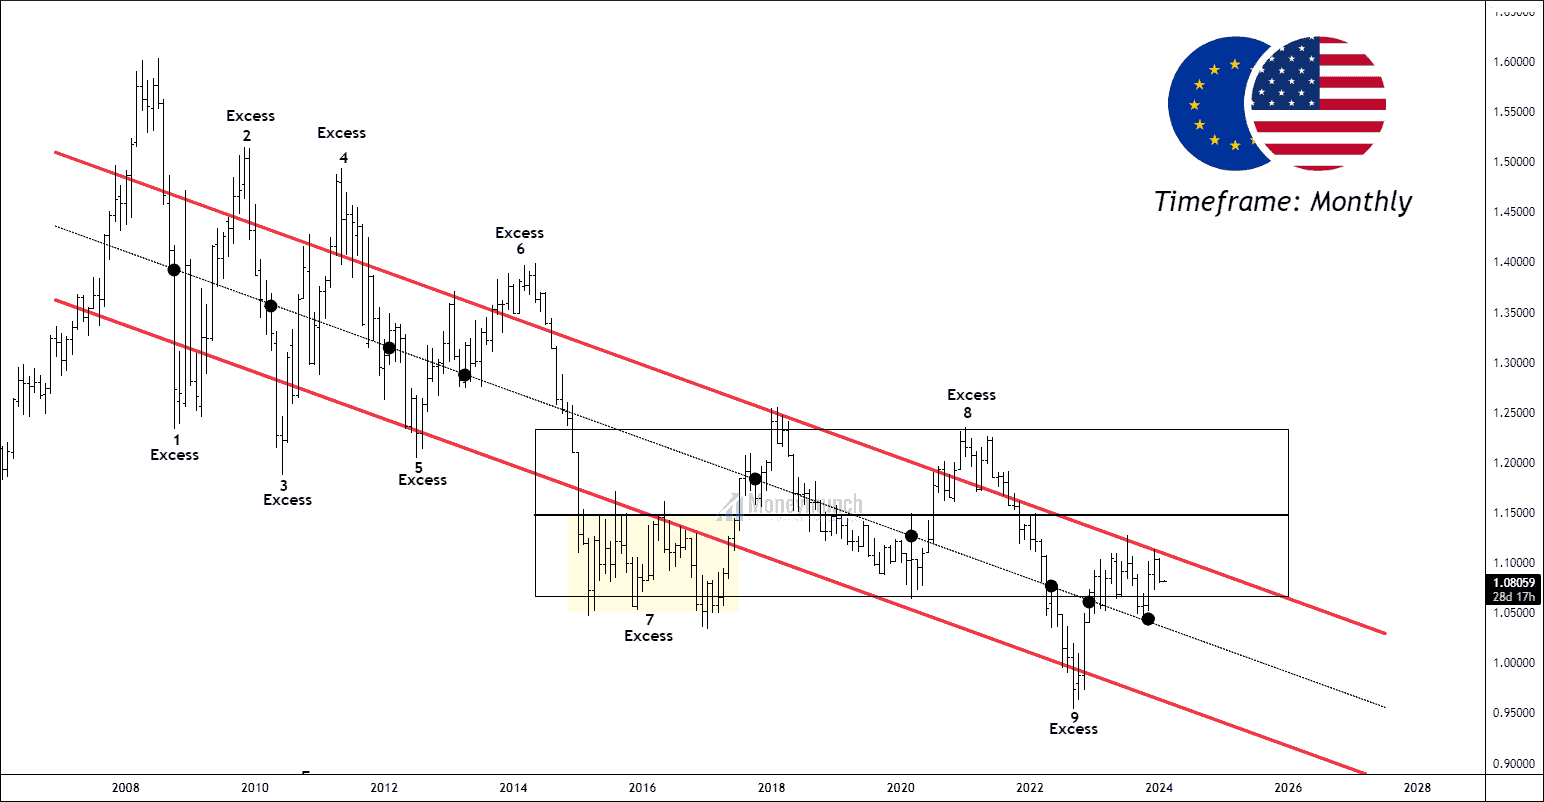
It is the EURUSD monthly timeframe, and it shows a downtrend for more than 15 years. The price has settled in a downward value area.
Elements of price action Breakdown:
- Excess:
There are nine price excesses, four on the upper band and five on the lower band. It shows that the sellers were too aggressive when the price touched the upper band of the channel in comparison with the lower band at buyers. Buyers/Bulls tries makes the initiative to breakout the structure but end up when another party finds the price convenient for them. - Control line:
The control line represents the gravitational force to the price. The price can’t stay away until it breaks the range. There are twelve touches on the control line, and few are mentioned on the chart.
- No Trading Activity Zone:
No trading activity is the zone where one party, either bull or bear, takes control and outnumbers the other. There are a total of 14 no-trading activities zone. Both of the participants have seen each other. - Sub-value area:
A rectangle sub-value area has taken place from March 2015 till now. An excess became a great place to buy the move, yet the upper band of the sub-value area provides strong resistance. The control line of this value area at 1.1480 is sharp enough to act as a pivot level. It could be a resistance to the current price.
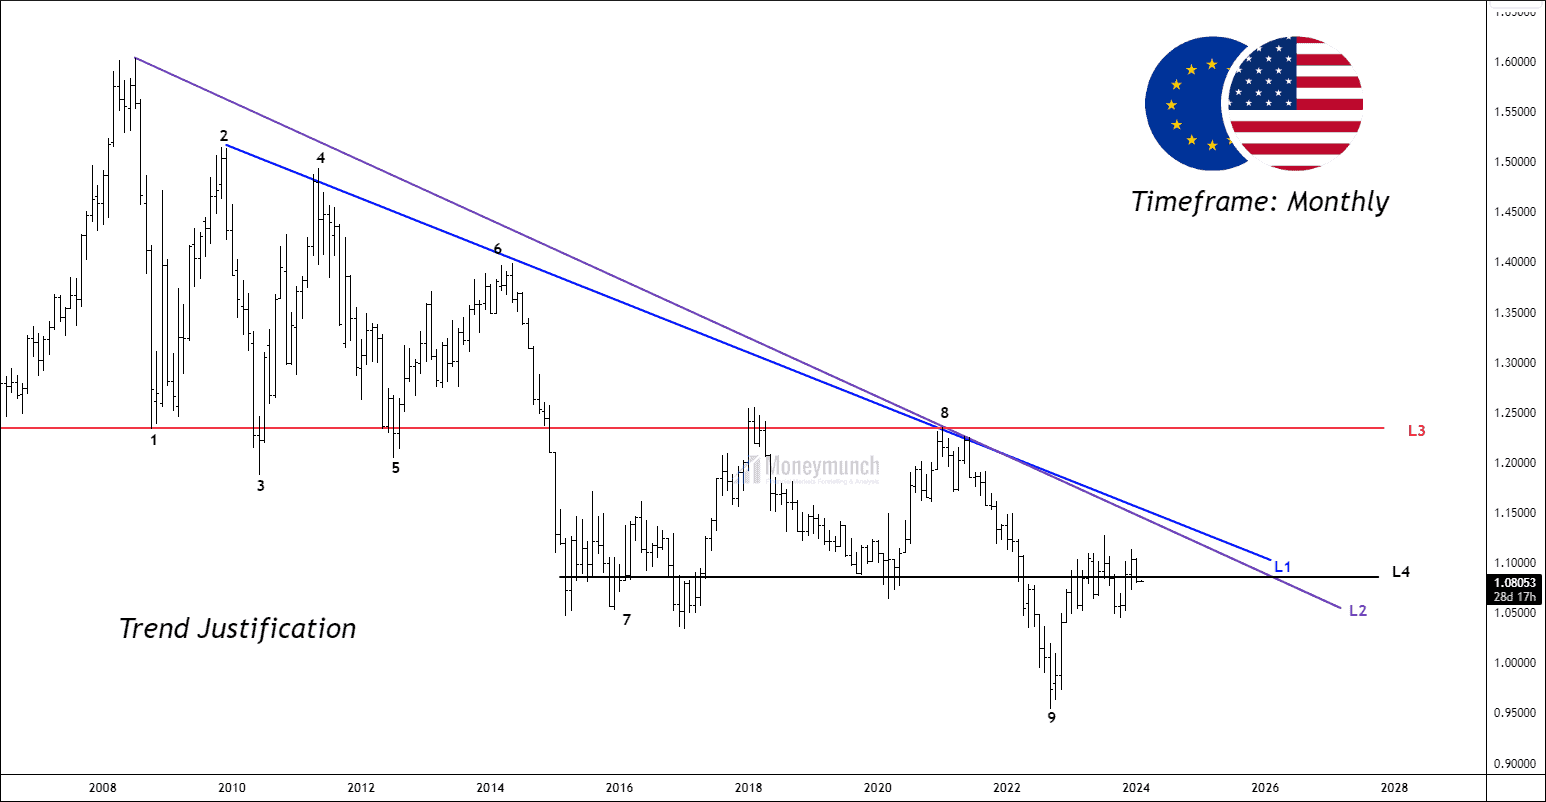
Trend Justification:
Justification for the current market trend and the behavior of bulls and bears can be derived from four prominent lines on the chart.
Line 1, the lengthiest on the chart, connects the points from 1.5760 to the latest high at 1.2555. This line also intersects with the second line, indicating that a breakout in one line would likely trigger a simultaneous breakout in both lines.
Line 2 stands out as the most robust resistance line, evidenced by the price experiencing significant declines on more than three occasions upon reaching this line. Therefore, the continuation of the uptrend appears contingent upon a successful breakout above resistance line 2.
Line 3, marked at 1.23427, serves as a horizontal resistance line. This line has played a crucial role, offering three supports and encountering two resistances. A substantial upward movement could potentially alter the overall trend post-breakout, given that it represents a lower high in the downward trend.
Line 4 represents a support level in close proximity to the current price, suggesting a potential stabilizing factor for the market at its current position.
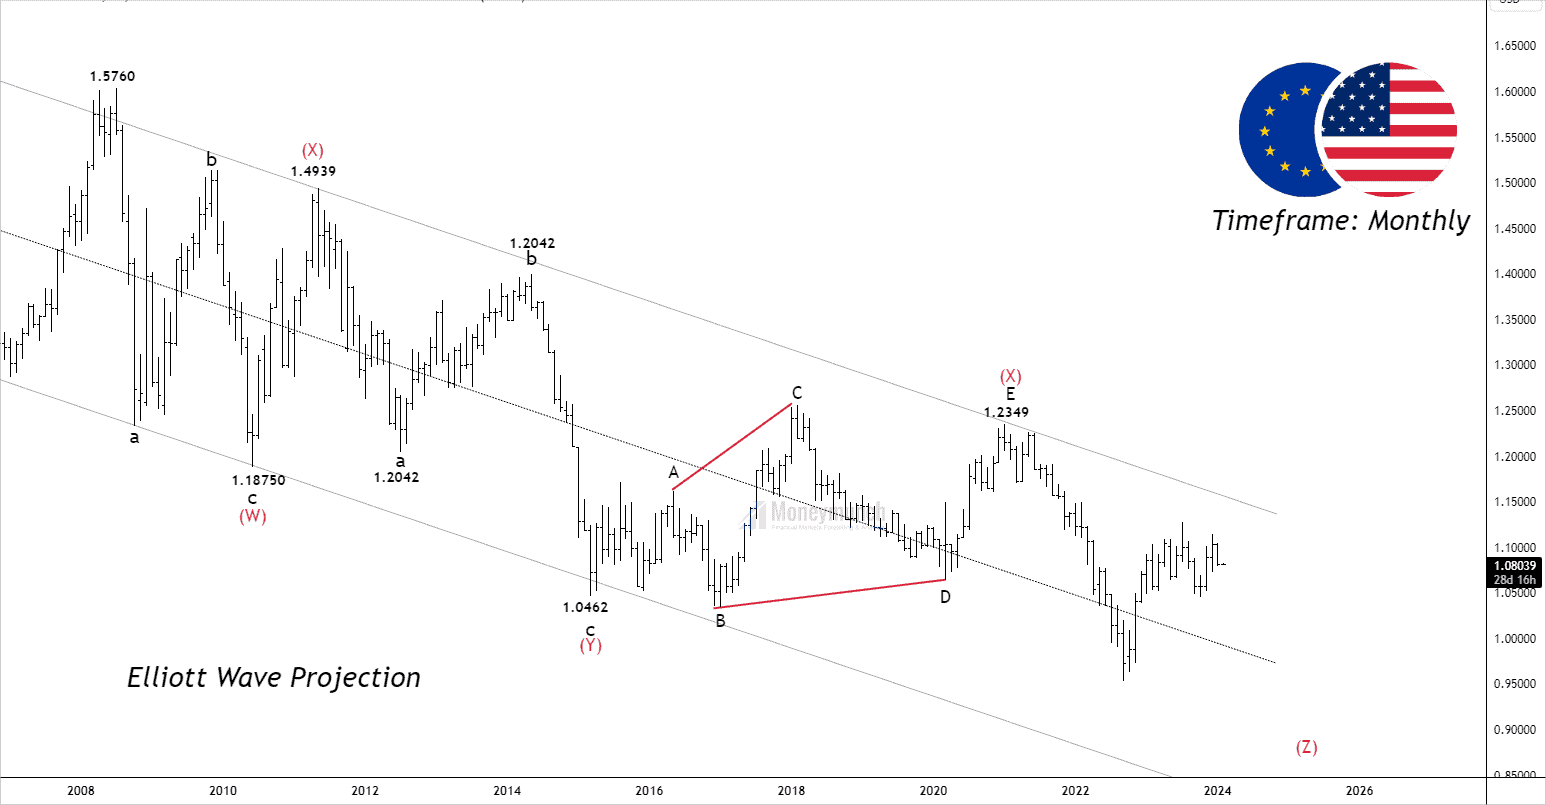
Elliott Wave Projection:
According to Elliott wave analysis, the price has been undergoing a W-X-Y-X-Z formation, specifically identified as a triple zigzag, over a span of 15 years. The sequence involves the completion of wave (X) and the initiation of a downward impulsive wave denoted as (Z).
The Wave Formation unfolds as follows:
- Wave (W): A flat correction pattern characterizes the formation of Wave (W).
- Wave (X-1): Wave (X) takes shape in a standard zigzag formation, retracing 78.6% of Wave (W).
- Wave (Y): This phase sees the construction of a zigzag pattern within Wave (Y), extended 1.618% of Wave (W)
- Wave (X-2): Wave (X) materializes as an expanding triangle, retracing 50% of Wave (Y).
- Wave (Z): The ongoing Wave (Z) is currently in progress, appearing to form sub-wave C. Notably, Wave (Z) has extended to 78.6% of Wave (Y).
For Bulls traders, a prudent entry point is identified as the breakout of Wave (X) at the level of 1.2349. No risky trader should initiate Long position until it breaks out Line 1 & Line 2.Wave (Y) = Wave (Z) at 0.8838. So, After the accomplishment of sub-wave B of wave (Z), traders can sell for final wave C of wave (Z).
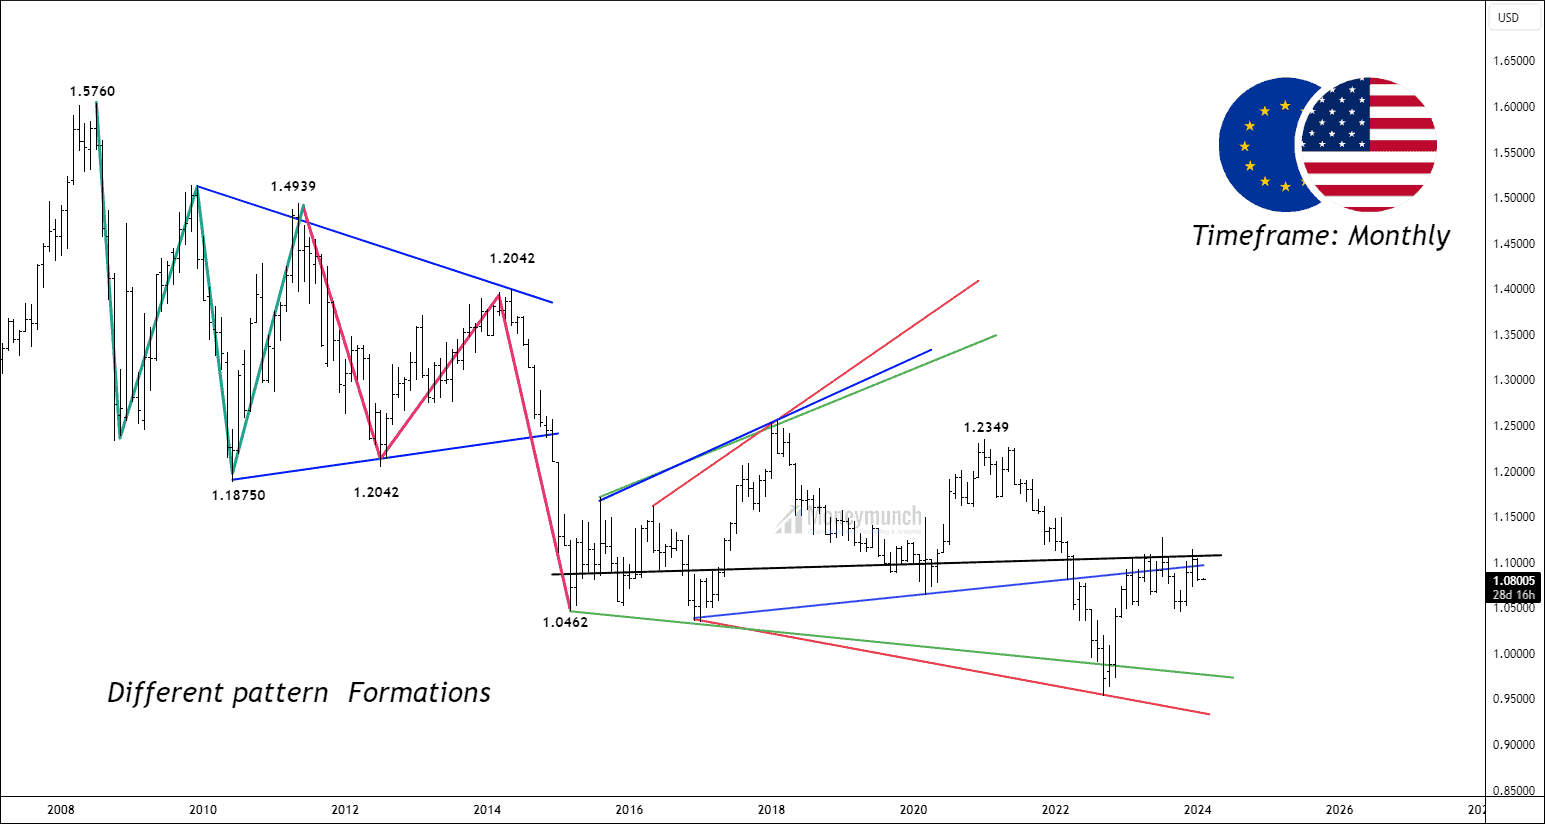
Different pattern Formation:
Traders can see the following patterns on the monthly charts:
1. Wamine pattern
2. Contracting Triangle
3. Wave Diagonal
4. Expanding Triangle
5. ABCD Pattern
6. Moolahs pattern
We will Update Further information on weekly & Daily time frame soon.
Get free forex & currency ideas, chart setups, and analysis for the upcoming session: Forex Signals →
Want to get premium trading alerts on GBPUSD, EURUSD, USDINR, XAUUSD, etc., and unlimited access to Moneymunch? Join today and start potentially multiplying your net worth: Premium Forex Signals
Premium features: daily updates, full access to the Moneymunch #1 Rank List, Research Reports, Premium screens, and much more. You΄ll quickly identify which commodities to buy, which to sell, and target today΄s hottest industries.
Have you any questions/feedback about this article? Please leave your queries in the comment box for answers.