
TARGETS:
Traders can initiate short positions for the following targets:
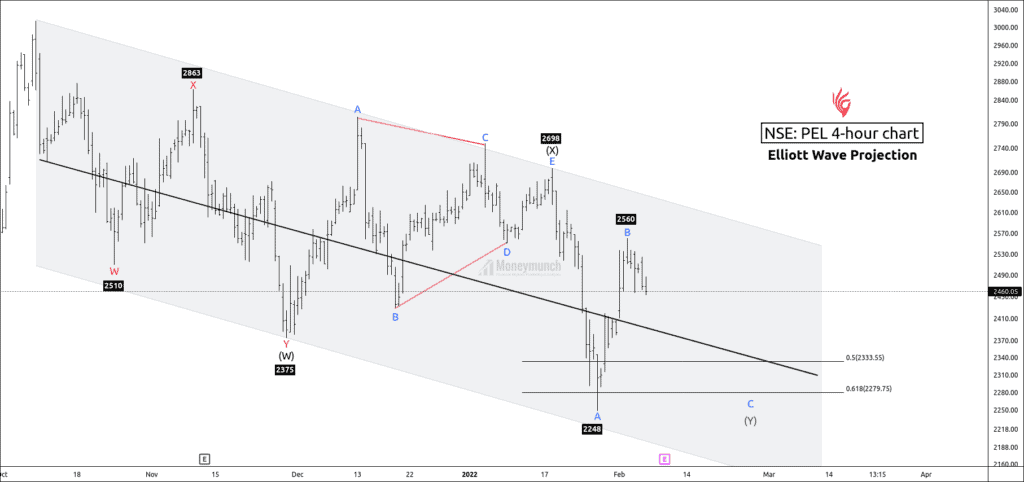
2400 – 2376 – 2301 – 2279
BUT DON’T TRADE BLINDLY. Read this following research to get how it is making selling opportunities for the intraday traders.
PEL is forming a double combination pattern on the 4-hour timeframe chart. Price has constructed LL(lower-low) and LH(lower-high) to confirm the bear’s existence.
Wave Formations:
Wave (W) is a double zigzag formation with seven wave structures.
Wave (X) is a contracting triangle with five sub-wave structures.
Wave (Y):
Sub-wave wave A & B has occurred, and wave C is progressing.
Sub-wave B has completed at 61.8% Fibonacci retracement of wave A at 2531.
The culmination point of wave C:
Wave C can end at 61.8% of wave A at 2279.
Wave C can cease at 50% of wave A at 2333.
Wave C can conclude at the control line, and 61.8% of wave ((W)) at 2376.
After completion of wave C, the price will start its bull run.
To become a subscriber, subscribe to our free newsletter services. Our service is free for all.
 Unlock This Article
Get free important share market ideas on stocks & nifty tips chart setups, analysis for the upcoming session, and more by joining the below link: Stock Tips
Have you any questions/feedback about this article? Please leave your queries in the comment box for answers.
Nice chart sir
Awesome…thanks for the clarification
new learning. Thank you
excellent
very good bro.. keep rocking..
nicely clarified