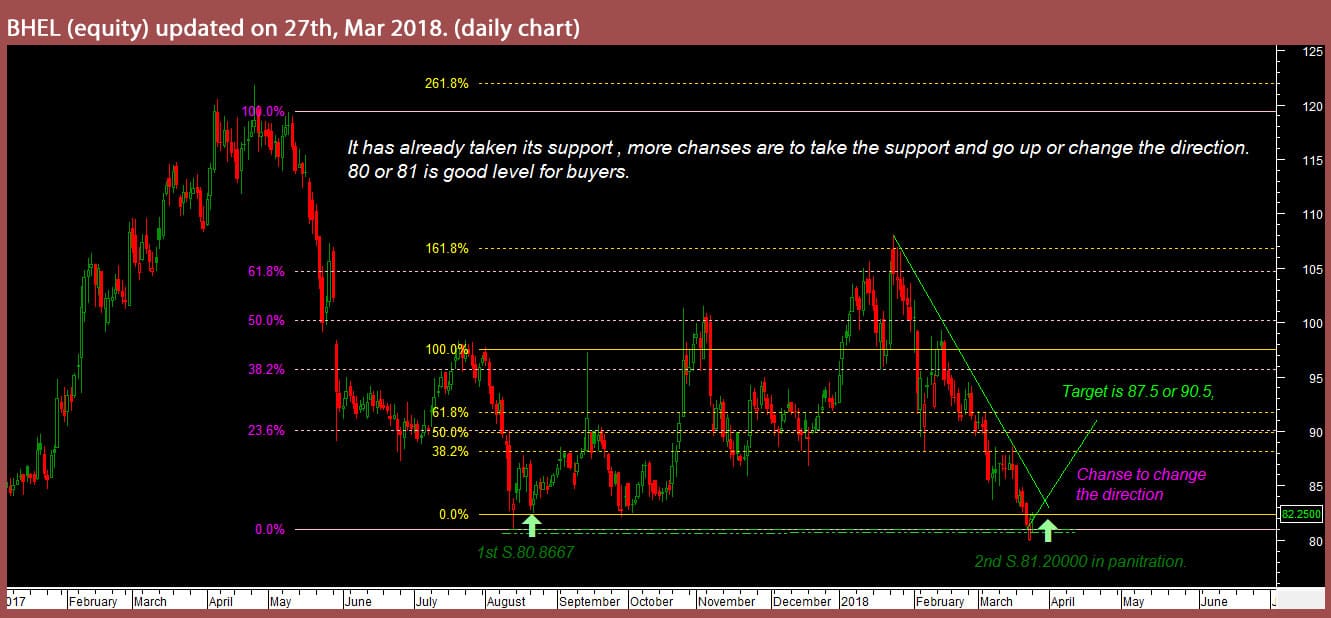
Buy Bhel : It will blast any time.

BHEL, actually till good for buy. As per chart, the best level for buy 81.2 nearby for targets 86.6 and 90.4. In fact, We have sent this call to our paid subscribers also this morning with same level mentioned in chart. There are nothing to worry above 78 in the BHEL.

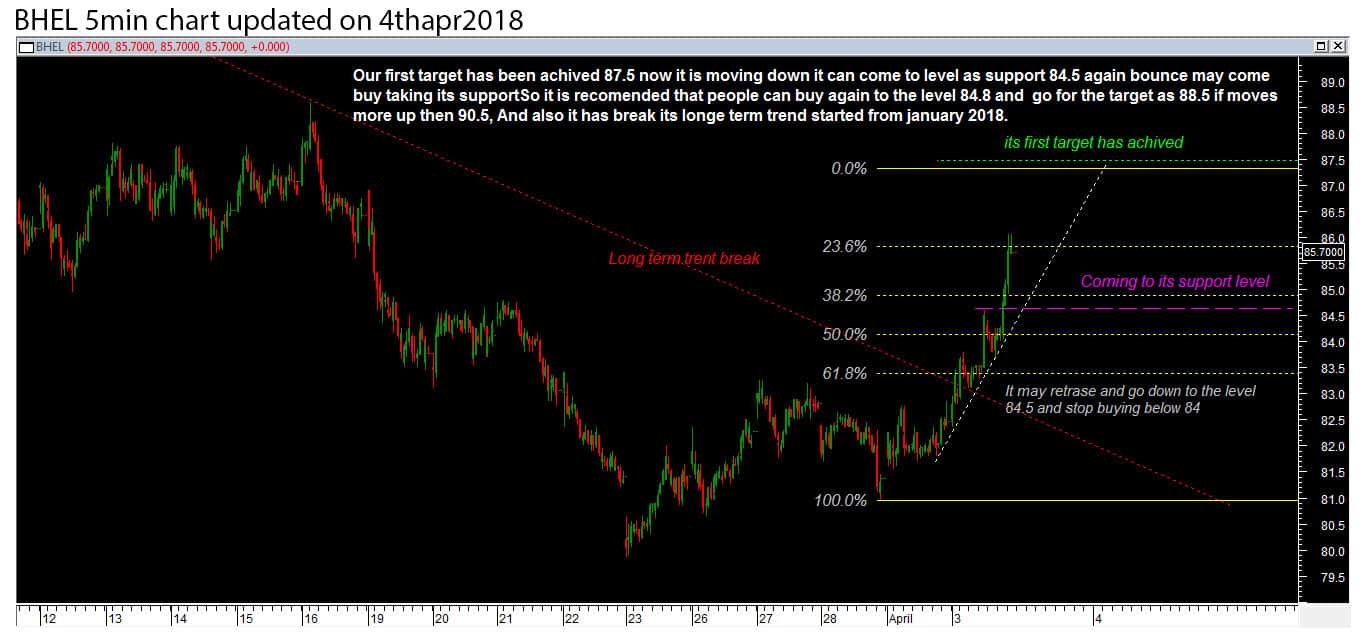
Update date and Time: 1:30 PM (4rth, april 2018)

If you are waiting to enter in BHEL or you have already booked profit at 87(our first target), then you have again chance to enter with retracement of BHEL 83.65 to 84.8. And go for again target as mentioned first chart 87 and 90.4

To become a subscriber, subscribe to our free newsletter services. Our service is free for all.
Continue reading

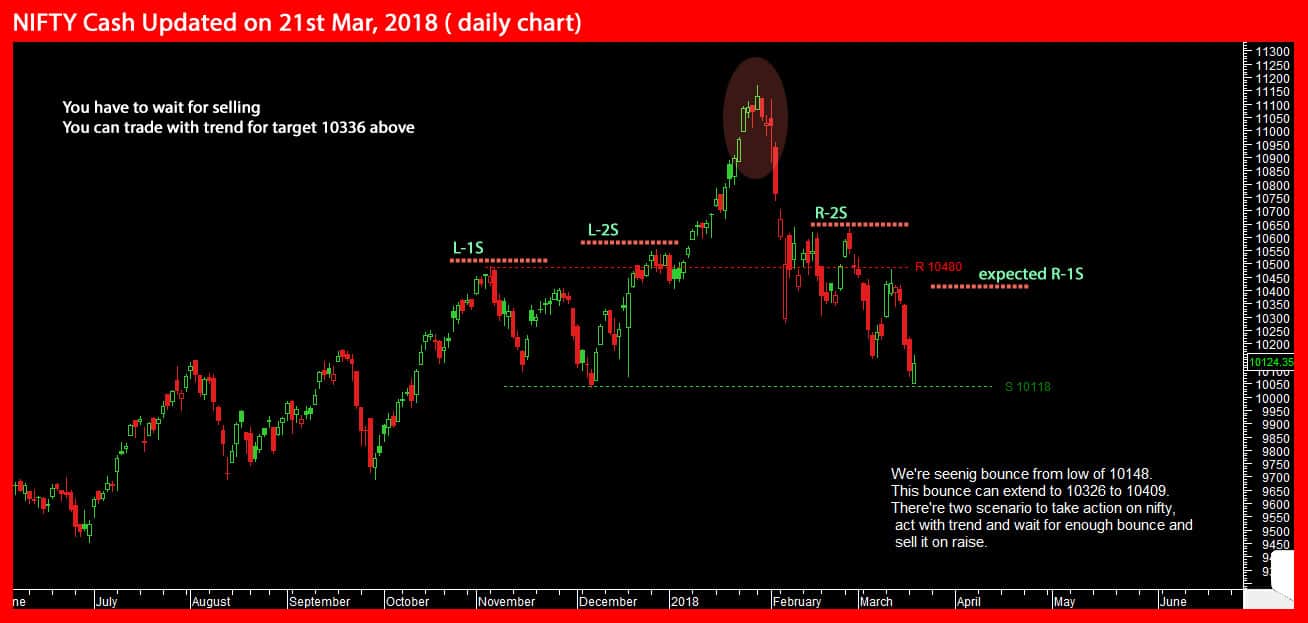
NIFTY: This bounce can extend to 10326 to 10409.

We’re seeing bounce from low of 10148. This bounce can extend to 10326 to 10409.

They’re two scenario to take action on nifty:

Act with trend  Or wait for enough bounce and sell it on raise. And another is, buy with trend.

To become a subscriber, subscribe to our free newsletter services. Our service is free for all.
 

Upcoming Points:

  • Political situation given the election schedule this year.
  • FOMC Meeting due later on Wednesday.
Continue reading

The fascinating interplay between traders and Nifty50

Since many days we didn’t applaud any chart, we regret  for your inconvenience.

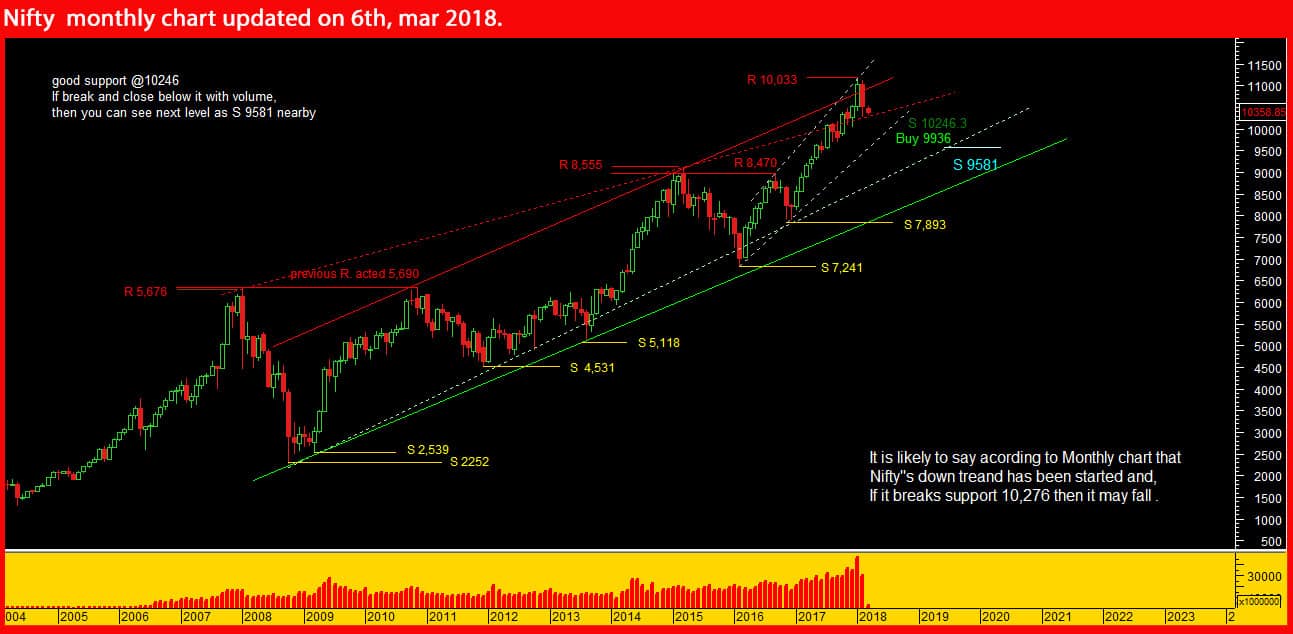
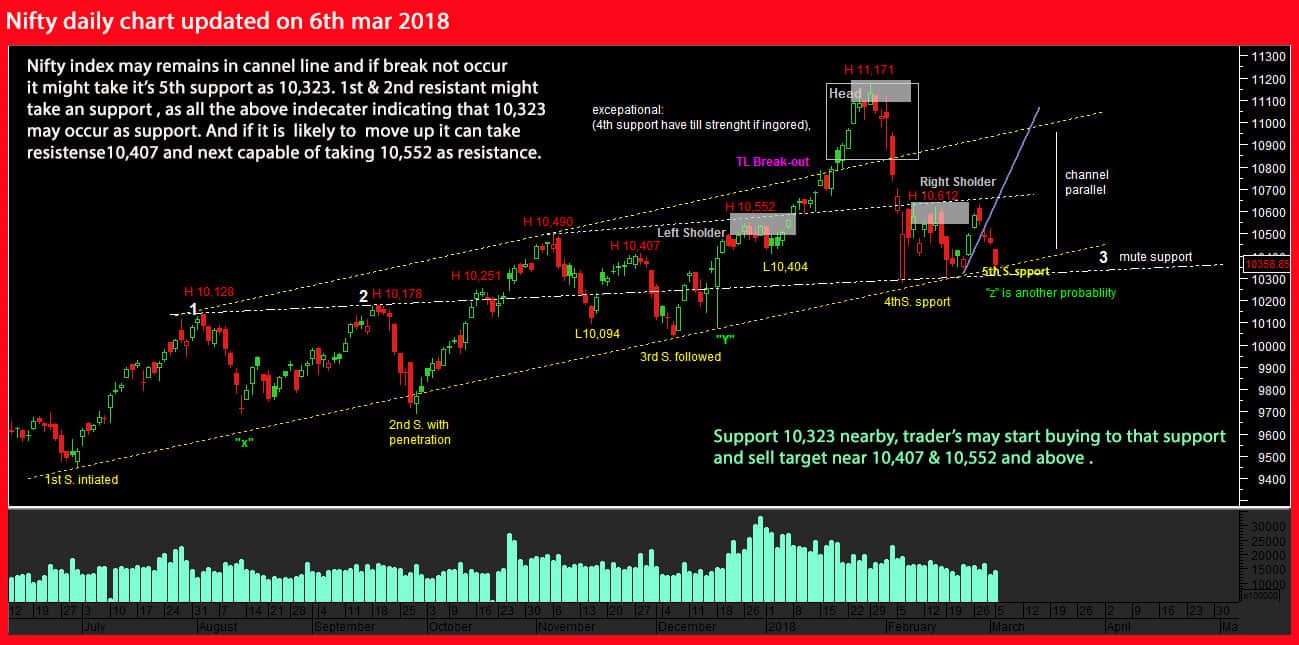
The nifty will  set up a shallow up-trend channel over the in coming  few sessions. The nifty has fall down as 10276, as it was relatively weaker than the last few session stock market again, and now it says that it may take support as 10276 and nearby that it will go up and resistance may take as 10,552.

 The Nearest important level of resistance of the Nifty50  index is at around 10631, marked by previous consolidation. The next resistance level may  remain at 10,552, marked by short-term local highs. On the other hand, support level remains at 10323 is near, marked by local low. “If the market continues lower, the potential level of support would be at 10323, marked by previous short-term consolidation”. So in traders mind it  may advise buying at 10323or near to that support  and go for the target 10,552 and more high.

To become a subscriber, subscribe to our free newsletter services. Our service is free for all.
nifty-daily-chart
Continue reading

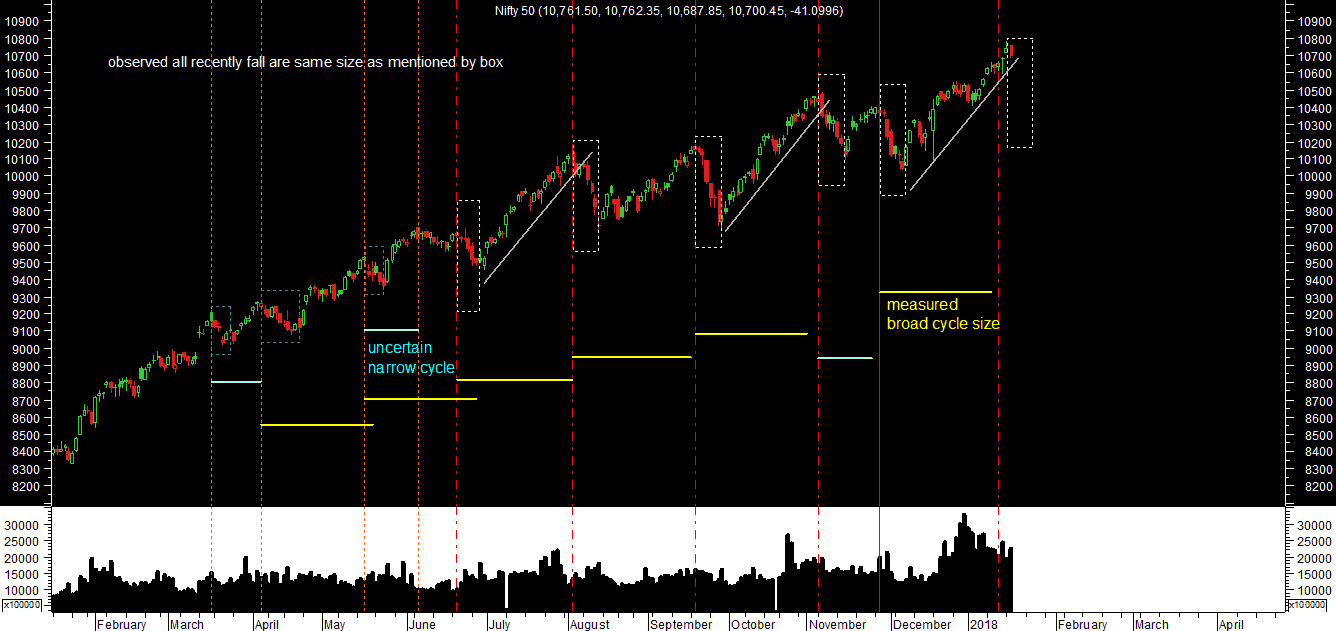
Sellers have high probability on nifty index as per technical indications

Sellers have high probability on nifty index as per technical indications, therefore PUT of nifty jan. 2018 can buy 21-25 for targets 37 to 41 and after possibility for positional targets as 66-79 in 3-5 tradings days.

nifty-cycle-analysis

concluded by cycle analysis, it may come 180-300 points fall nifty in period short of time. In the above chart, “measured broad cycle size” is showing that it can fall and also observed all recently fall are same size as mentioned by box. Fall is not far so, be careful if you’re in long side.

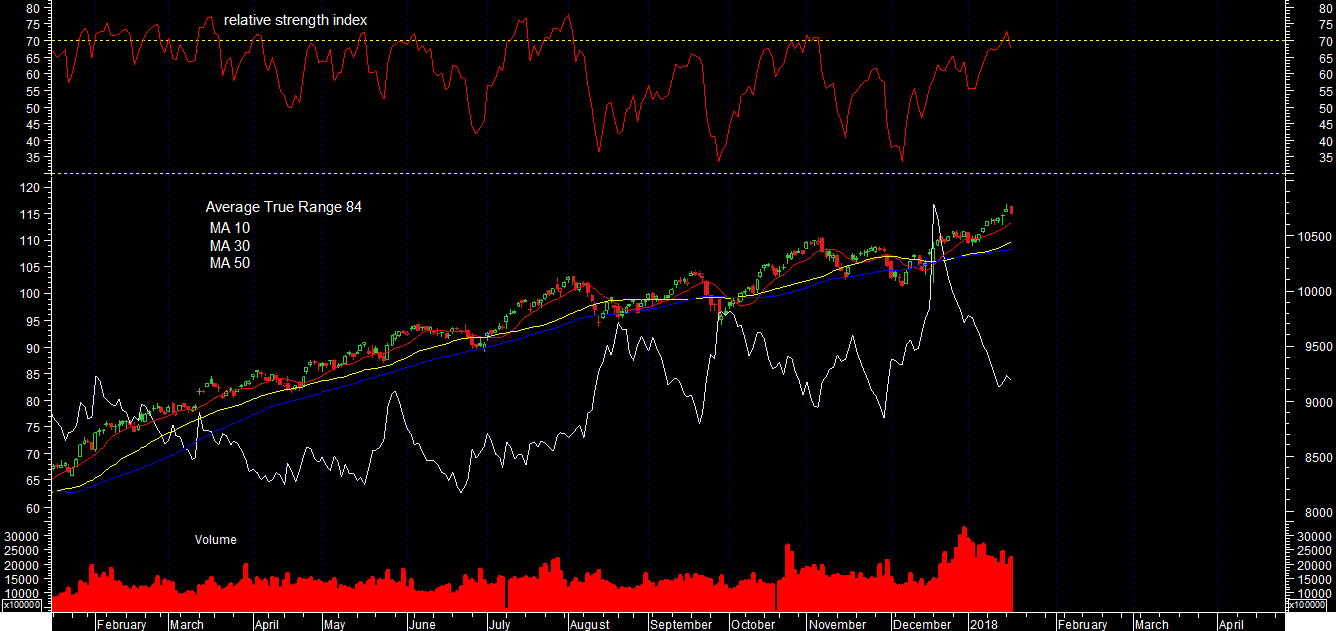
  • All below “Moving Averages” are positive but ATR (average true value have strong support which can indicated big move on a day) ATR is at 84 points and today low is 10665 and high is 10754. The result of ATR tells us intraday bulls are over at, 10765.

MA 10
MA 30
MA 50

  • RSI (relative strength index) is representing at overbought.
  • World markets are negative

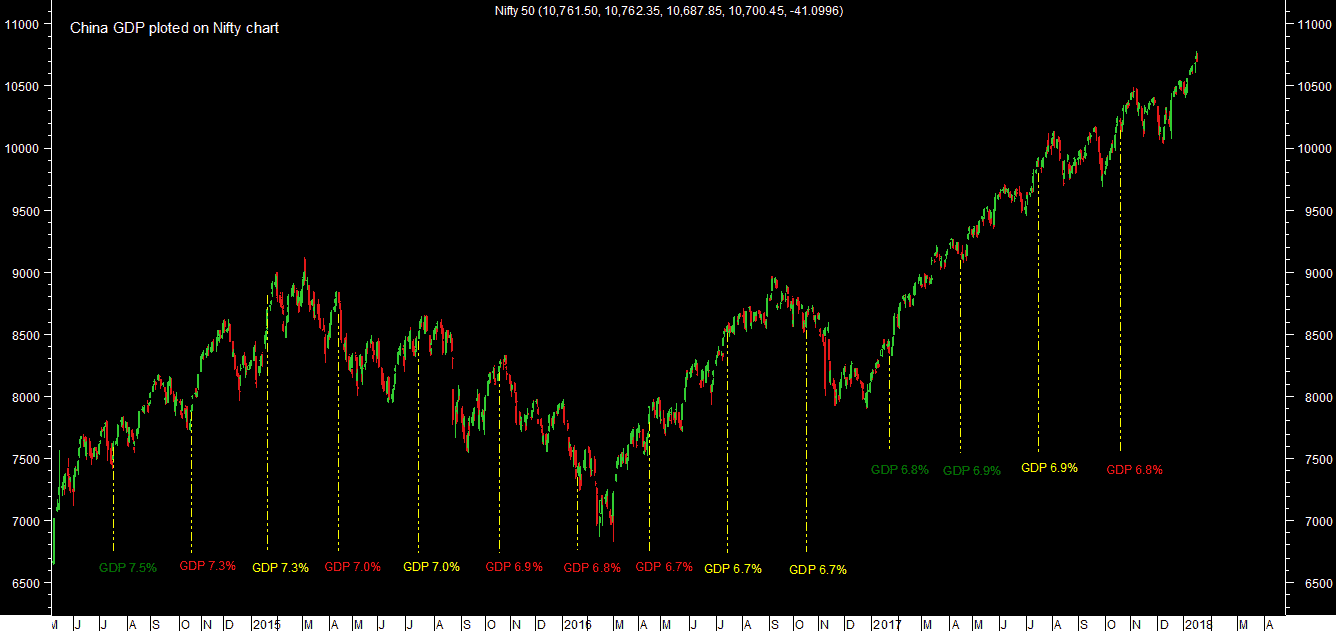
On 18th January 2018, China will declare quarterly GDP which historical GDP of china plotted on nifty for understanding affect of it.

To become a subscriber, subscribe to our free newsletter services. Our service is free for all.
Continue reading

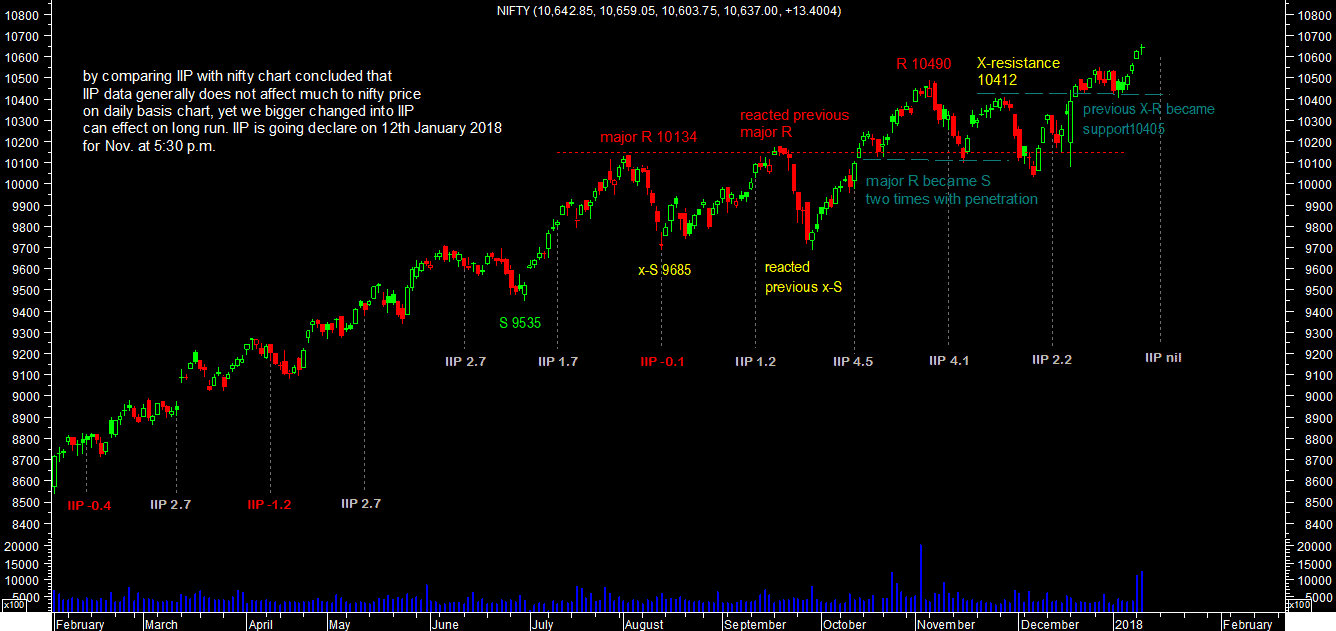
comparison of IIP data with nifty and will declare on 12th Janunary 2018

IIP (Index of industrial production) data for November month and CPI data for December month are going to declare on 12th Jan. 2018 at 5:30 PM which are generally minor affect to index nifty for short term period. Therefore, we have created chart of IIP data with nifty future here will useful for traders.

nifty-chart-with-iip

Data for 01/09/2018

Exp TrendN/A
NIFTY
Open10,642.85
High10,659.05
Low10,603.75
Close10,637.00
Volume1,267,682
Open Int.0
Price Chg.13.40
Vol1,267,682

IIP and CPI data are declare on Friday then result of it will be on Monday. If there’re not good news or unable to support globe atmosphere will lead to fall in market.

IIP data source from.

Continue reading

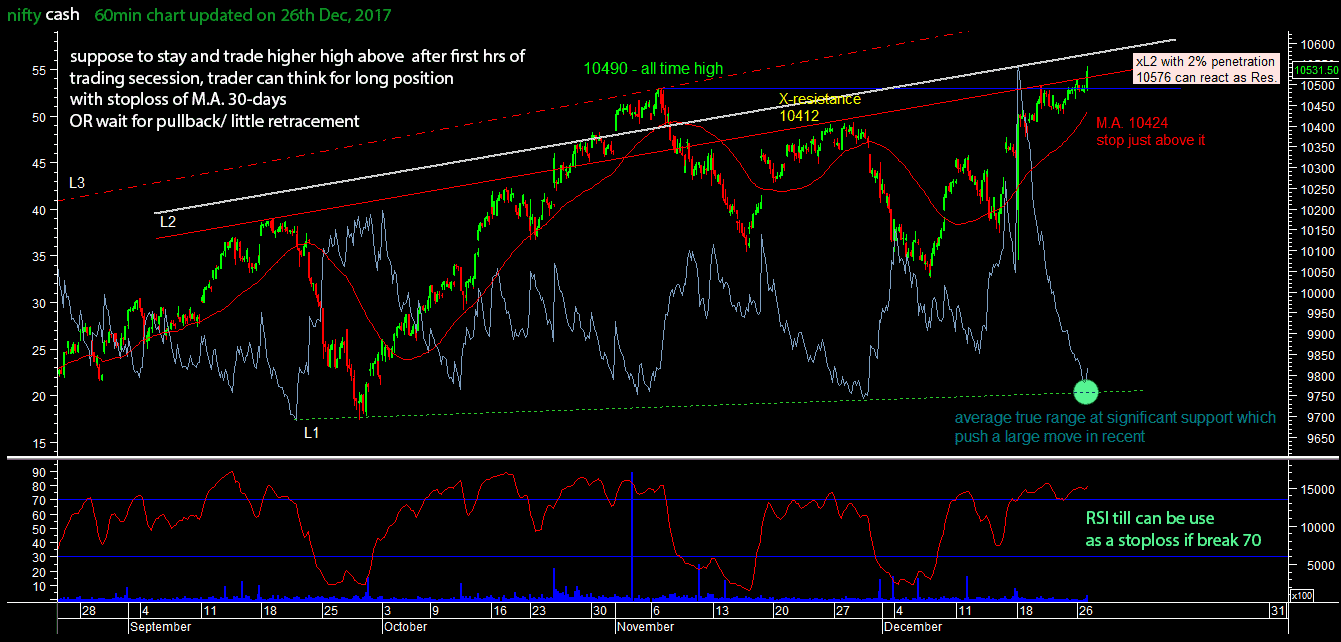
We have updated overview of nifty

nifty-60-min-chart

NOTE: above chart level are for Nifty Cash market. All levels are use after 1hrs of trading secession.

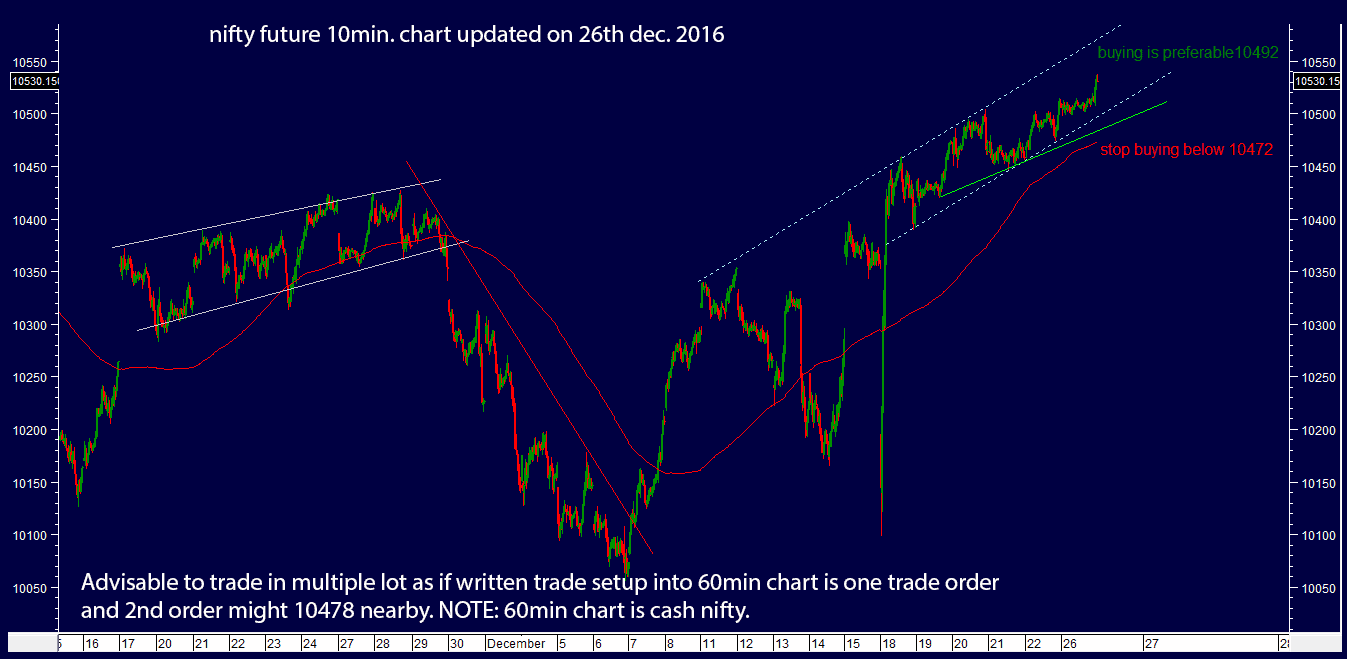
10min-chart

Multiple trade is good, but we will update live more about it.

To become a subscriber, subscribe to our free newsletter services. Our service is free for all.
Continue reading