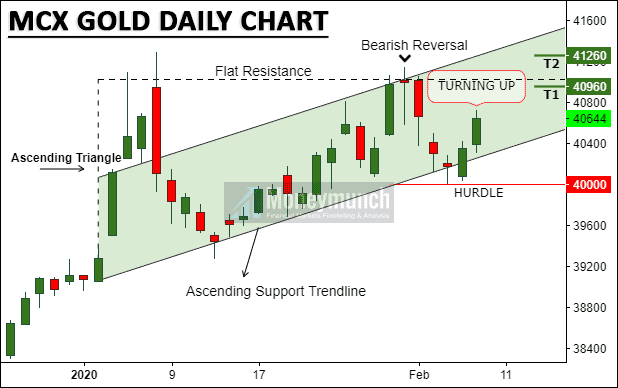
MCX Gold Looking Upside But Is It?
If gold breakdown a flat resistance line, it will fly in the sky. Gold will pressurize by speculators up to 41400 – 41600 – 42000 levels.
Remember, it could happen by a complete breakout of a flat resistance line only.
Hurdle or ascending support trendline breakout indicates to stop buying. It will fall the prices up to 39560 – 39260 level.
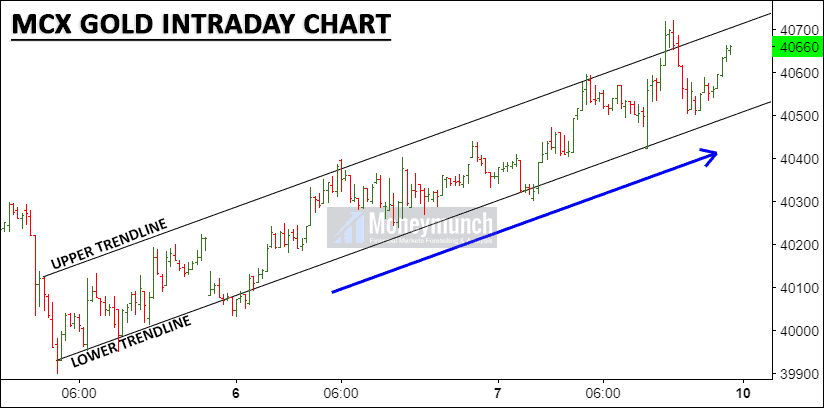
For trend identification, check this 15 minutes intraday chart of gold. Keep eyes on a lower trendline before initiating a position. Further information will update soon for the subscribers only. To become a subscriber, subscribe to our free newsletter services. Our service is free for all.
Here’s the One Silver Chart to Watch
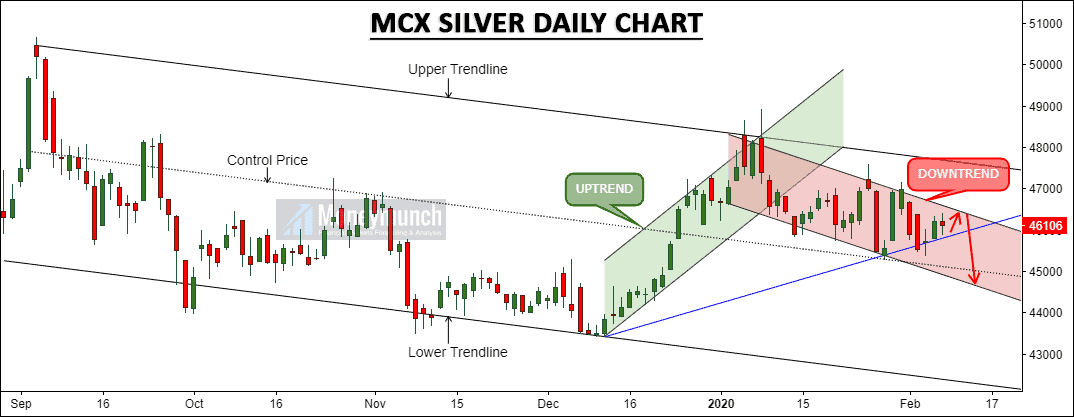
Gold can influence the silver price upside up to the upper trendline. As per the technical analysis, currently, it’s under downtrend. As described in the above chart, It may keep falling for 45600 – 45000 levels.
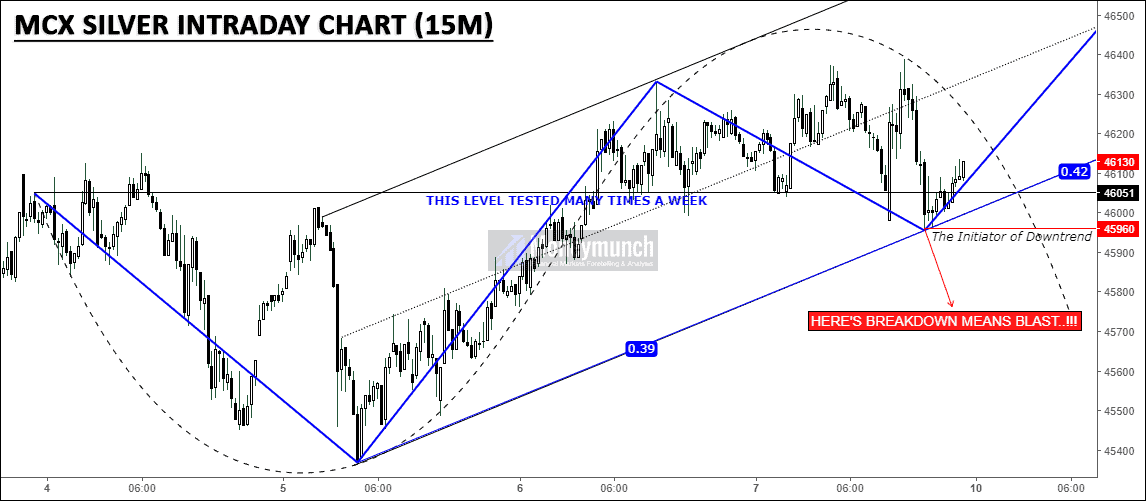
Look at the many times tested level, this can drag the silver price up to 46400 – 46600+.
Get free MCX ideas, chart setups, and analysis for the upcoming session: Commodity Tips →
Have you any questions/feedback about this article? Please leave your queries in the comment box for answers.
Your tips are just amazing.. slowly learning to interpret correctly… best forward weeks charting..thank u
wah gold is following your direction. nice report
Thanks for your great work. God pay you back for sharing and God bless you too