
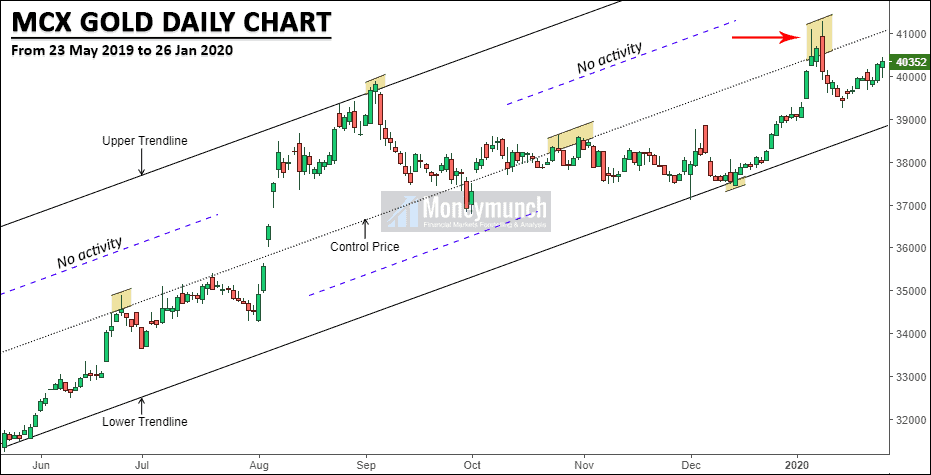
As per the daily chart, gold prices continue moving higher. After a reversal, we can expect the following levels ahead: 40800 – 41000 – 41360+
Why reversal? Look at the below 15-minutes chart of gold:
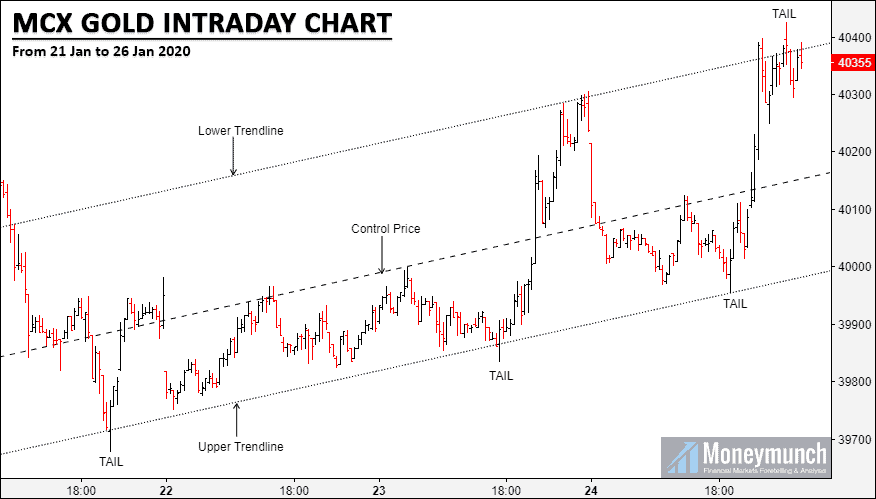
As per this chart, gold can easily fall for 40160 – 40000 levels. It’s the same technical chart I had updated in the previous newsletter. And it has also touched all intraday targets.
Read it here, Next Move of MCX Gold.
As per the intraday chart, day traders should keep buying the gold for 40600 – 40800 until it breaks the upper trendline. And the breakout of the upper trendline will explode prices. It could be up to 39760 – 39500 below levels.
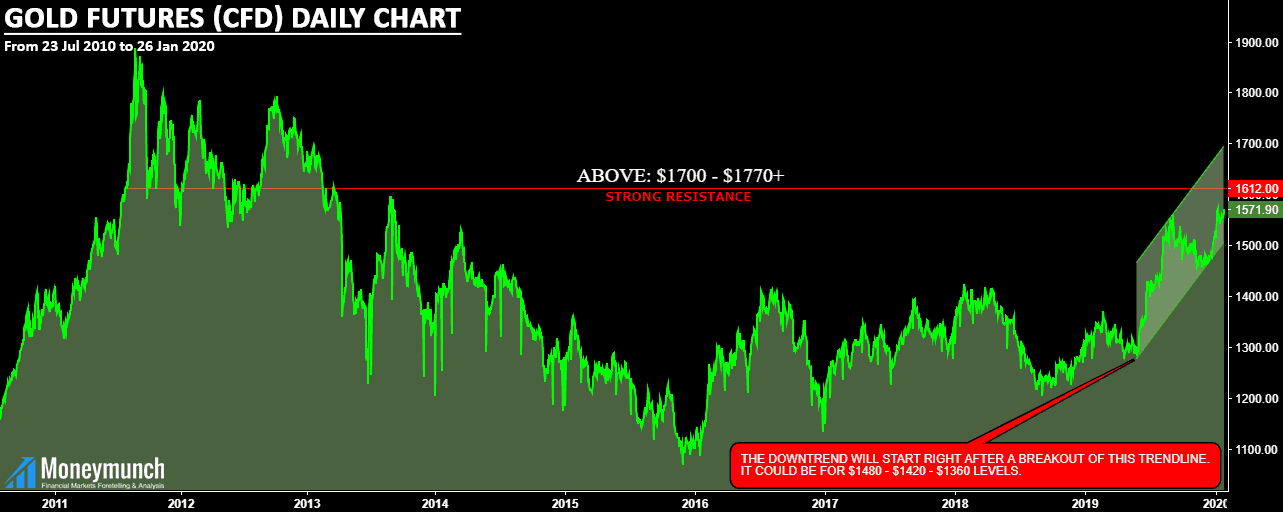
Similarly, my view is the same for the gold futures (CFD). Look out the below chart, it will explain to you better.
To become a subscriber, subscribe to our free newsletter services. Our service is free for all.
Get free MCX ideas, chart setups, and analysis for the upcoming session: Commodity Tips →
Have you any questions/feedback about this article? Please leave your queries in the comment box for answers.
very accurate call. it’s a perfect gold research report. Hats off sir
sir i have demanded to pay monthly charges pls allow me to pay now i have mailed