Publish Date: 26/08/2021
UPDATE 2.0
3-Tricks : Where to start Elliott Wave counting on the chart?
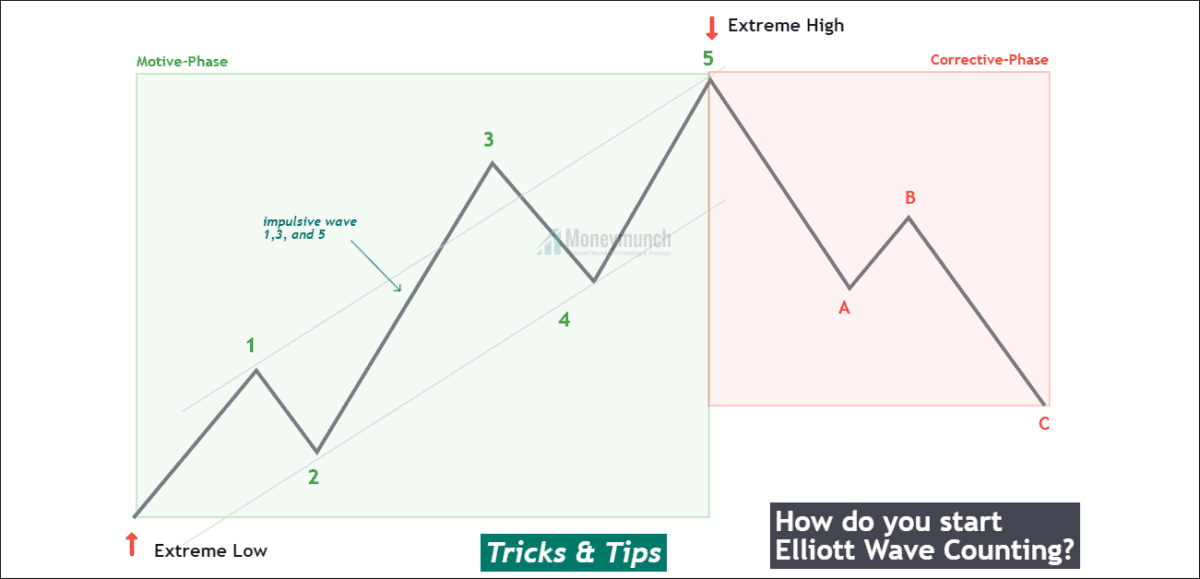
We get a lot of questions about Elliott Wave, but a set of questions often received from the followers:
- Where to start wave counting on the chart?
- How do I begin/start wave counting on the chart?
- How do you do Wave Counting?
Part 1: Which Strike Prices Are The Most Money-Making?
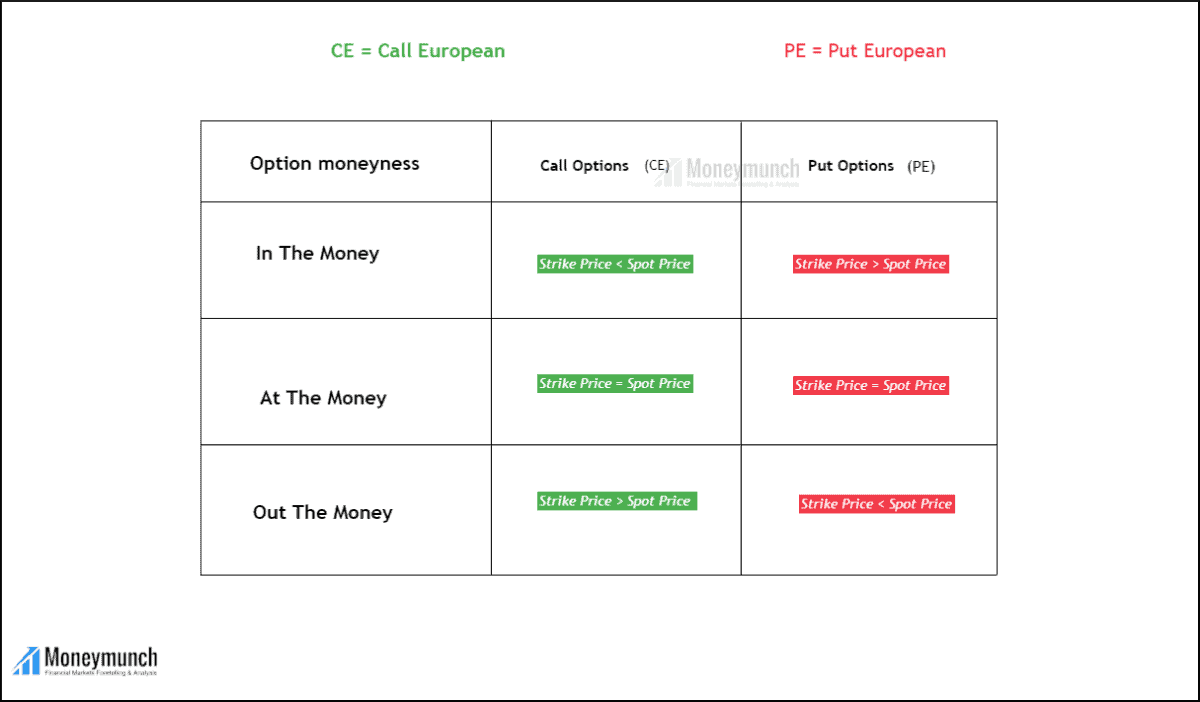 Figure 1.1
There is tremendous importance in options trading when it comes to strike prices. Traders can reduce the pain of option decay by choosing the right strike price. In terms of money, there are three kinds of strike prices. 1) ATM – At the Money 2) OTM – Out of the Money 3) ITM – In the MoneyContinue reading
Part 1: How to Count Waves Using Chart Patterns?
We can count waves using traditional patterns like Head and shoulders , Double Top and Bottom,
Triangle, cup & handle, etc. This article is about how you can count waves by identifying chart patterns.
I have covered Three chart patterns in this article,
1) Triangles
2) Head and shoulders
3) Double Top and Bottom
1) Head and shoulders :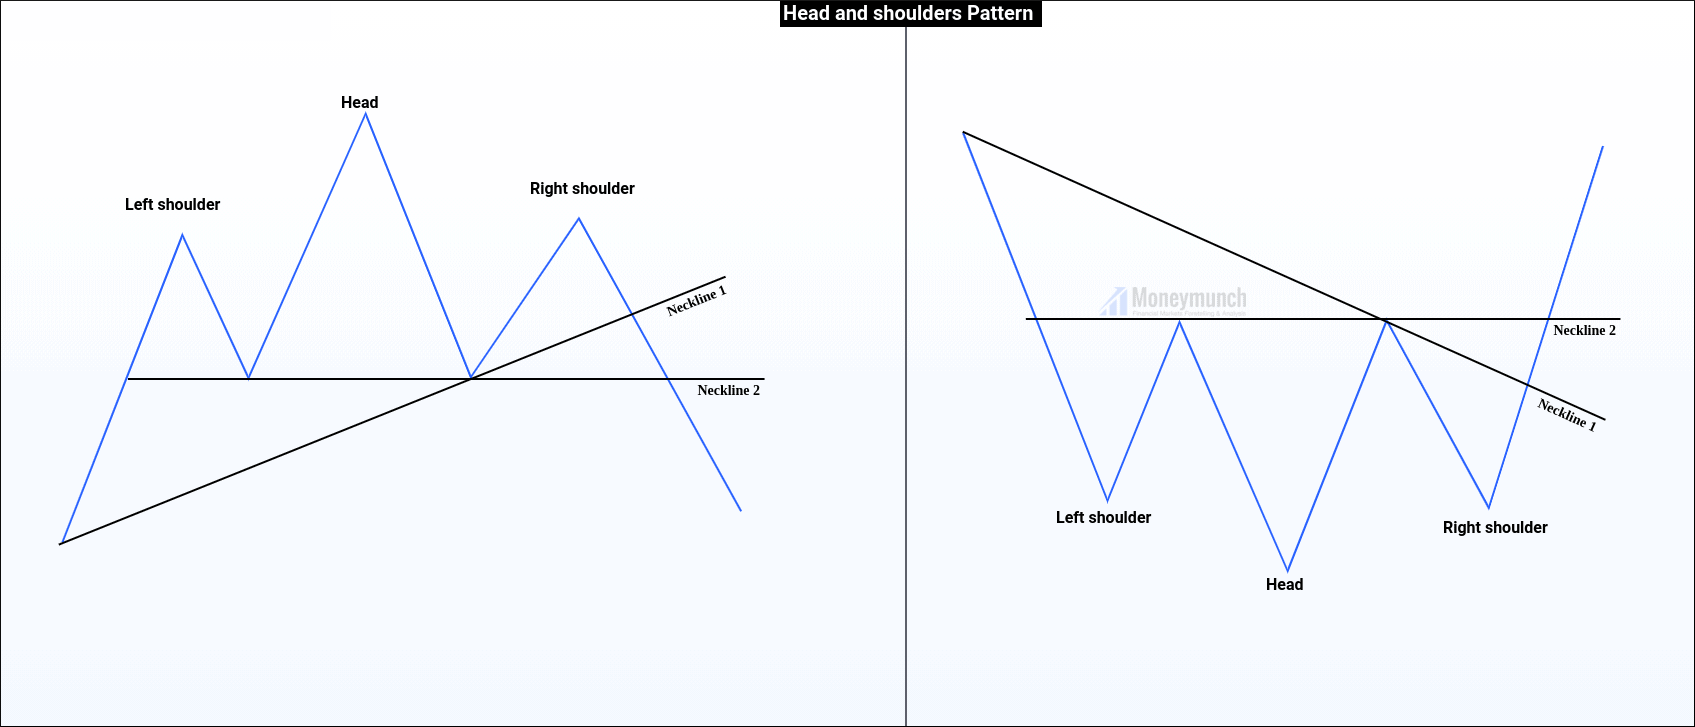
Part 1: A simple analysis of Wyckoff of Wall Street
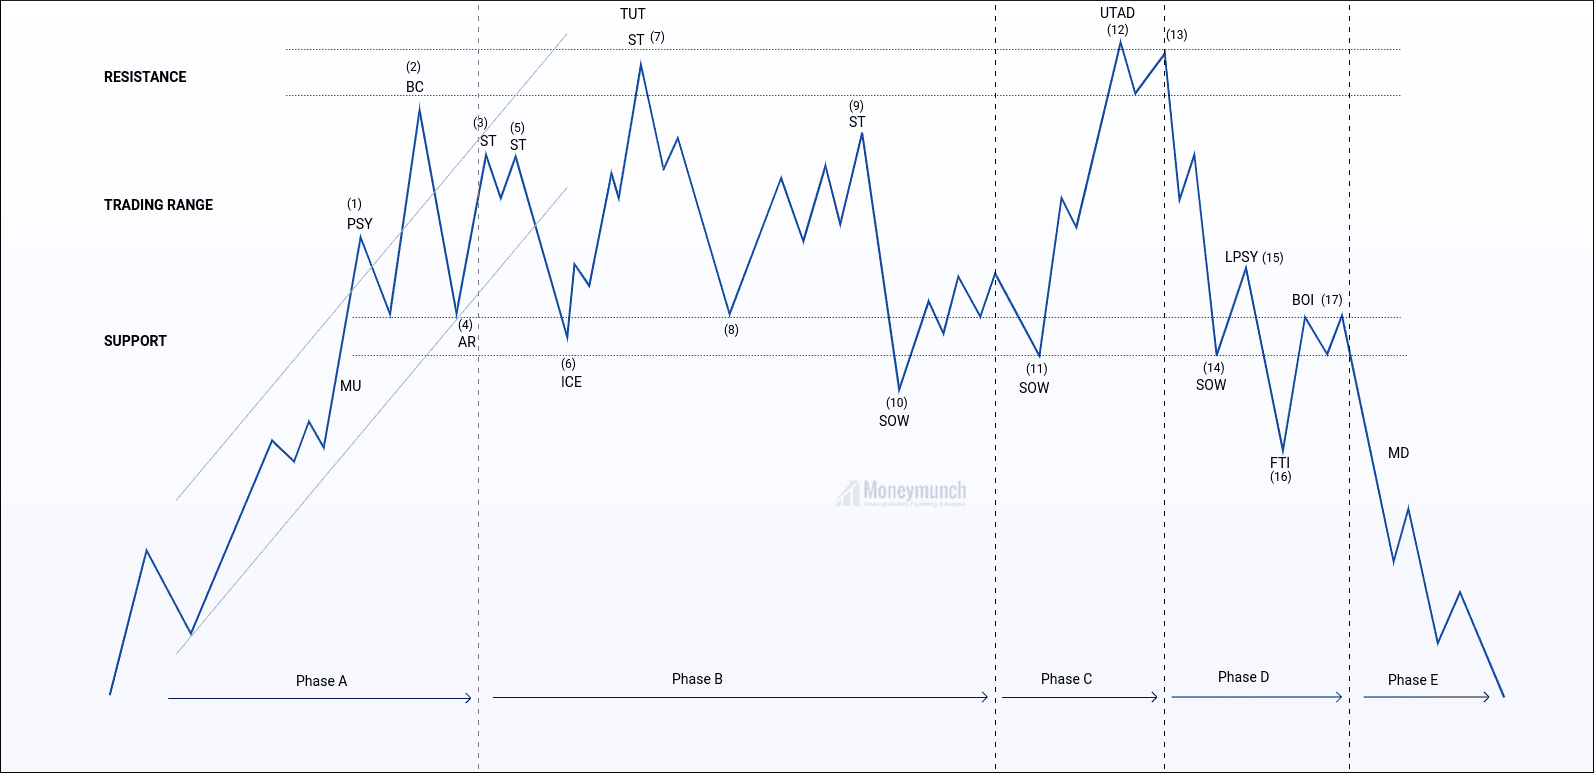
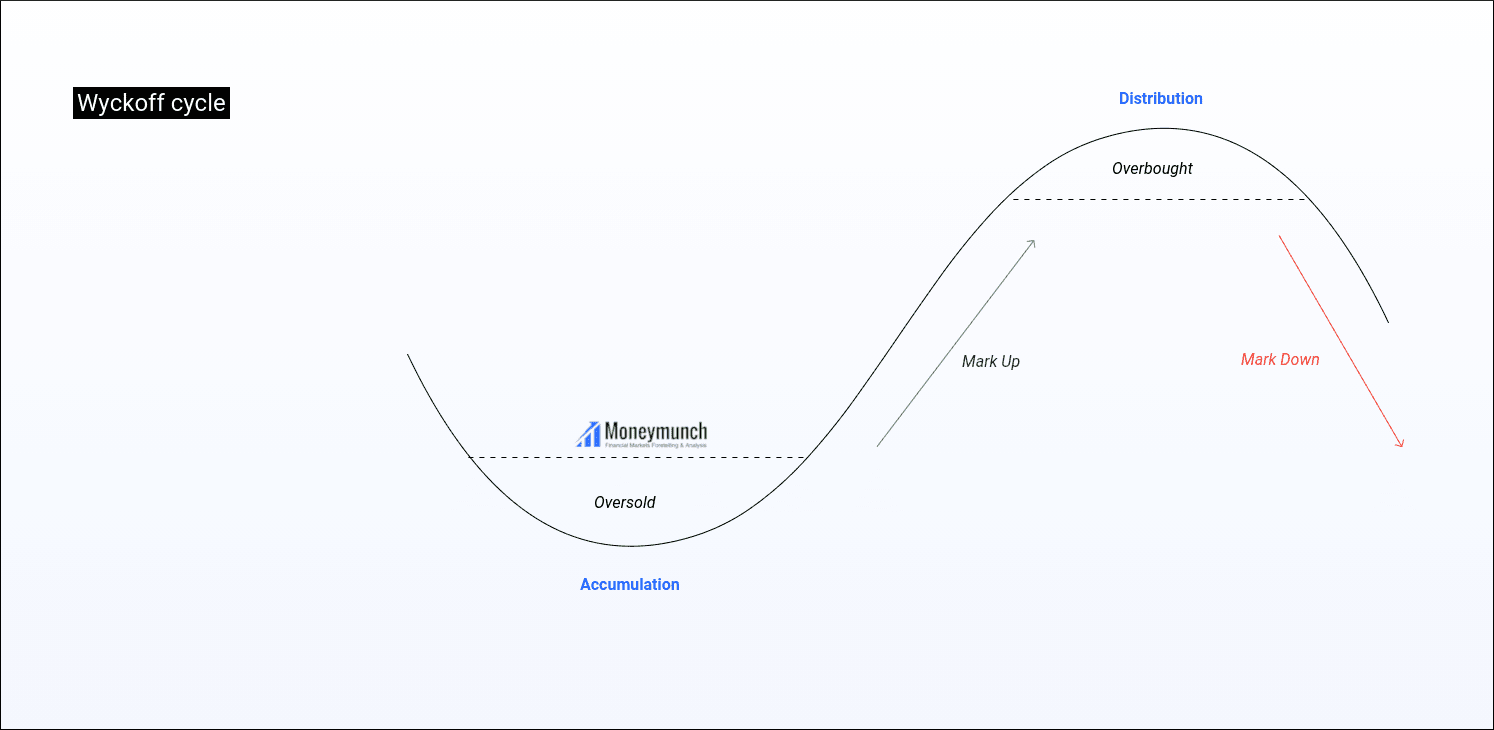
Wyckoff was a pioneer in the technical analysis of the stock market in the early 20th century. He established the Stock Market Academy in 1930. The main course is to introduce how to identify the dealer’s process of collecting chips and the process of distributing chips/judge. Second and third, in the basic law of “causality”, the horizontal P&F count within the trading range represents the cause, and the subsequent price changes represent the result.
Fourth, fifth, the relationship between price and volume on the candlestick chart to analyze the relationship between supply and demand. This law sounds simple, but it takes a long time to practice in order to accurately grasp the volume and price. I heard that Wall Street financial institutions are using Wyckoff’s trading method to judge the trend of the stock market and look for opportunities. So what exactly is Wyckoff’s theory? Today, I will introduce to you the famous Wyckoff transaction method.
The background of the birth of Wyckoff theory
Wyckoff’s theory was proposed by Richard Wyckoff. He was a pioneer in the technical analysis of the stock market in the early 20th century. He and Dow Jones, Gunn, Elliott, and Merrill Lynch are considered the five giants of technical analysis.
Wyckoff is good at summarizing his years of failures in stock investment, and is committed to introducing individual investors to the rules of the game in the market and the impact of large funds behind them.
In 1930, he established the Stock Market Academy. The main course is to introduce how to identify the dealer’s process of collecting chips and the process of distributing chips. Till, there are still many professional traders and institutional investors applying Wyckoff’s method.
Two Five Steps of Wyckoff Analysis
(1) Determine the current state of the market and possible future trends.
Judging the current market trends and future trends can help us decide whether to enter the market and go long or short.
(2) Choose stocks that are consistent with market trends.
In an uptrend, choose stocks that are trending stronger than the market. In a downtrend, choose stocks that are weaker than the market.
(3) Choose stocks whose “reason” equals or exceeds your minimum target.
An important part of Wyckoff’s trading selection and management is his unique method of using long-term and short-term trading point forecasts to determine price targets.
In Wyckoff’s basic law of “causality”, the horizontal P&F count within the trading range represents the cause, and subsequent price changes represent the result.
(4) Make sure that the stock is ready to move.
(5) When the stock market index reverses, there must be contingency measures
Three-quarters of the stocks are moving in line with the market. Grasping the market trends can increase the success rate of transactions.
Continue reading
Contribution of Emotion in Investing
EMOTIONS ARE YOUR WORST ENEMY IN THE STOCK MARKET
 Emotion plays an important role in many aspects of life. Most of the decision we take depend on our emotional quotient, either directly or indirectly. It is no different in investing. Though it is impossible to keep emotion out of the equation, it is imperative to keep it under control. In fact, the success rate of our buying/selling decision in stock market depends unswervingly on this factor. There are two extremes, between which decision-making swings like a pendulum. Most of us react to these extremes. We are either too excited to calculate the risk involved in buying a particular stock or too depressed to identify the intrinsic value of a stock when it is down. It is always important to take a balanced and an informed decision. Striking the balance is an art. It needs to be practiced over time. There are scores of channels, magazines and hundreds of analysts who often occupy our mind and ride us through different sectors and stocks. It is this ride which takes us to the extremes.
Seldom do we think about who gives them ideas? How much do they make out of their own recommendations? What are their intentions?Continue reading