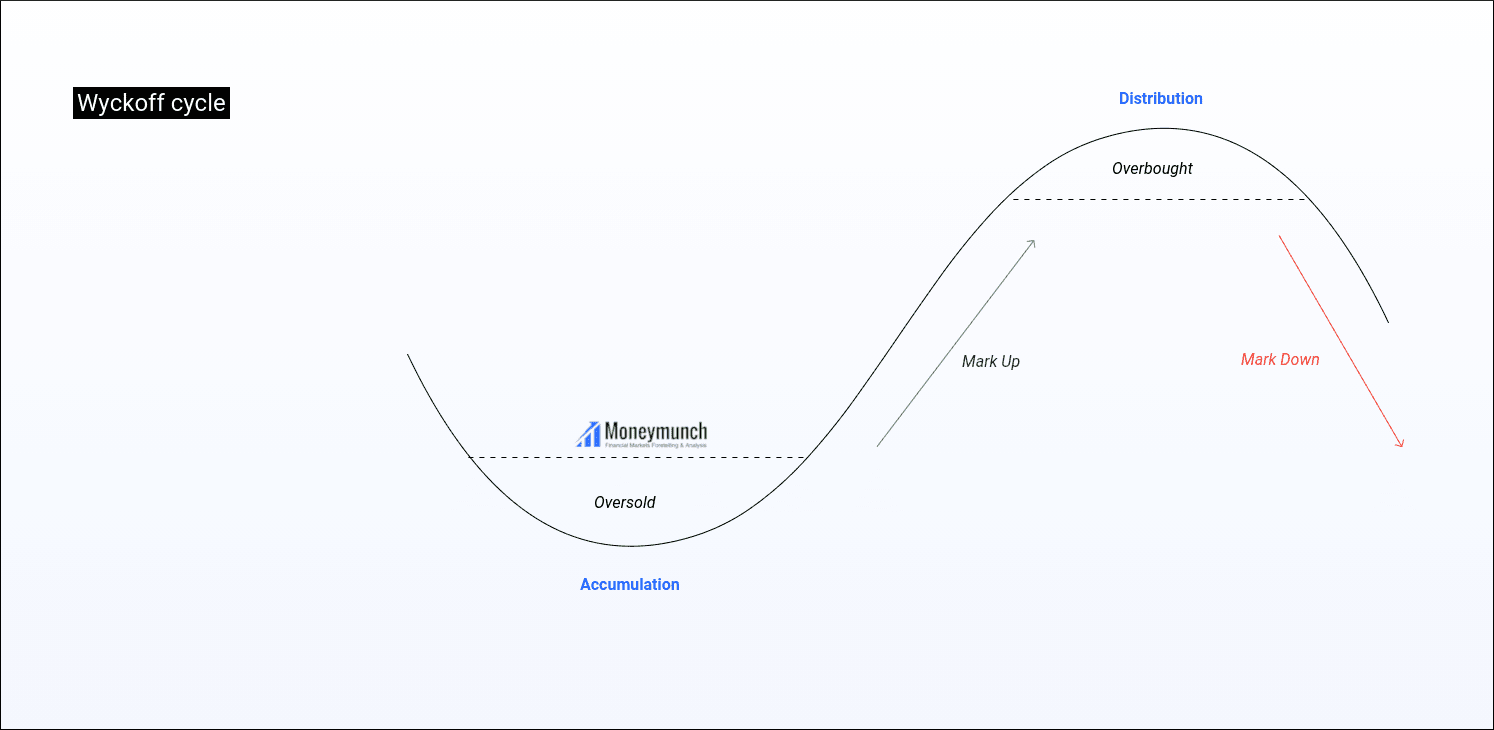
Wyckoff was a pioneer in the technical analysis of the stock market in the early 20th century. He established the Stock Market Academy in 1930. The main course is to introduce how to identify the dealer’s process of collecting chips and the process of distributing chips/judge. Second and third, in the basic law of “causality”, the horizontal P&F count within the trading range represents the cause, and the subsequent price changes represent the result.
Fourth, fifth, the relationship between price and volume on the candlestick chart to analyze the relationship between supply and demand. This law sounds simple, but it takes a long time to practice in order to accurately grasp the volume and price. I heard that Wall Street financial institutions are using Wyckoff’s trading method to judge the trend of the stock market and look for opportunities. So what exactly is Wyckoff’s theory? Today, I will introduce to you the famous Wyckoff transaction method.
The background of the birth of Wyckoff theory
Wyckoff’s theory was proposed by Richard Wyckoff. He was a pioneer in the technical analysis of the stock market in the early 20th century. He and Dow Jones, Gunn, Elliott, and Merrill Lynch are considered the five giants of technical analysis.
Wyckoff is good at summarizing his years of failures in stock investment, and is committed to introducing individual investors to the rules of the game in the market and the impact of large funds behind them.
In 1930, he established the Stock Market Academy. The main course is to introduce how to identify the dealer’s process of collecting chips and the process of distributing chips. Till, there are still many professional traders and institutional investors applying Wyckoff’s method.
Two Five Steps of Wyckoff Analysis
(1) Determine the current state of the market and possible future trends.
Judging the current market trends and future trends can help us decide whether to enter the market and go long or short.
(2) Choose stocks that are consistent with market trends.
In an uptrend, choose stocks that are trending stronger than the market. In a downtrend, choose stocks that are weaker than the market.
(3) Choose stocks whose “reason” equals or exceeds your minimum target.
An important part of Wyckoff’s trading selection and management is his unique method of using long-term and short-term trading point forecasts to determine price targets.
In Wyckoff’s basic law of “causality”, the horizontal P&F count within the trading range represents the cause, and subsequent price changes represent the result.
(4) Make sure that the stock is ready to move.
(5) When the stock market index reverses, there must be contingency measures
Three-quarters of the stocks are moving in line with the market. Grasping the market trends can increase the success rate of transactions.
Wyckoff believes that through detailed supply and demand analysis, including research on price behavior, volume , and time. The market can be understood and predicted.
Wyckoff’s 3-Laws
Wyckoff’s icon analysis method is based on three laws, which affect all aspects of stock analysis.
For example, the forecast of the market and individual stocks, how to select stocks, and the appropriate points to enter the market.
1. The principle of supply and demand determines the direction of the price.
When supply is less than demand, prices will rise; when supply exceeds demand, prices will fall.
Traders can analyze the relationship between supply and demand through the relationship between price and volume on the K-line chart.
This law sounds simple, but it takes a long time to practice to accurately grasp the relationship between volume and price.
2. The principle of causality can explain the magnitude of future price rises and falls.
Causality can help investors predict target prices. Calculate the size of the future market by calculating the chips in the sideways interval.
You can use a point and figure chart to analyze the cause and predict the result.
The “cause” is the number of points in the horizontal interval in the point and figure chart, and the “effect” is the ups and downs of the stock price caused by these points.
3. The principle of inconsistent volume and price can provide an early warning of trend changes.
Inconsistency between volume and stock prices is often a signal of a change in trend. For example, in the case of continuous heavy volume , the increase in stock prices is getting smaller and smaller.
This phenomenon shows that the dealer is shipping.
Application of Wyckoff Transaction Law
Let’s use the dollar index to explain some of Wyckoff’s concepts.
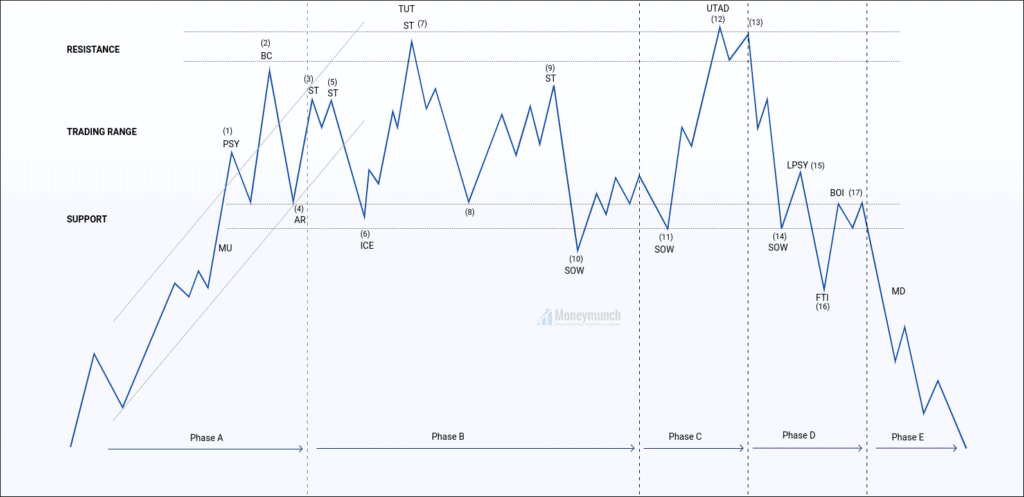
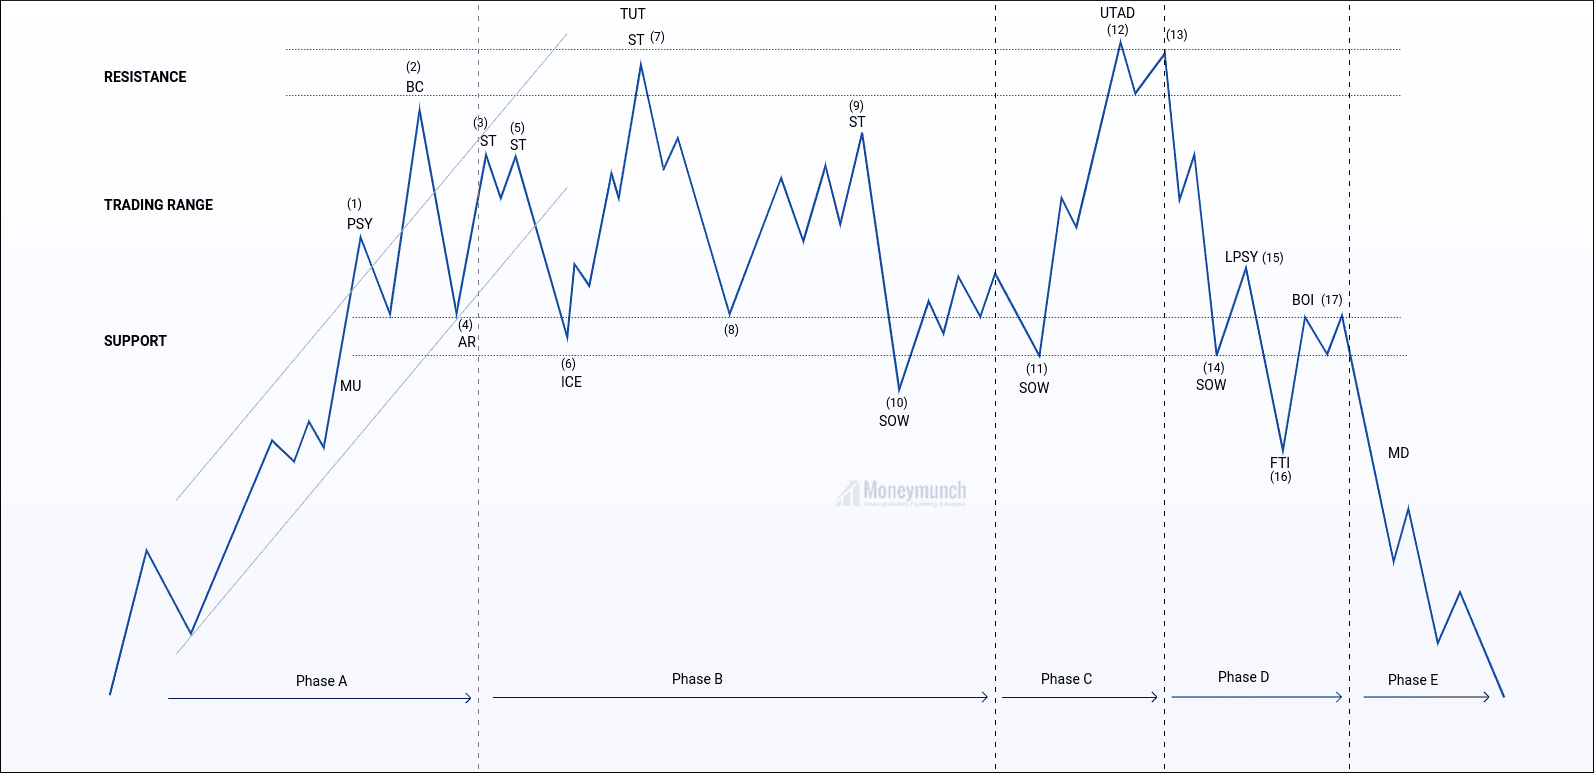
The long-term bear market after its peak in 2001 ended in 2009. The fall method without resistance from 2001 to 2005 has proved to be an oversold market, and then the rebound in 2005 was relatively large, which we call the market-to-sales ratio (PS), and the subsequent fall speed tells us that the trigeminal indicator ( SC) occurred NS.
Looking at the increase in AR, the loss of SC is almost flattened, and the resistance of the supply line is completely negated, which shows that demand has absorbed the selling in the supply area.
Wyckoff believes that the popularity indicator (AR) is the beginning of the true volatility (TR). Whether this TR is distributed or demanded depends on subsequent development. During the development of TR, CM’s methods began to show. From their behavioral characteristics, it can be seen that this TR is a collection and distribution.
Of course, after knowing the accumulation or distribution, you also know whether the market outlook is entering a bull market or continuing a bear market.
In 2009 and 2011, the position of the ST tells us that the demand is greater than the supply. Otherwise, the demand generated on the SC will be absorbed by the large supply, causing the bear market to continue.
Based on these characteristics, we judged that the accumulation may be greater than the distribution. Because if it is a distribution, the supply is still surplus, then any demand accumulated by the rebound will not help, and the price can only continue to look for greater demand.
In conclusion:
For the Wyckoff transaction law, many professional traders are using it, but the retail public is still not widely used.
The completeness, systematizes, and logic of Wyckoff’s method, as well as the ability to find high-probability and high-yield transactions, make his stock selection method and investment strategy stand the test of time.
Wyckoff’s training methods enable investors to make sensible, fact-based trading decisions without being disturbed by emotions.
Using the Wyckoff method, traders can put funds on the side of the smart money that is the main force in the market.
As the content of Wyckoff transaction law is more, more knowledge about Wyckoff transaction law, I will write another article to introduce to you.
Get free important share market ideas on stocks & nifty tips chart setups, analysis for the upcoming session, and more by joining the below link: Stock Tips
Have you any questions/feedback about this article? Please leave your queries in the comment box for answers.
Amazing explanation! Cheers!
Your services are amazing.
How can I get your paid calls?
Visit the following link to know more about pricing plans: https://moneymunch.com/our-service/