This is the 36th Day course in a series of 60-Days called “Technical Analysis Training”
You will get daily one series of this Training after 8 o’clock night (Dinner Finished)
Follow MoneyMunch.com Technical Analysis Directory and Learn Basic Education of Technical Analysis on the Indian Stock Market (NSE/BSE)

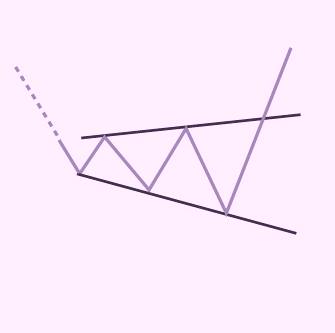
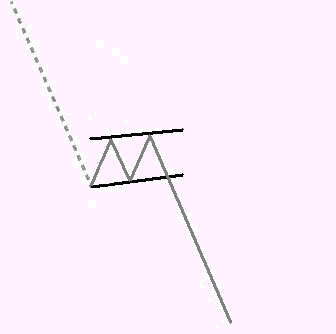
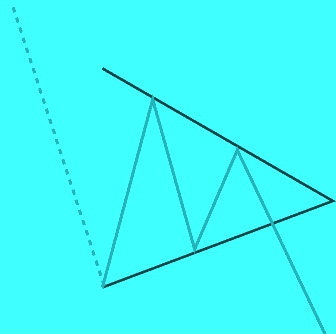
Symmetrical Continuation Triangle (Bearish)
Implication
A Symmetrical Continuation Triangle (Bearish) is considered a bearish signal, indicating that the current downtrend may continue.
Description
A Symmetrical Continuation Triangle (Bearish) shows two converging trend lines, the lower one is ascending, the upper one is descending. The formation occurs because prices are reaching both lower highs and higher lows. The pattern will display two highs touching the upper (descending) trend line and two lows touching the lower (ascending) trend line.
This pattern is confirmed when the price breaks out of the triangle formation to close below the lower (ascending) trend line.
Volume is an important factor to consider. Typically, volume follows a reliable pattern: volume should diminish as the price swings back and forth between an increasingly narrow range of highs and lows. However, when the breakout occurs, there should be a noticeable increase in volume. If this volume picture is not clear, investors should be cautious about decisions based on this triangle.
Important Characteristics
Following are important characteristics for this pattern.
Occurrence of a Breakout
Technical analysts pay close attention to how long the Triangle takes to develop to its apex. The general rule is that prices should break out – clearly penetrate the lower trend line – somewhere between three-quarters and two-thirds of the horizontal width of the formation. The break out, in other words, should occur well before the pattern reaches the apex of the Triangle. The closer the breakout occurs to the apex the less reliable the formation.
Duration of the Triangle
The Triangle is a relatively short-term pattern. While long-term triangles do form, the most reliable triangles take between one and three months to form.
Volume
Investors should see volume decreasing as the pattern progresses toward the apex of the Triangle. At breakout, however, there should be a noticeable increase in volume.
Trading Considerations
Duration of the Pattern
Consider the duration of the pattern and its relationship to your trading time horizons. The duration of the pattern is considered to be an indicator of the duration of the influence of this pattern. The longer the pattern the longer it will take for the price to reach its target. The shorter the pattern, the sooner the price move. If you are considering a short-term trading opportunity, look for a pattern with a short duration. If you are considering a longer-term trading opportunity, look for a pattern with a longer duration.
Target Price
The target price provides an important indication about the potential price move that this pattern indicates. Consider whether the target price for this pattern is sufficient to provide adequate returns after your costs (such as commissions) have been taken into account. A good rule of thumb is that the target price must indicate a potential return of greater than 5% before a pattern should be considered useful. However you must consider the current price and the volume of shares you intend to trade. Also, check that the target price has not already been achieved.
Inbound Trend
The inbound trend is an important characteristic of the pattern. A shallow inbound trend may indicate a period of consolidation before the price move indicated by the pattern begins. Look for an inbound trend that is longer than the duration of the pattern. A good rule of thumb is that the inbound trend should be at least two times the duration of the pattern.
Confirm the Breakout
To avoid taking an inadvisable position in a stock, some investors advise waiting a few days to determine whether the breakout signals that the price is ready to move. A key sign of a possible false move is low volume. If there’s no pick up in volume around the breakout, investors should be wary. Typically, a good breakout from a Triangle formation will be accompanied by a definite surge in volume.
Criteria that Supports
Support and Resistance
Look for a region of support or resistance around the target price. A region of price consolidation or a strong Support and Resistance Line at or around the target price is a strong indicator that the price will move to that point.
Moving Average
Watch for the 200 day moving average to flatten. When prices cross below the 200 day moving average (usually about two-thirds to three-quarters of the way through the pattern), the pattern is considered more reliable.
Volume
A strong volume spike on the day of the pattern confirmation is a strong indicator in support of the potential for this pattern. The volume spike should be significantly above the average of the volume for the duration of the pattern. In addition, the volume during the duration of the pattern should be declining on average.
Criteria that Refutes
No Volume Spike on Breakout
The lack of a volume spike on the day of the pattern confirmation is an indication that this pattern may not be reliable. In addition, if the volume has remained constant, or was increasing, over the duration of the pattern, then this pattern should be considered less reliable.
Short Inbound Trend
An inbound trend that is significantly shorter than the pattern duration is an indication that this pattern should be considered less reliable.
Underlying Behavior
This pattern is a result of converging trendlines of support and resistance which give this Triangle pattern its distinctive shape. This occurs because the trading action gets tighter and tighter until the market breaks out with great force. Buyers and sellers find themselves in a period where they are not sure where the market is headed. Their uncertainty is marked by their actions of buying and selling sooner, making the range of the price movements increasingly tight. As the range between the peaks and troughs marking the progression of price narrows, the trendlines meet at the “apex,” located at the right of the chart.
The narrowing of the trading action and the decreasing volume of trade reflect the indecision in the market. Finally consensus or decision in the market is reached and this is reflected as the price breaks out of the triangle. A spike in volume on this breakout date reflects stronger consensus that the stock should move in that direction.
Wishing you a wonderful learning experience and the continued desire to grow your knowledge. Education is an essential part of living wisely and the Experiences of life, I hope you make it fun.
Learning how to profit in the Stock Market requires time and unfortunately mistakes which are called losses. Why not be profitable while you are learning?