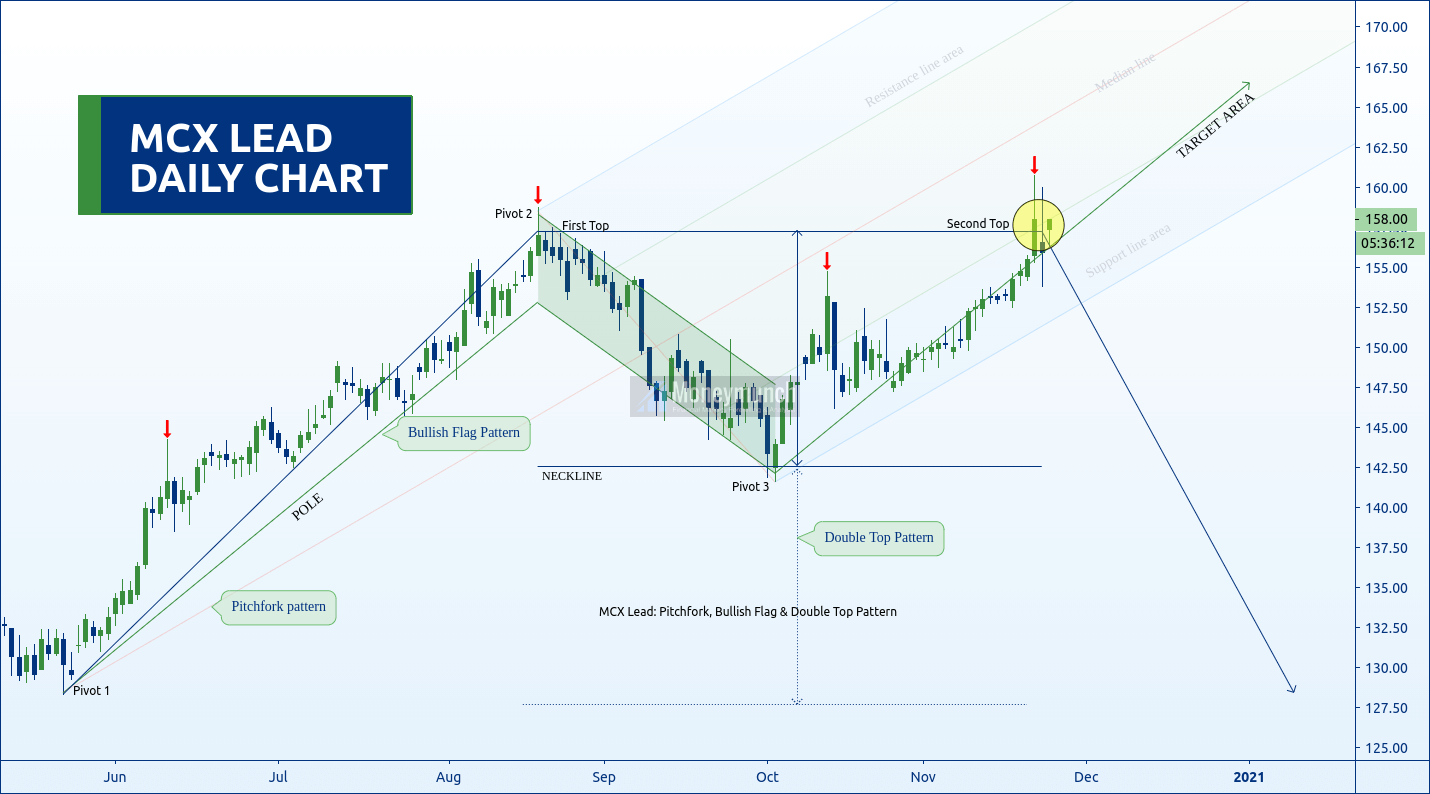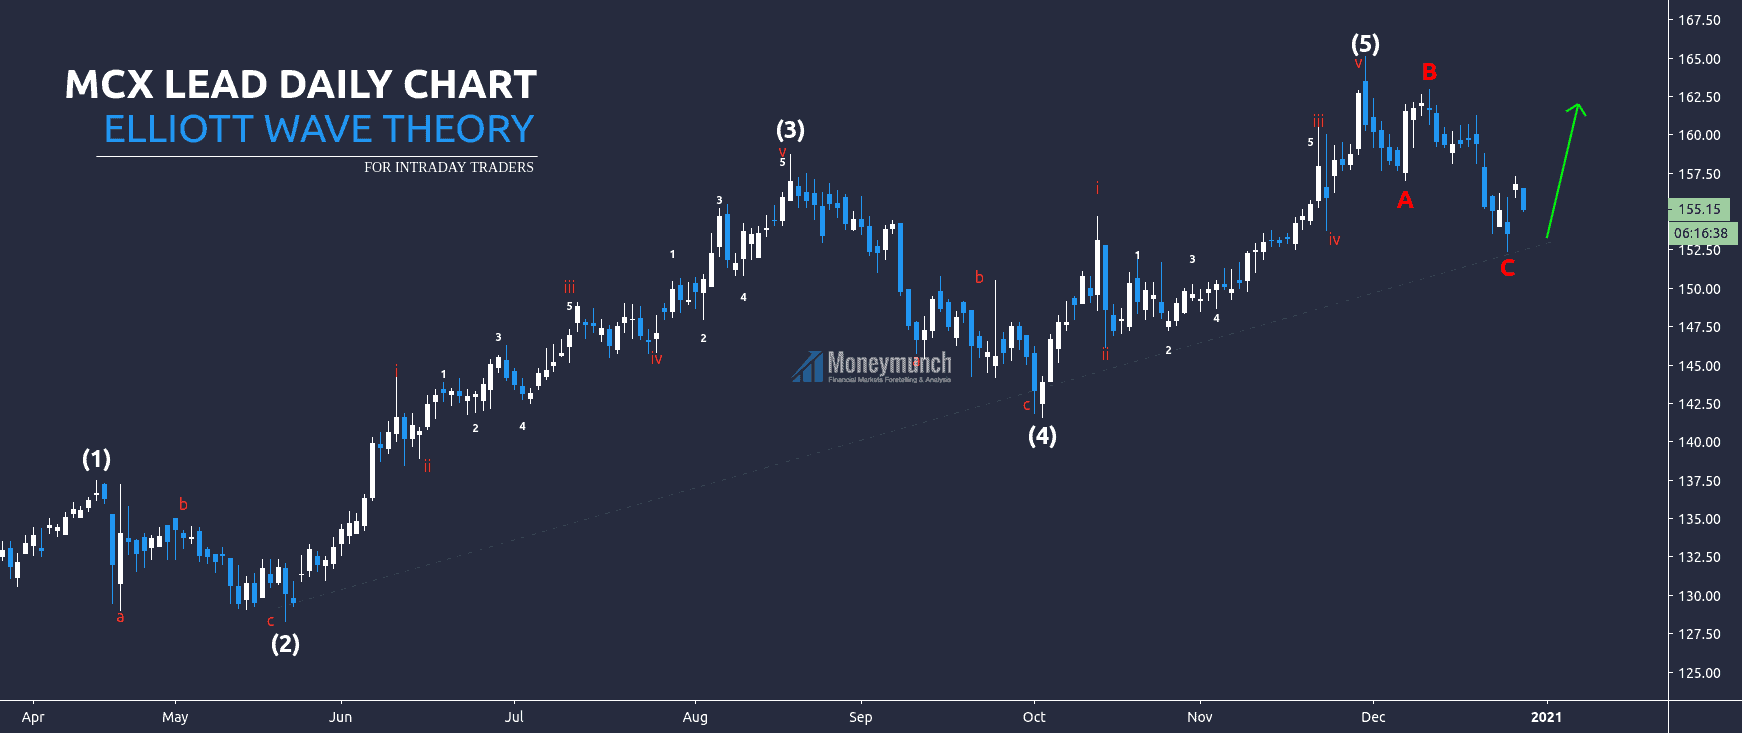
MCX Lead Short-term Cycle Shows Big Trend
It’s the daily chart of the lead. Here, it has made the bullish Elliott pattern, and the ABC correction was completed on the 24th of December 2020. And right now, it started to move upside as per the rules of the bullish Elliott wave pattern. And it will move upwards till 158.6 – 162.
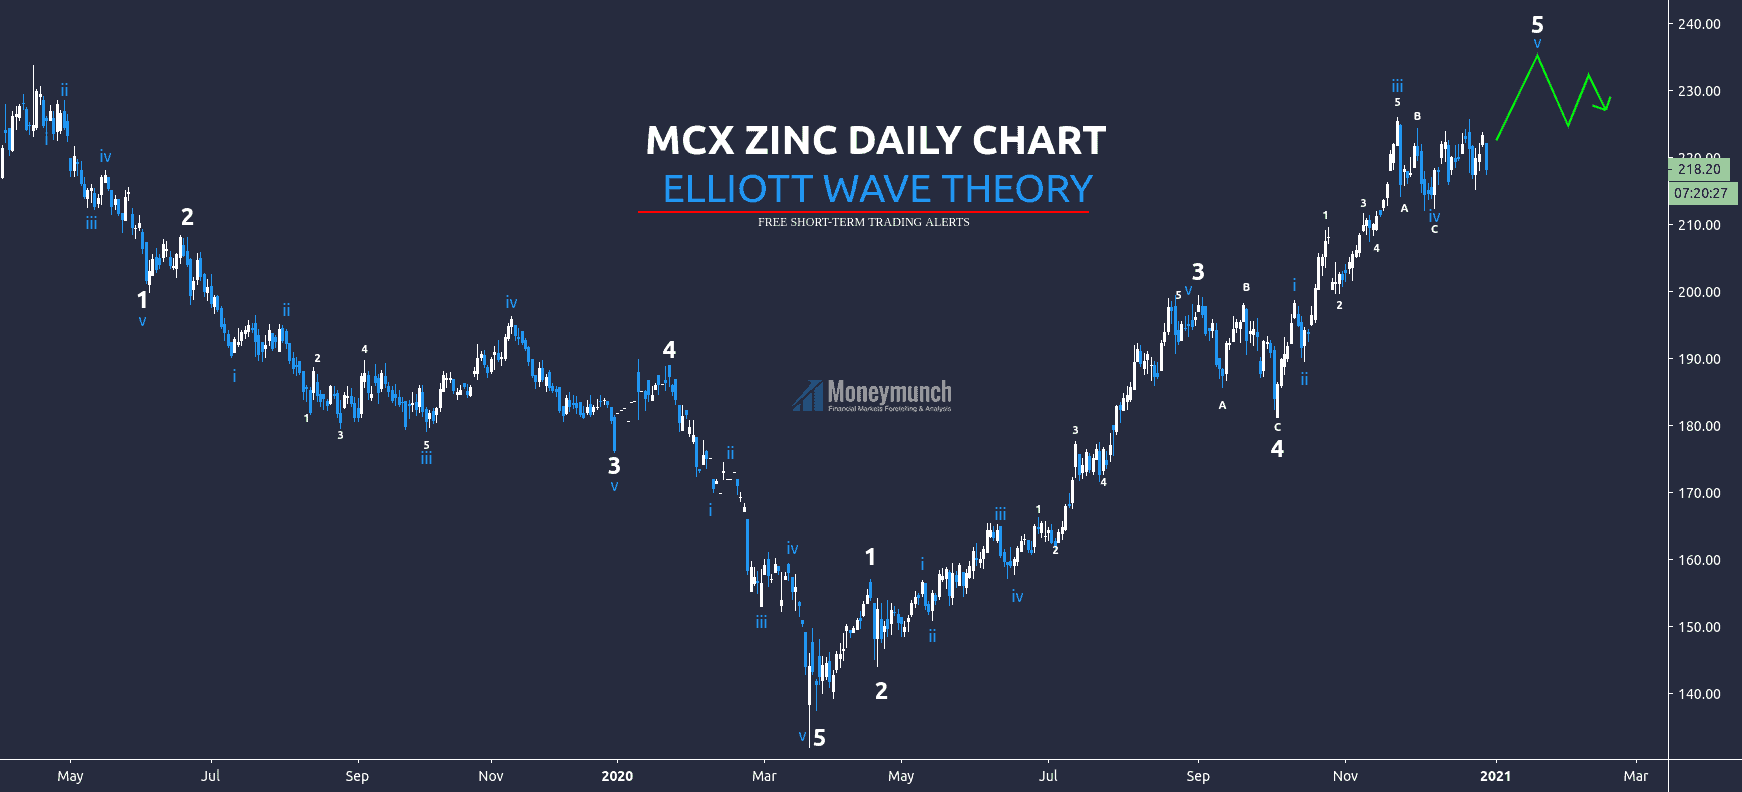
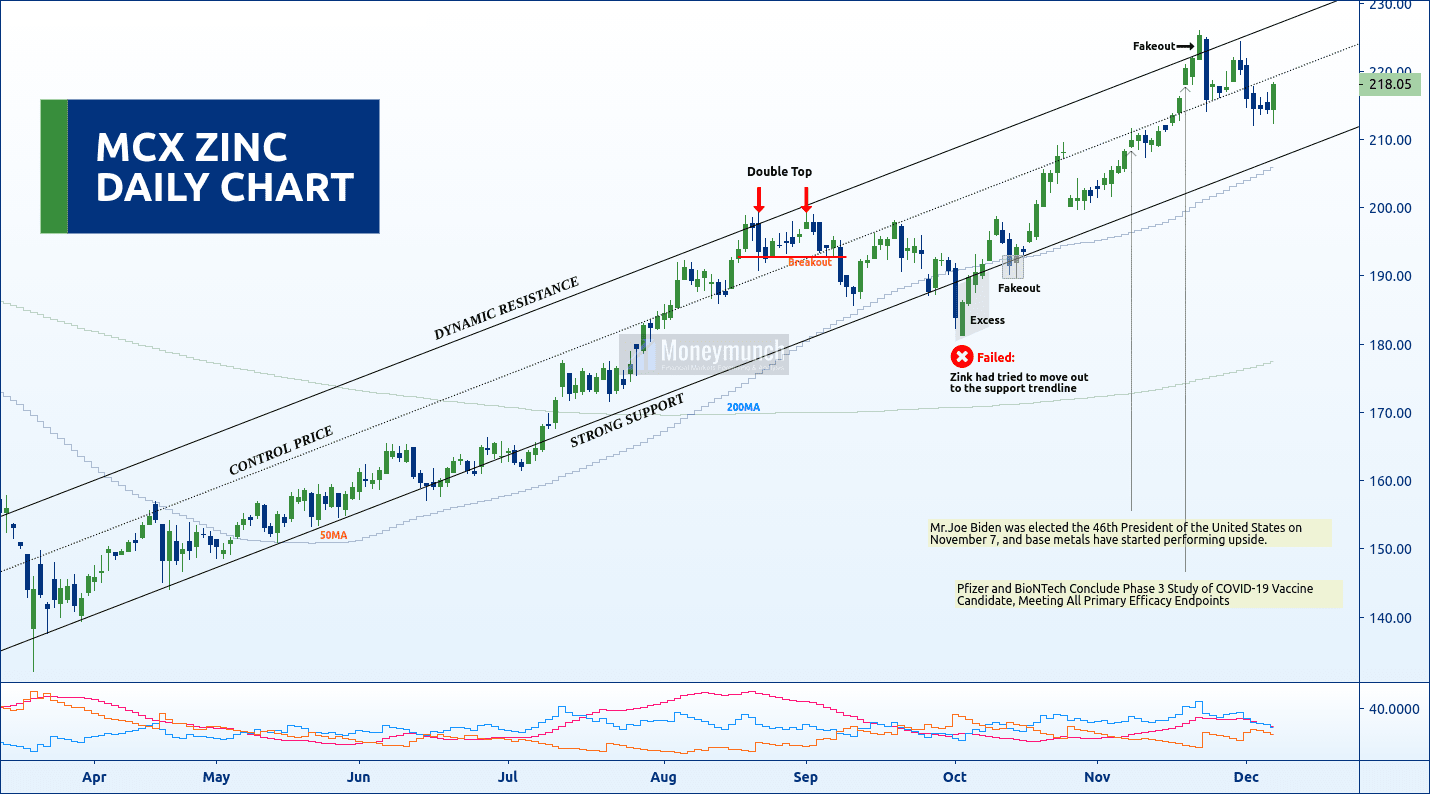
MCX Zinc Will Touch 240 by EWT
Here’s the daily chart of the MCX zinc. It has made two Elliott waves. The first one is bearish, and the second one is bullish. The bearish was started from the 11th of April 2019 and ended on the 19th of March 2020. The bullish one started on the 19th of March 2020, and the fifth wave of this Elliott wave is remaining. In the Elliott wave theory, each wave has five sub-waves.
Short-term investors can see the following levels soon: 228 – 234 – 240.
To become a subscriber, subscribe to our free newsletter services. Our service is free for all.
 Unlock This Article