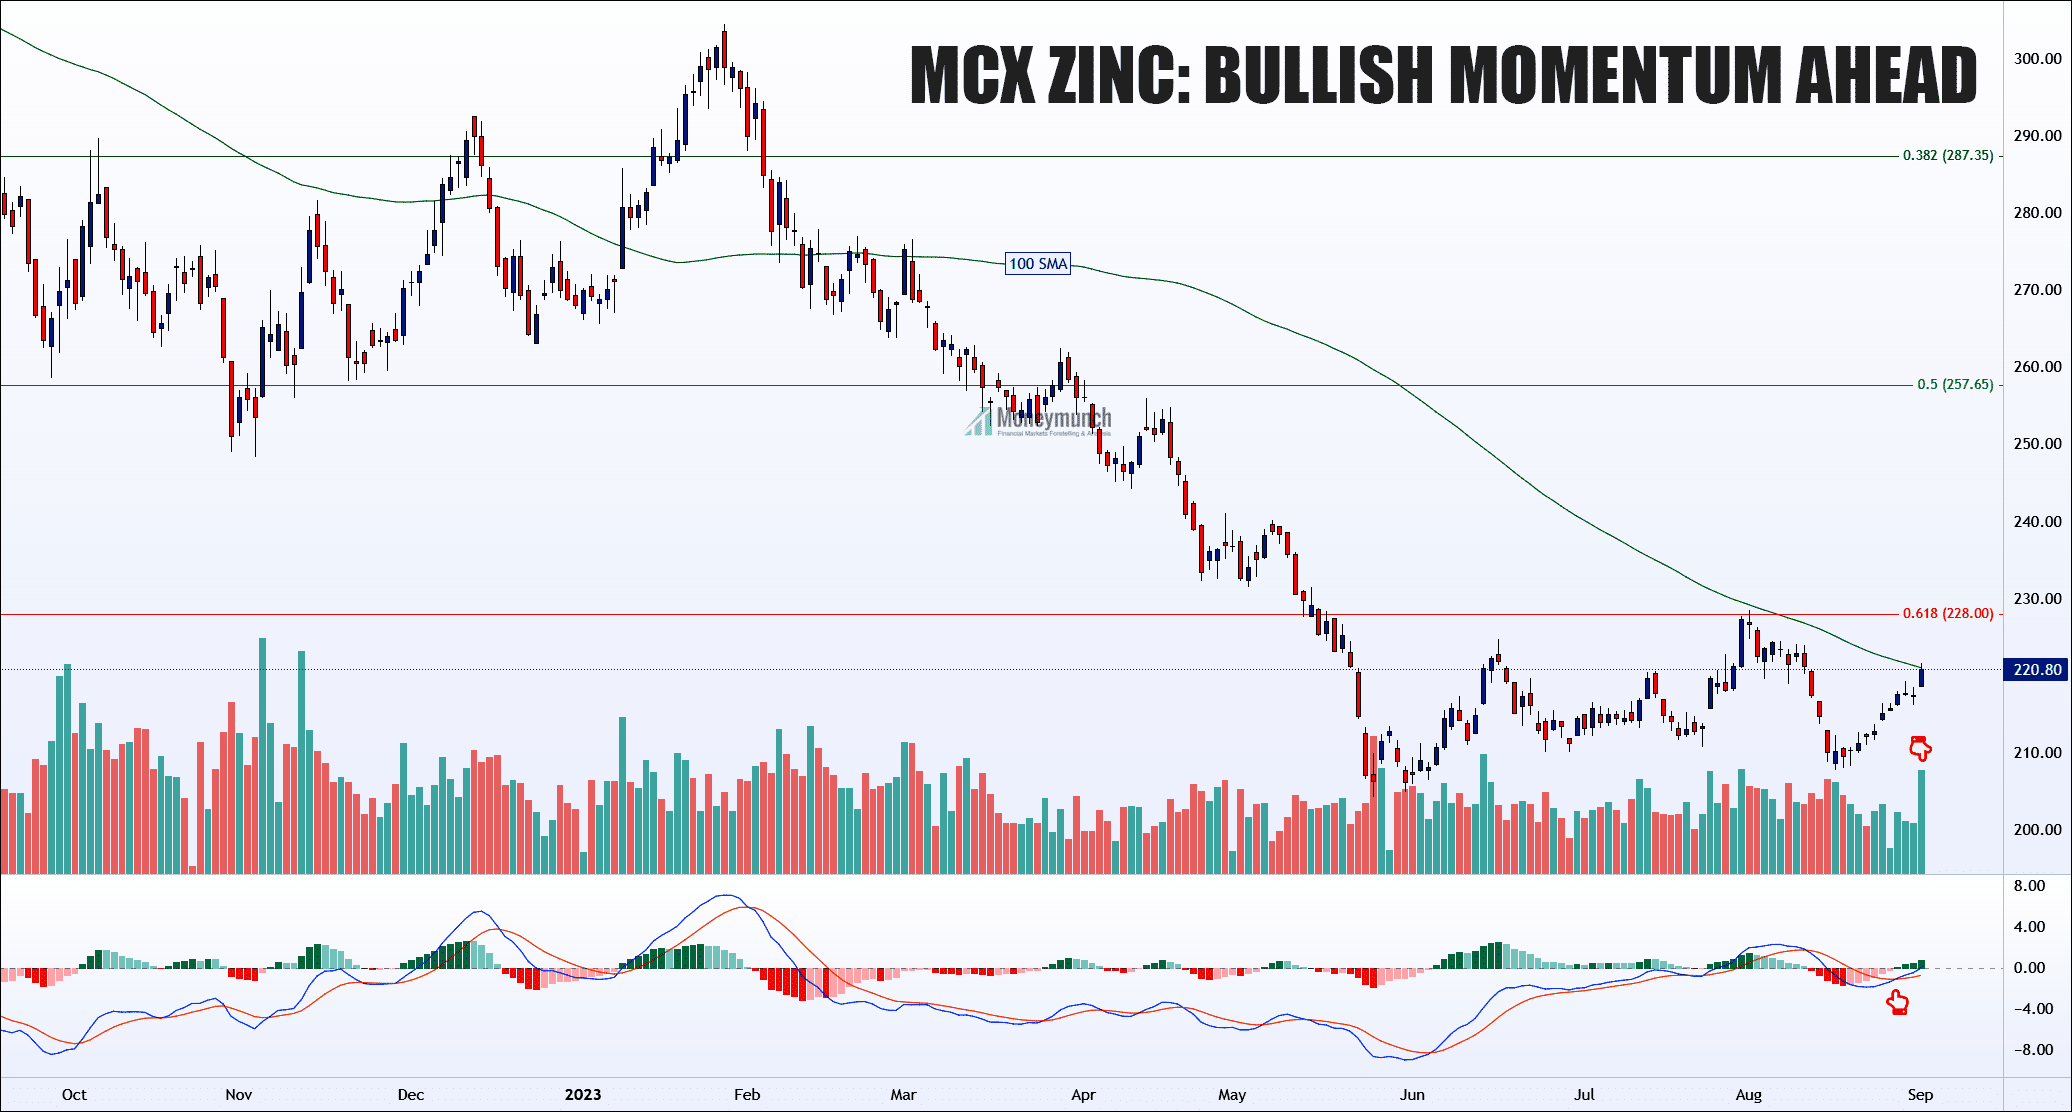
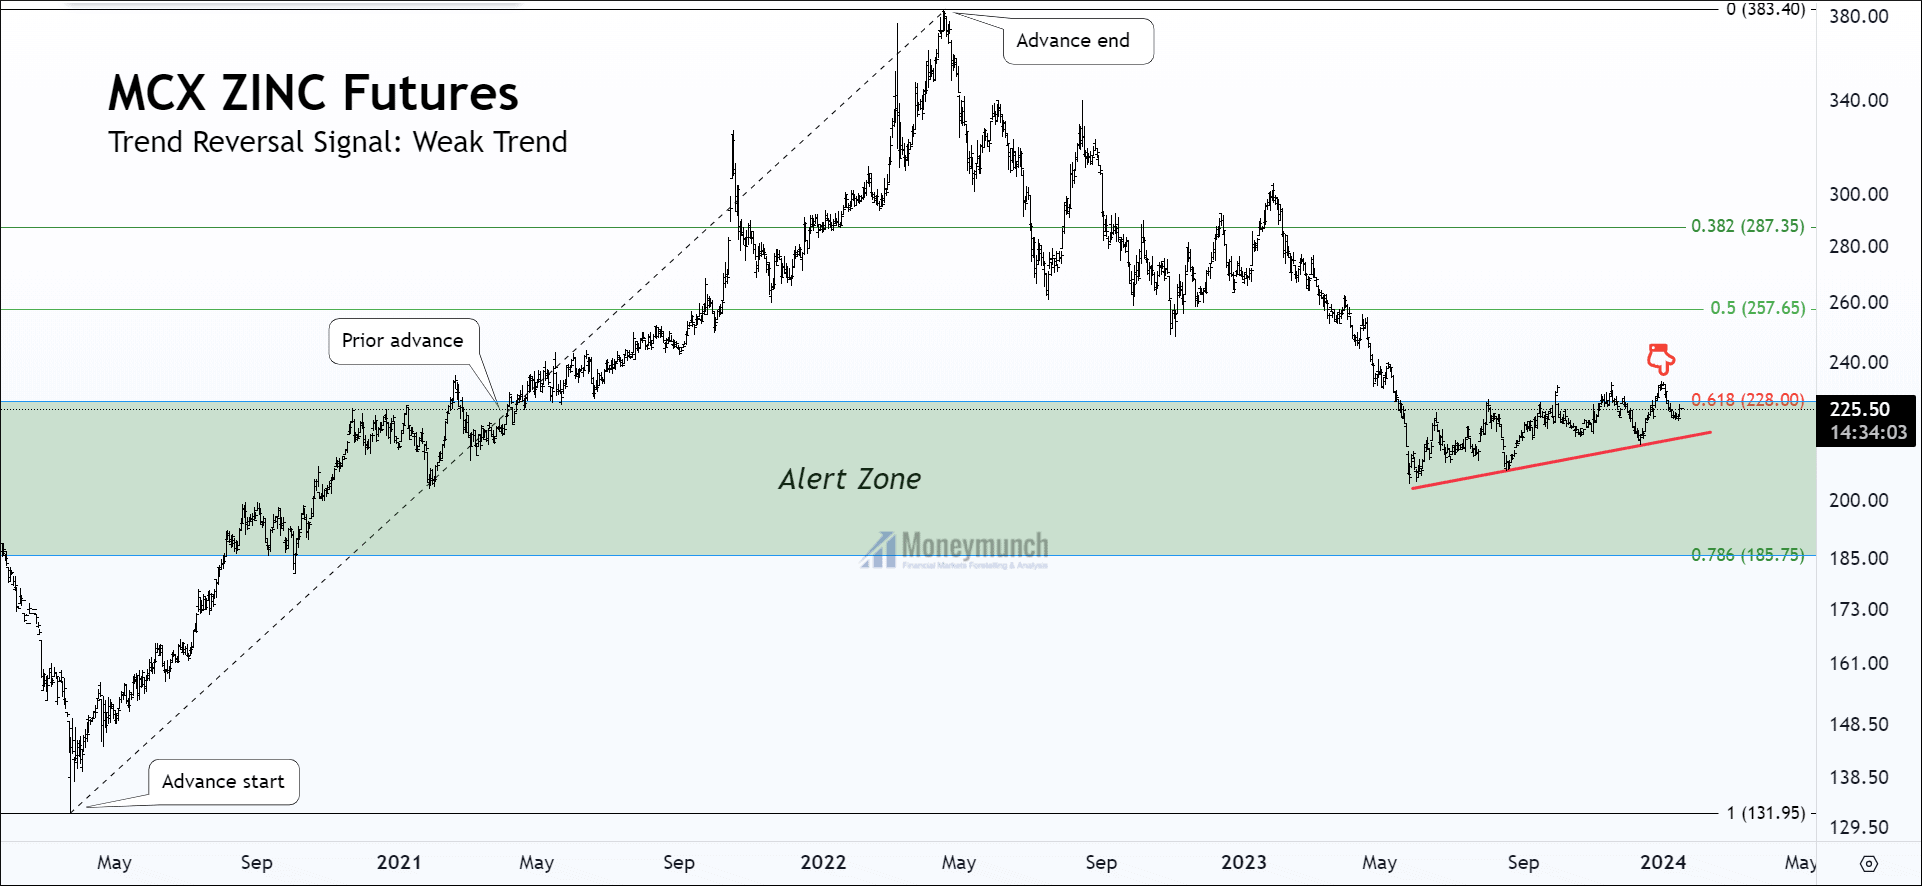
MCX Nickel – Parabolic Curve Pattern & Tips

free commodity nickel weekly chart tips

This is MCX Nickel weekly chart. Price projection is based on Parabolic Curve & Fib Retracement.

As mentioned in the chart, At the end-point of Base 3, indicated by the “X” symbol, the nickel could double in the shortest period of time. Targets: 1426 – 1632 – 1778 – 1854 – 1962 (2.618Based on Fib Retracement).

If nickel breaks the curve line, it can collapse up to “X” or base 3 deep. Hence, we can see the following targets from the selling point: 1130 – 1050 – 960 – 850 and below.

Remember, trade with the direction of the breakout. And stop-loss above/below breakout level.

To become a subscriber, subscribe to our free newsletter services. Our service is free for all.

Continue reading

MCX Aluminium 2021’s Supercycle

free commodity aluminium tips chart

MCX Aluminium is moving sharply. Its range is 21 to 23 bars or a month. It can fall back up to the support trendline (TP: 159 – 156).

According to this chart, aluminum will not stop here. It is further advance up to 168 – 172 – 176 levels.

PREVIOUS TRADING CALLS UPDATES

To become a subscriber, subscribe to our free newsletter services. Our service is free for all.

Continue reading

MCX Copper in a Temporary Pullback (EWT)

free commodity copper tips daily chart

Copper has made the Bullish Elliott wave on the daily timeframe. It’s completed the five-wave cycle, ABC correction is remaining. After the 5th wave, the trend started to make the A, and it’s still making it. MCX copper has to cross 585 – 580 – 560. After that, it will rise for a short period to make the B. And it will fall again to make C. But all over, it’s an uptrend.

To become a subscriber, subscribe to our free newsletter services. Our service is free for all.

Continue reading

MCX Zinc & Lead Tips & Elliott Wave View

free commodity lead chart tips

MCX Lead Short-term Cycle Shows Big Trend

It’s the daily chart of the lead. Here, it has made the bullish Elliott pattern, and the ABC correction was completed on the 24th of December 2020. And right now, it started to move upside as per the rules of the bullish Elliott wave pattern. And it will move upwards till 158.6 – 162.

free mcx zinc tips chart

MCX Zinc Will Touch 240 by EWT

Here’s the daily chart of the MCX zinc. It has made two Elliott waves. The first one is bearish, and the second one is bullish. The bearish was started from the 11th of April 2019 and ended on the 19th of March 2020. The bullish one started on the 19th of March 2020, and the fifth wave of this Elliott wave is remaining. In the Elliott wave theory, each wave has five sub-waves.

Short-term investors can see the following levels soon: 228 – 234 – 240.

To become a subscriber, subscribe to our free newsletter services. Our service is free for all.

Continue reading

Will Zinc Return at a Strong Support Trendline?

free commodity zinc tips chart

Zinc took a bounce back from the lower levels yesterday, and it has failed to break last week’s low level of 212.1. Intraday traders can initiate long positions for levels of 219.6 – 220.

If it breaks last week’s low, we may see 210 – 208.6 levels. Overall, it’s positive. Long positions can be initiate with targets at 221.6 – 224 – 230 in extension.

The DMI & MA is bullish and calls for further advance.

To become a subscriber, subscribe to our free newsletter services. Our service is free for all.

Continue reading

Nickel’s Strong Buy Signal for Short-Term

free commodity nickel chart tips

According to this chart, nickel is further advance. Once it breaks the hurdle, it will start marching for 1260 – 1280 – 1300 levels.

Hurdle: 1236

Whenever it hits the hurdle level, what will happen? Here, it will act as resistance. We may see reversal up to the support line (1212 – 1180).

Short-term investors can continue position for the above targets. To become a subscriber, subscribe to our free newsletter services. Our service is free for all.

This is part II. You can also refer to the previous report of nickel by clicking here.

Continue reading