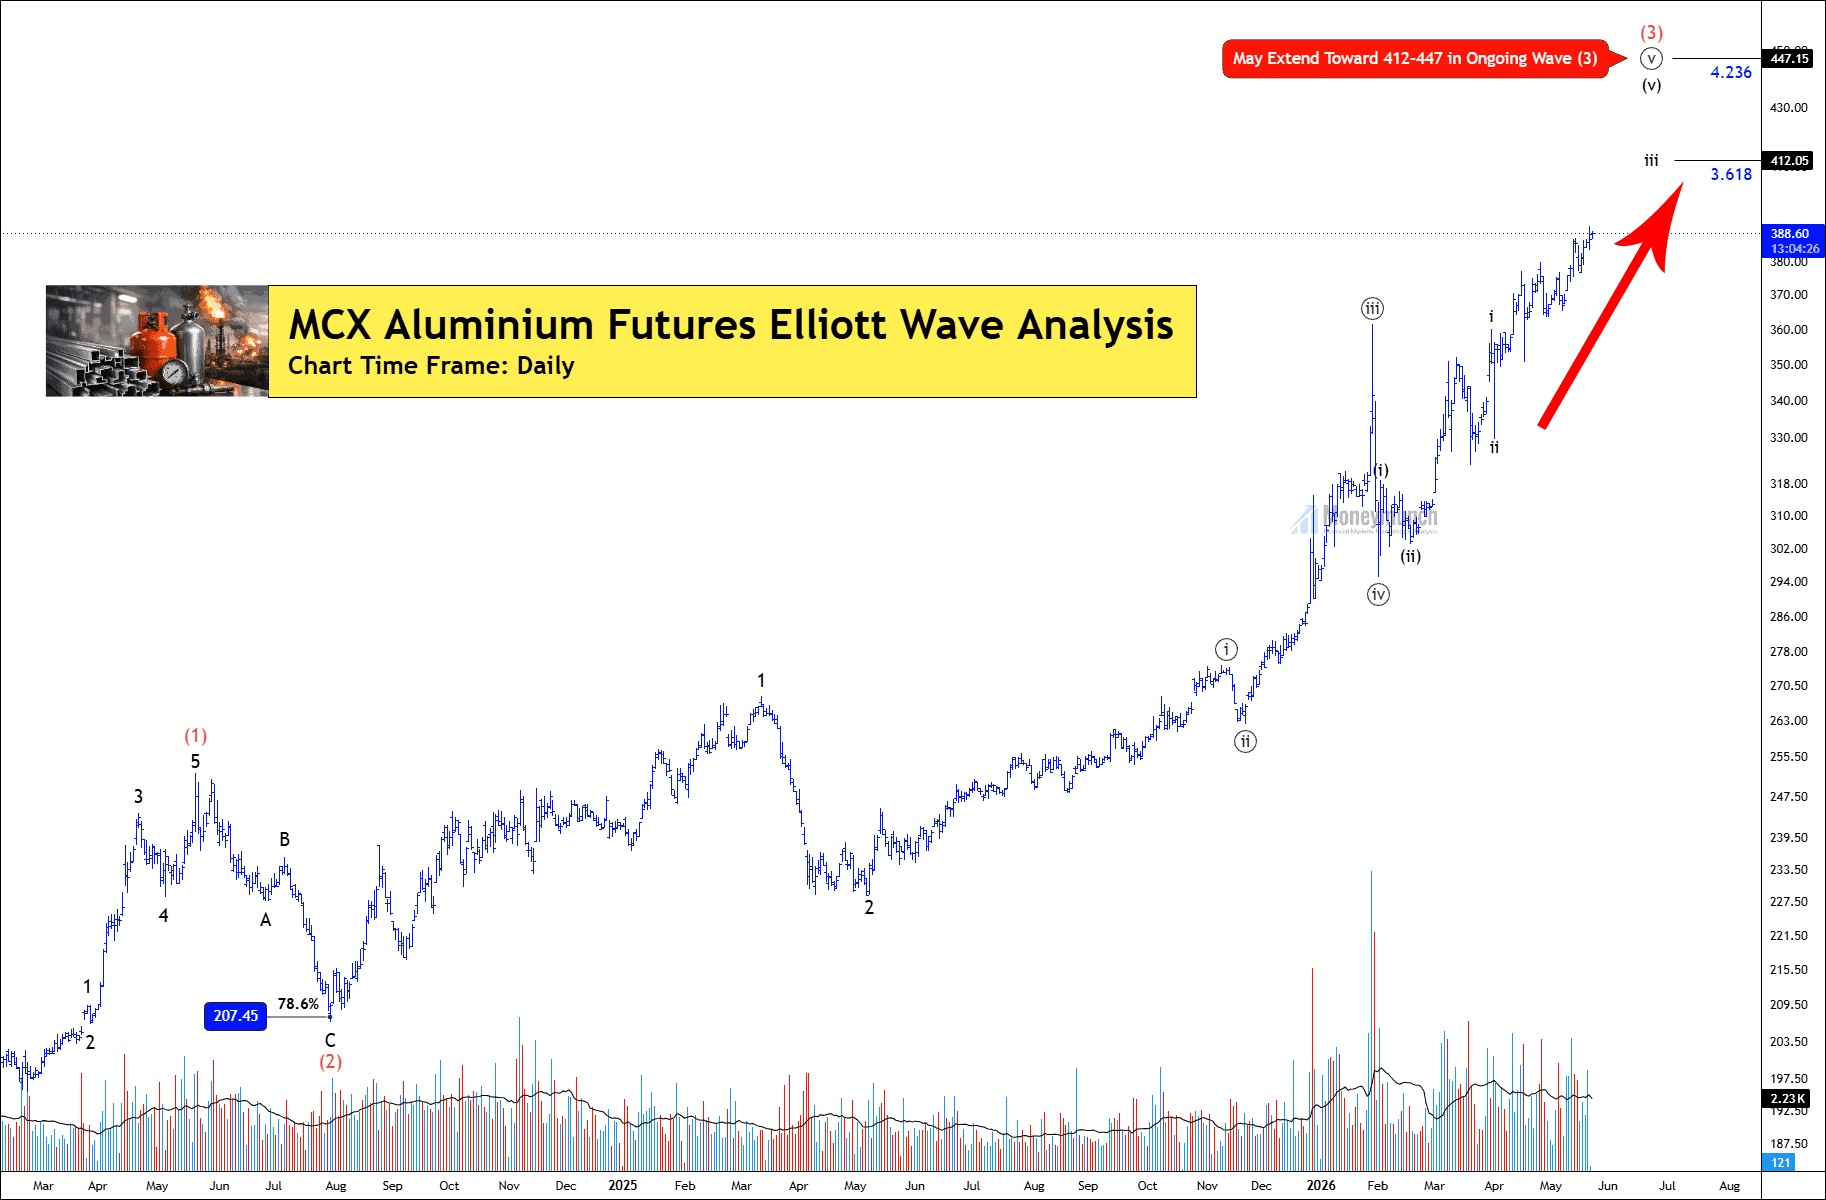
Stay ahead in the base metals market with our expert tips and analysis. Our research reports cover all aspects of base metals trading, including aluminum, copper, lead, nickel, and zinc, to help you make informed decisions and maximize your profits.
Sub-wave c of wave (2) of wave ((4)) occurred at 689.5. If the price breaks out wave B at 756, traders can trade for the following targets: 800 – 840 – 877+.
Examining the daily chart of MCX Zinc utilizing Fibonacci retracement, notable developments are observed. In May 2023, Zinc breached the 61.8% retracement level but did not test the subsequent level at 78.6%. Instead, it retraced back to the 61.8% level. The pivotal level of 228 suggests that the downtrend in Zinc may have concluded. This level holds significance as it could propel Zinc upwards, targeting levels of 236, 242, and potentially 257.6.
According to the principles of Fibonacci retracement, a weak trend reversal signal is indicative of a weak trend. Therefore, if Zinc breaches the red trendline, a potential downside with target prices of 212, 206, and 200 could be anticipated. Caution is advised between the 61.8% retracement level and the trendline.
MCX Aluminum Outlook
Lock
Only subscribers can read the full article. Please log in to read the entire text.
Have you any questions/feedback about this article? Please leave your queries in the comment box for answers.
Disclaimer: The information provided on this website, including but not limited to stock, commodity, and forex trading tips, technical analysis, and research reports, is solely for educational and informational purposes. It should not be considered as financial advice or a recommendation to engage in any trading activity. Trading in stocks, commodities, and forex involves substantial risks, and you should carefully consider your financial situation and consult with a professional advisor before making any trading decisions. Moneymunch.com and its authors do not guarantee the accuracy, completeness, or reliability of the information provided, and shall not be held responsible for any losses or damages incurred as a result of using or relying on such information. Trading in the financial markets is subject to market risks, and past performance is not indicative of future results. By accessing and using this website, you acknowledge and agree to the terms of this disclaimer.
MCX Zinc Signals Potential Bullish Momentum with Clear Target Levels
MCX Zinc is currently right at its 100-day Simple Moving Average (SMA). Additionally, we’ve seen a positive crossover on the Moving Average Convergence Divergence (MACD) indicator.
Closing above the SMA 100 is significant, indicating a potential upward move with two target levels at 224 and 228 in the coming days. This is an appealing opportunity for short-term traders.
It’s important to note that initiating a position when the price is below the SMA 100 is not recommended due to higher risk.