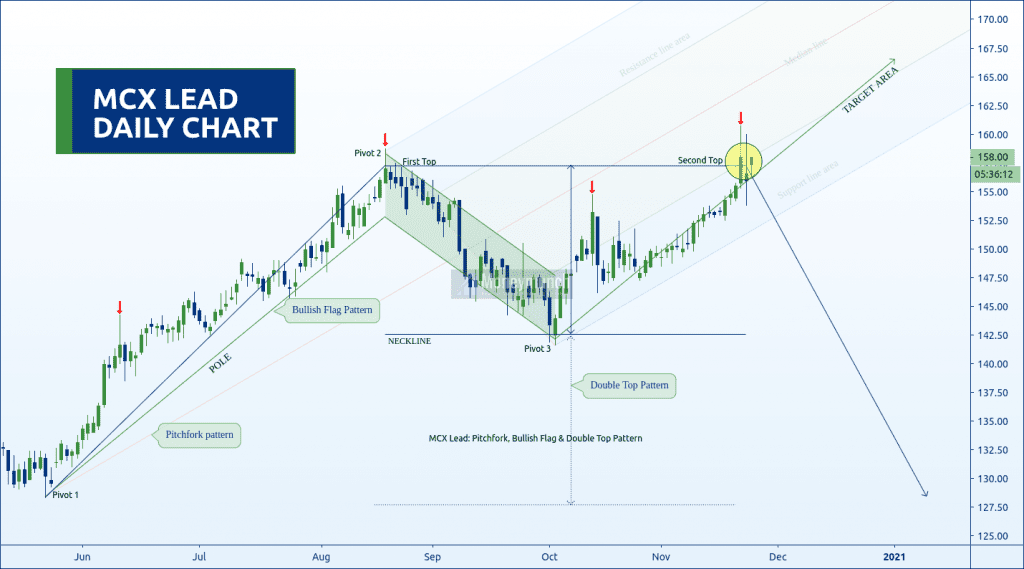
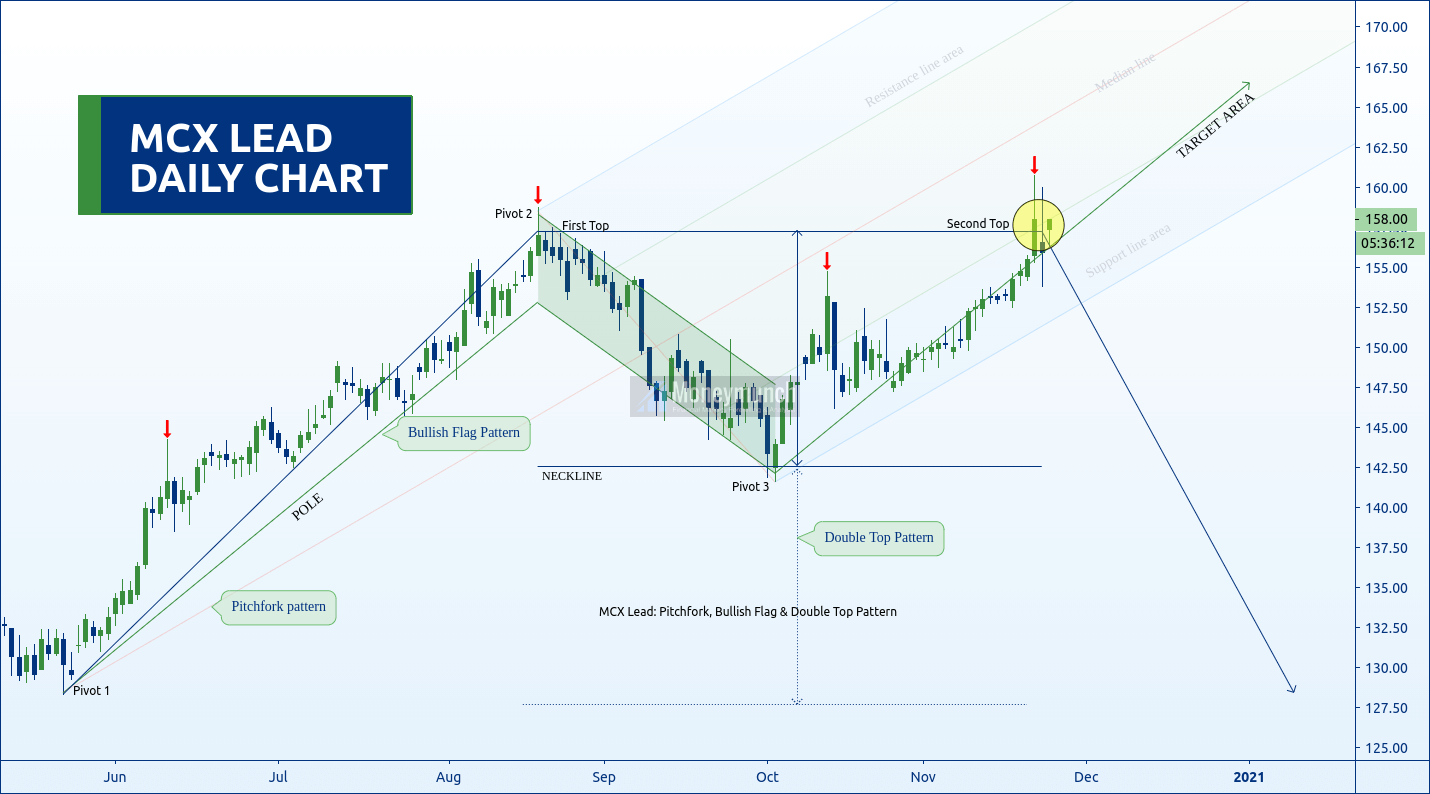
Here I have used the three most popular patterns, which are pitchfork pattern, bullish flag pattern, and double top pattern on MCX Nickel daily chart.
First, let’s start with a pitchfork pattern. Nickel is running on the support line area. This movement indicates a continuous uptrend ahead.
The second thing is the bullish flag pattern, which also indicates the same. After a short reversal, nickel will start marching for the following targets: 162 – 164 – 166+
If the trend breaks the support line, there will be an activation of the double top pattern, which indicates the fall to the following levels: 148 – 145 – 142.6
Additionally, a breakout of the neckline is a direct sign of an extreme downtrend. And that will become unstoppable and hit the following levels: 136 – 132 – 128
To become a subscriber, subscribe to our free newsletter services. Our service is free for all.
Get free MCX ideas, chart setups, and analysis for the upcoming session: Commodity Tips →
Have you any questions/feedback about this article? Please leave your queries in the comment box for answers.

