Did you read the gold report? If not, click the below link.
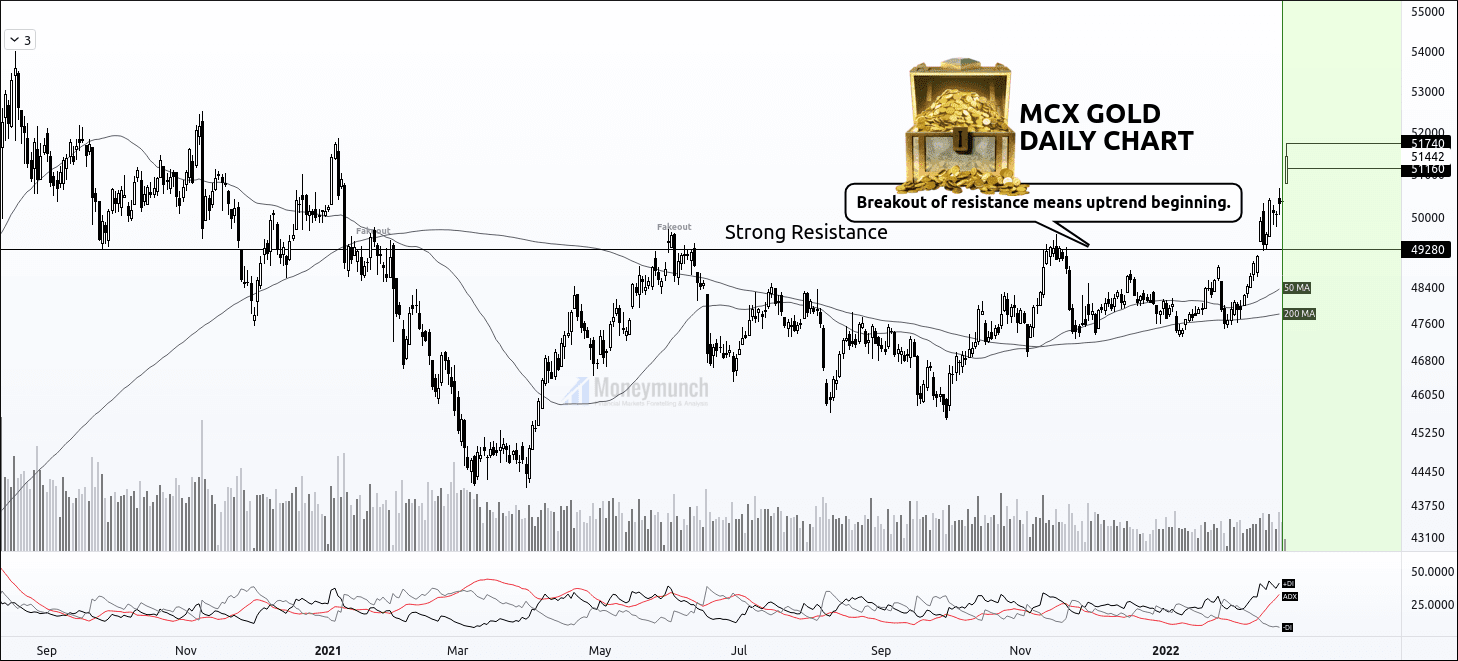
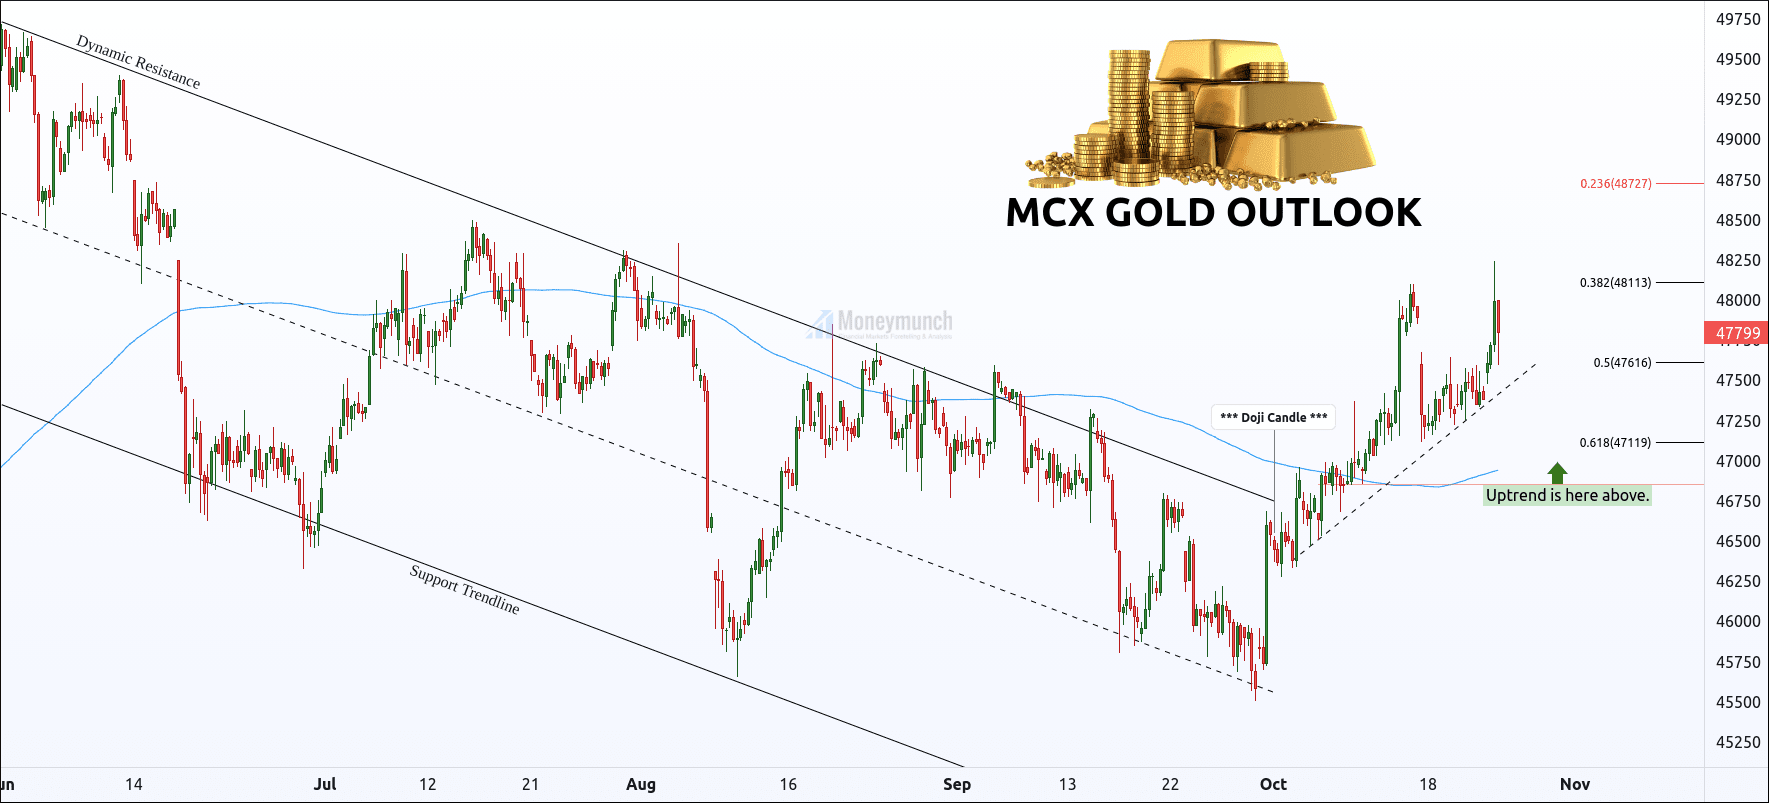
22 Feb 2022: MCX Gold’s Bullish Mode Activated
While the gold price at 50532, I had written, “we will see the gold price above 51160 – 51740“.
Today, it has touched the first & second target. Who bought it? Profit per lot: Rs.1,20,800
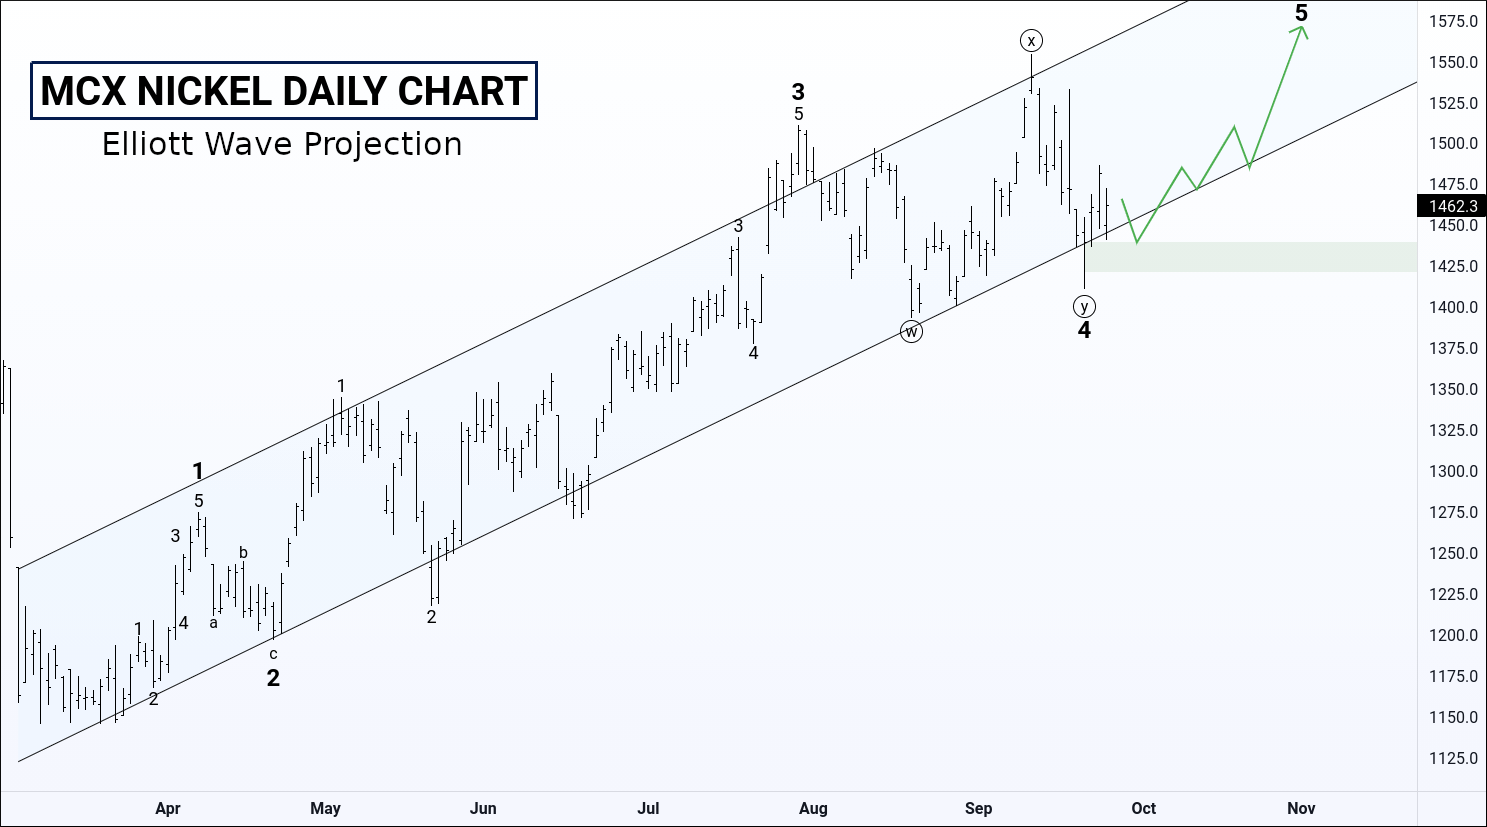
I have updated a full report of Nickel on Feb 6, 2022. Did you read it? If not, click the below link:
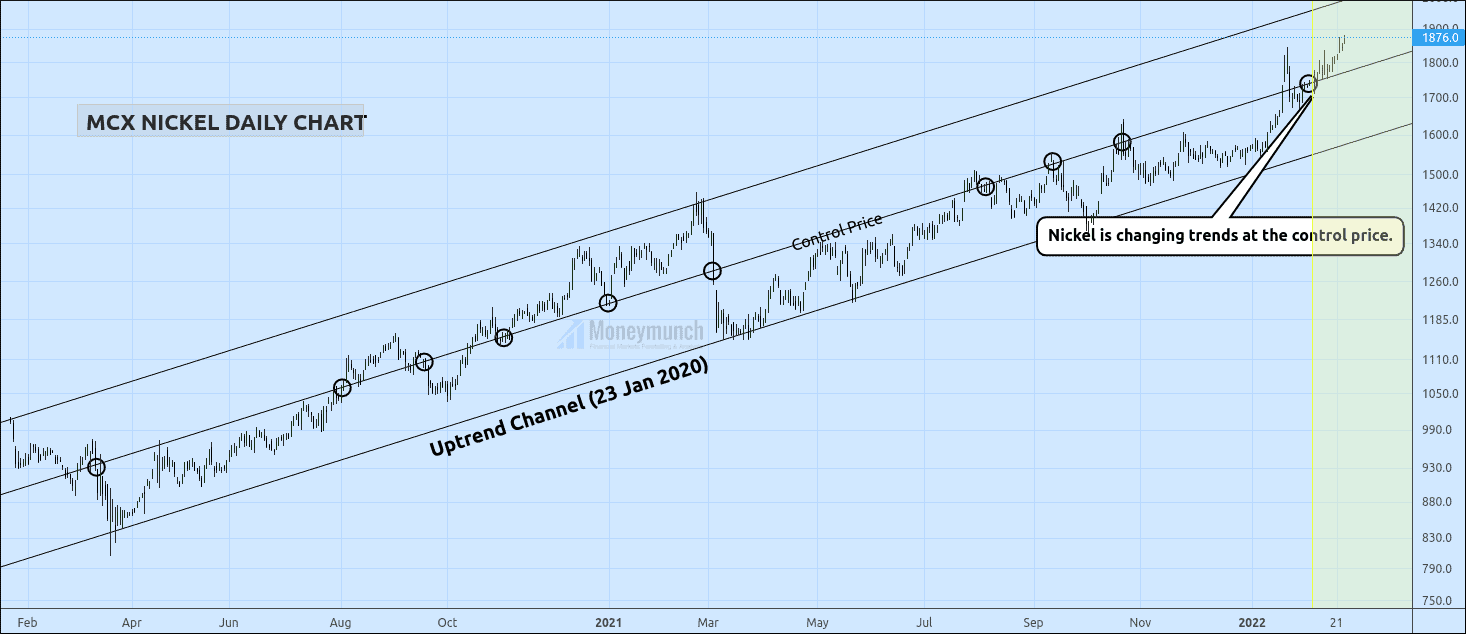
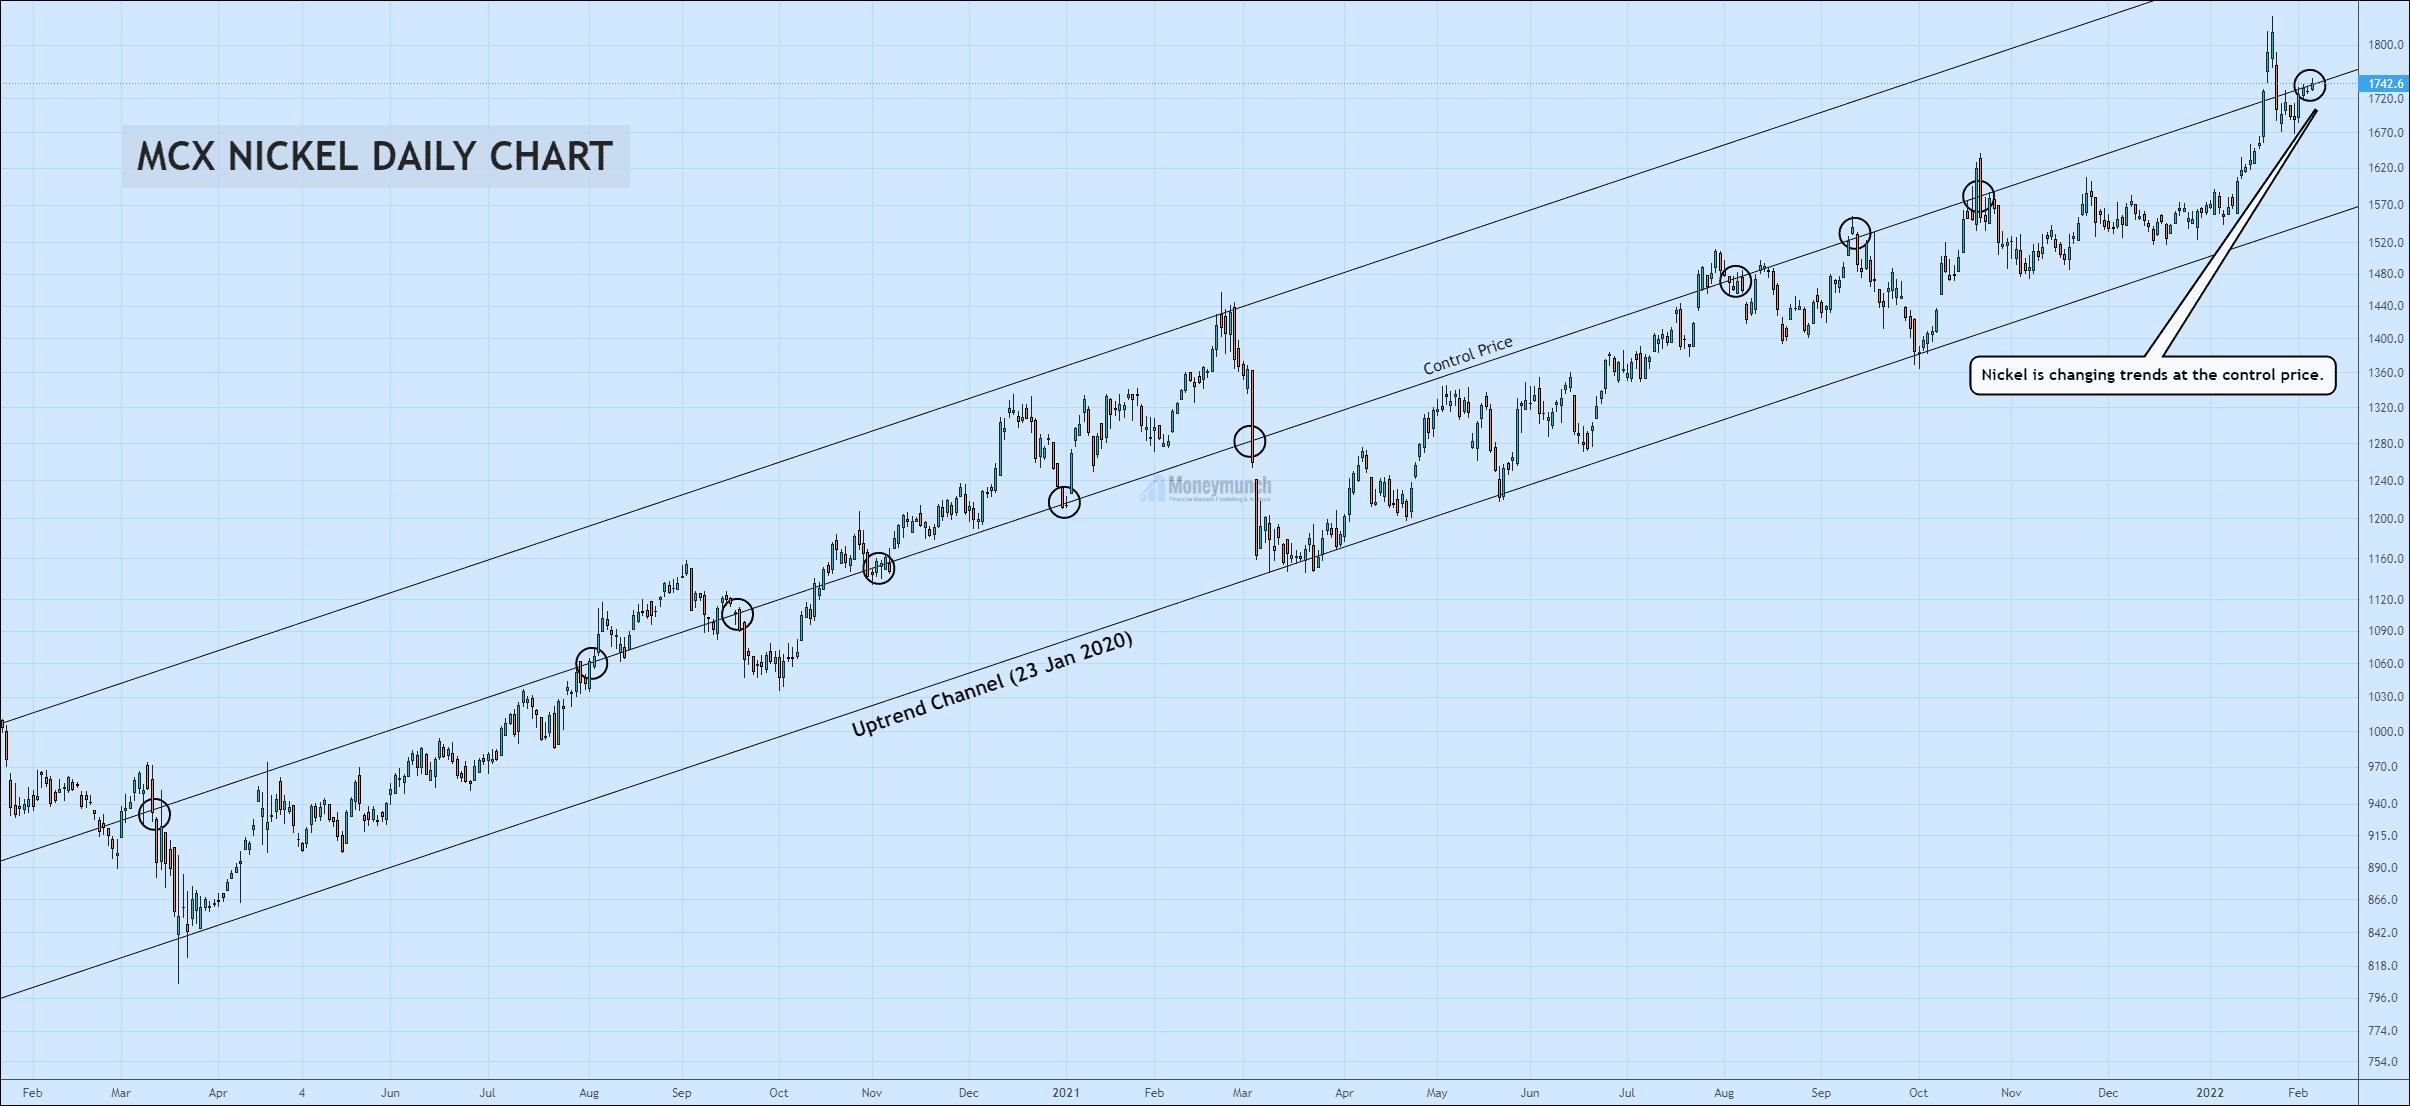
2020’s Uptrend Channel Is Everything For MCX Nickel
I had written, “It’s a sign for a buy signal. But intraday or short-term investors should confirm that breakout before proceeding. And they must look out for candle’s fakeout. Afterward, be ready for the targets of 1800 – 1840 – 1876+“.
Today nickel has touched all targets. Who bought it? The target was 133.4 points. Profit per lot: Rs.2,00,100
What else do you need from a free subscription!? To become a subscriber, subscribe to our free newsletter services. Our service is free for all.


 Unlock This Article