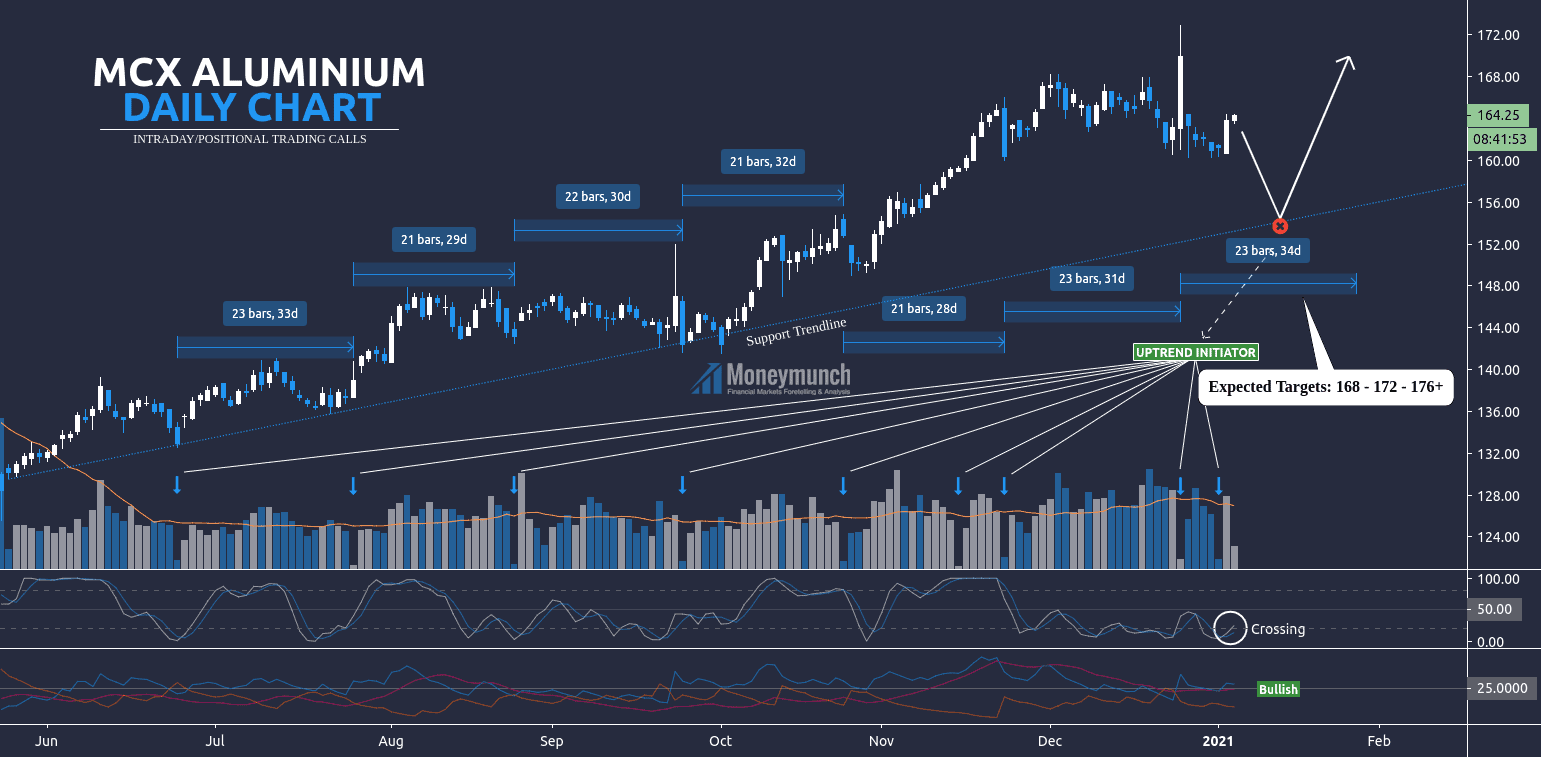
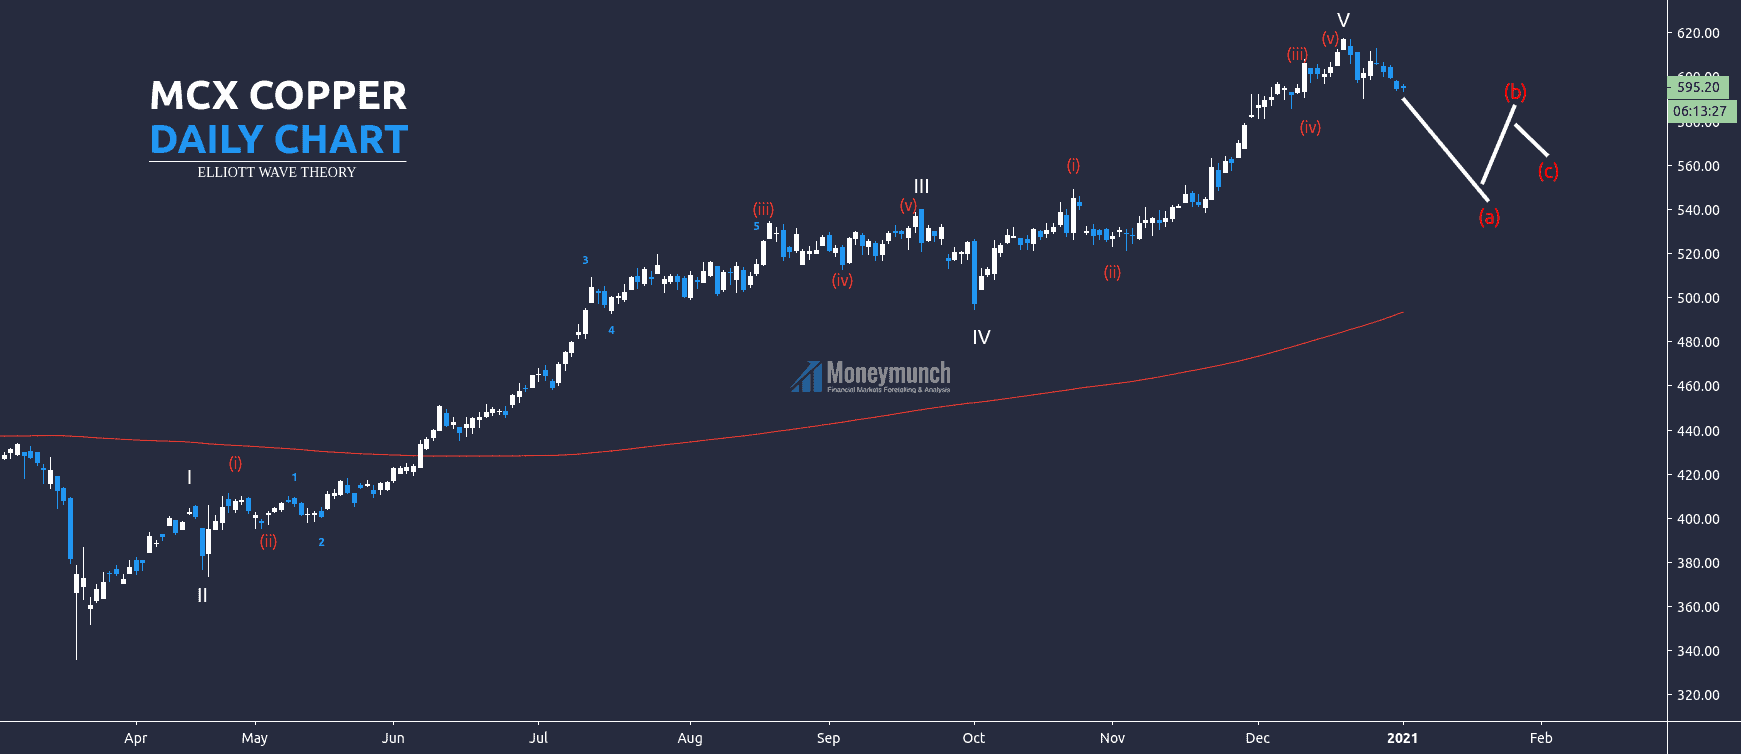
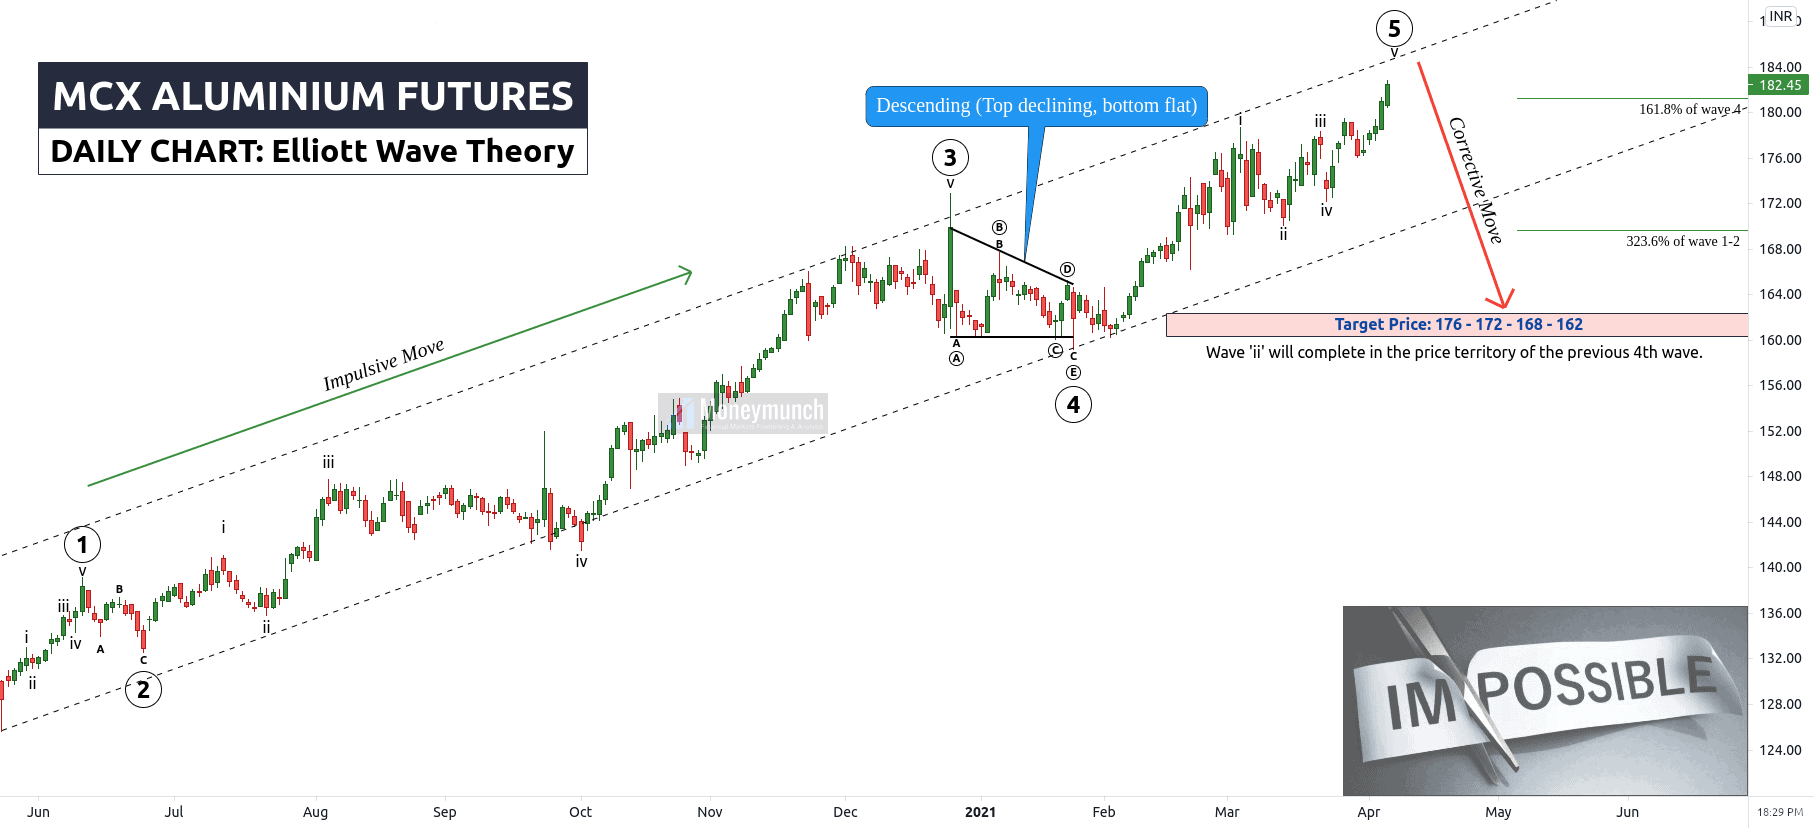
Crude oil, Brent oil, & Aluminium Chartolgy & Next Big Move

free mcx aluminium tips charts

Aluminium Is Close To Something Big

According to this chart, MCX Aluminium can fly from here if it does not close below 176.4 levels.

Targets: 178.6 – 179.6
Short-term targets: 180 – 181.6+

But, if it closes below 176.4 levels, then this call will deactivate. And it will start collapsing for the levels of 174 – 172 from there.

crude & brent oil tips & updates

Crude Oil Is Going to Blast – A New Update & Tips

How many of you sold crude oil on the previous Thursday?
Article: MCX Crude Oil & NYMEX Brent Oil In-depth Analysis & Tips

In the previous article on crude oil & brent oil, I said in bold words, “…so, intraday traders can set the following targets to make some money: 4560 – 4500 – 4460 – 4400 | …and, if brent oil breaks the hurdle ($66.60) and shows a closing price below it, we will see a heavy downfall. Targets: $64.6 – $62.8 and below”.

The crude oil has reached all targets! Enjoy!

What next? To become a subscriber, subscribe to our free newsletter services. Our service is free for all.

Continue reading

Here’s Why MCX Copper Yesterday Moved Down

free commodity copper daily chart tips

LONG-TERM INVESTORS:
Copper has broken March 2020 resistance trend line, and true resistance breakout is a clear signal to buy. Target prices for long-term traders: 760 – 800+

INTRADAY TRADERS:
But at present, MCX copper can pull back to the previous resistance line to continue an uptrend. So, intraday traders can sell for the following targets: 690 – 680 – 676

To become a subscriber, subscribe to our free newsletter services. Our service is free for all.

Continue reading

MCX Nickel – Parabolic Curve Pattern & Tips

free commodity nickel weekly chart tips

This is MCX Nickel weekly chart. Price projection is based on Parabolic Curve & Fib Retracement.

As mentioned in the chart, At the end-point of Base 3, indicated by the “X” symbol, the nickel could double in the shortest period of time. Targets: 1426 – 1632 – 1778 – 1854 – 1962 (2.618Based on Fib Retracement).

If nickel breaks the curve line, it can collapse up to “X” or base 3 deep. Hence, we can see the following targets from the selling point: 1130 – 1050 – 960 – 850 and below.

Remember, trade with the direction of the breakout. And stop-loss above/below breakout level.

To become a subscriber, subscribe to our free newsletter services. Our service is free for all.

Continue reading

MCX Aluminium 2021’s Supercycle

free commodity aluminium tips chart

MCX Aluminium is moving sharply. Its range is 21 to 23 bars or a month. It can fall back up to the support trendline (TP: 159 – 156).

According to this chart, aluminum will not stop here. It is further advance up to 168 – 172 – 176 levels.

PREVIOUS TRADING CALLS UPDATES

To become a subscriber, subscribe to our free newsletter services. Our service is free for all.

Continue reading

MCX Copper in a Temporary Pullback (EWT)

free commodity copper tips daily chart

Copper has made the Bullish Elliott wave on the daily timeframe. It’s completed the five-wave cycle, ABC correction is remaining. After the 5th wave, the trend started to make the A, and it’s still making it. MCX copper has to cross 585 – 580 – 560. After that, it will rise for a short period to make the B. And it will fall again to make C. But all over, it’s an uptrend.

To become a subscriber, subscribe to our free newsletter services. Our service is free for all.

Continue reading

MCX Zinc & Lead Tips & Elliott Wave View

free commodity lead chart tips

MCX Lead Short-term Cycle Shows Big Trend

It’s the daily chart of the lead. Here, it has made the bullish Elliott pattern, and the ABC correction was completed on the 24th of December 2020. And right now, it started to move upside as per the rules of the bullish Elliott wave pattern. And it will move upwards till 158.6 – 162.

free mcx zinc tips chart

MCX Zinc Will Touch 240 by EWT

Here’s the daily chart of the MCX zinc. It has made two Elliott waves. The first one is bearish, and the second one is bullish. The bearish was started from the 11th of April 2019 and ended on the 19th of March 2020. The bullish one started on the 19th of March 2020, and the fifth wave of this Elliott wave is remaining. In the Elliott wave theory, each wave has five sub-waves.

Short-term investors can see the following levels soon: 228 – 234 – 240.

To become a subscriber, subscribe to our free newsletter services. Our service is free for all.

Continue reading