Research Report – MCX ALUMINIUM, GOLD, NATURALGAS
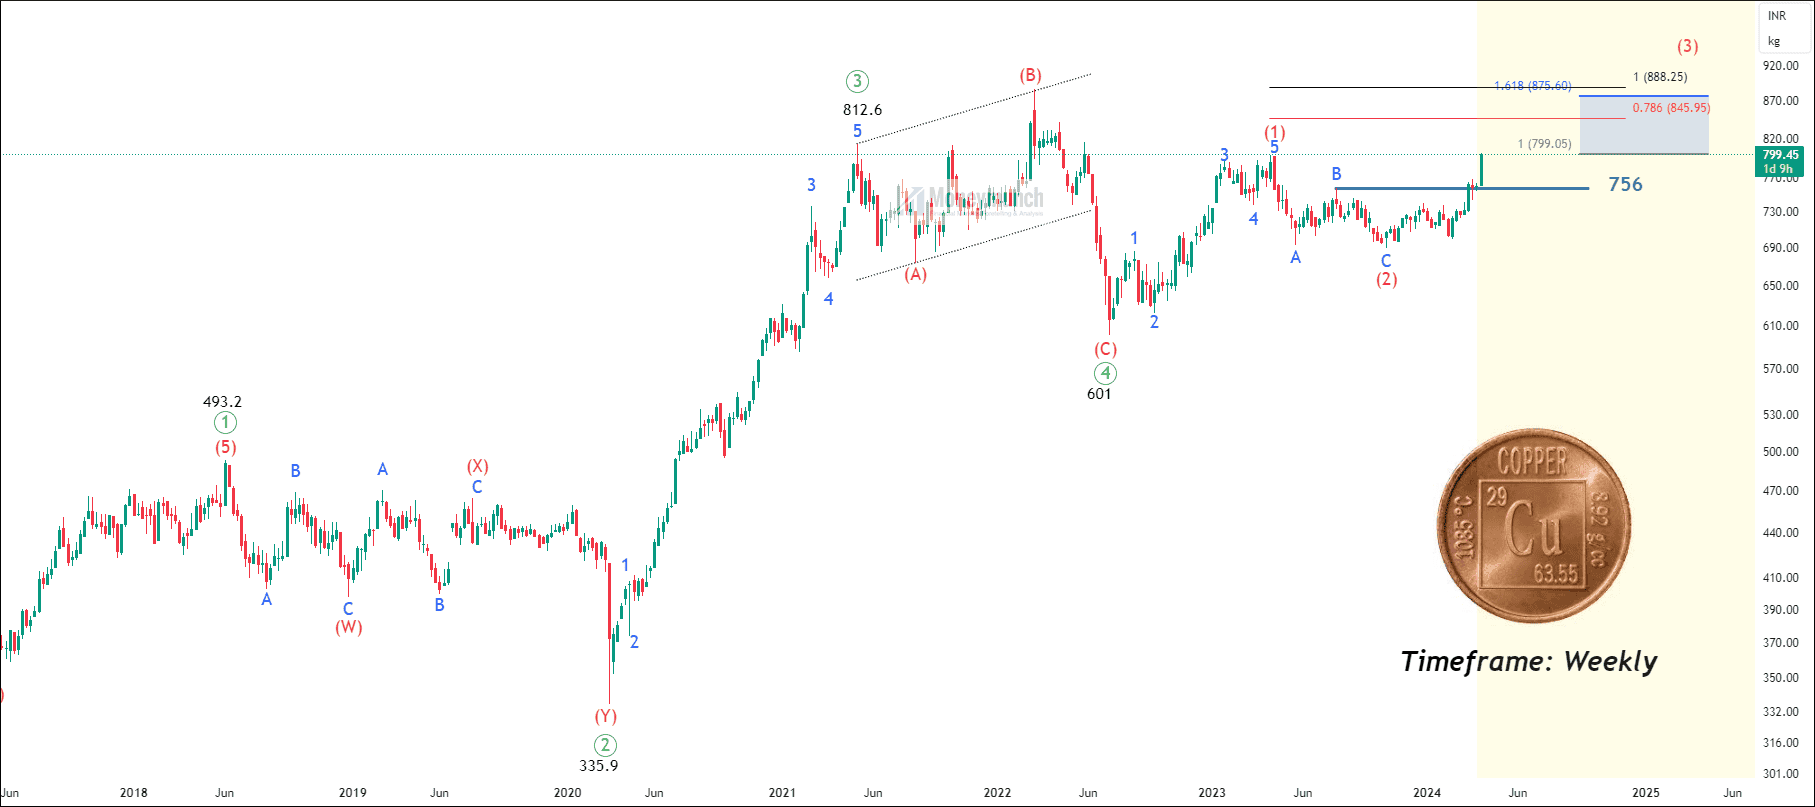
Will NSE COPPER Reach the Final Target?
Did you trade MCX Copper Wave Setup?
Click here: Long-Term View: IS MCX Copper Preparing For A Take-Off?
 BEFORE
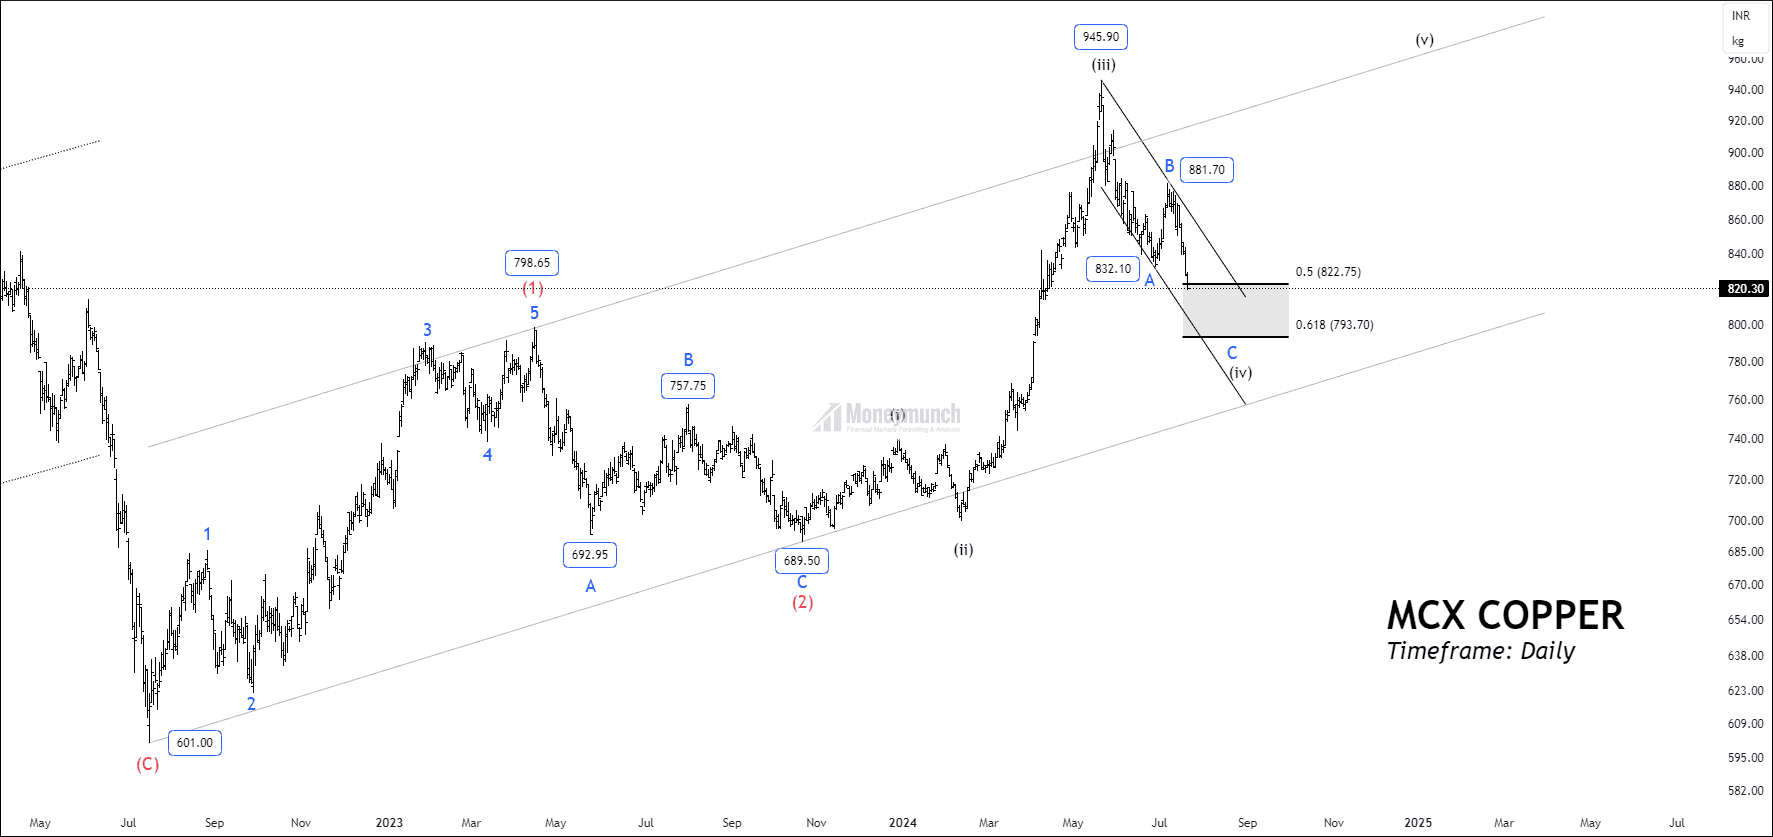
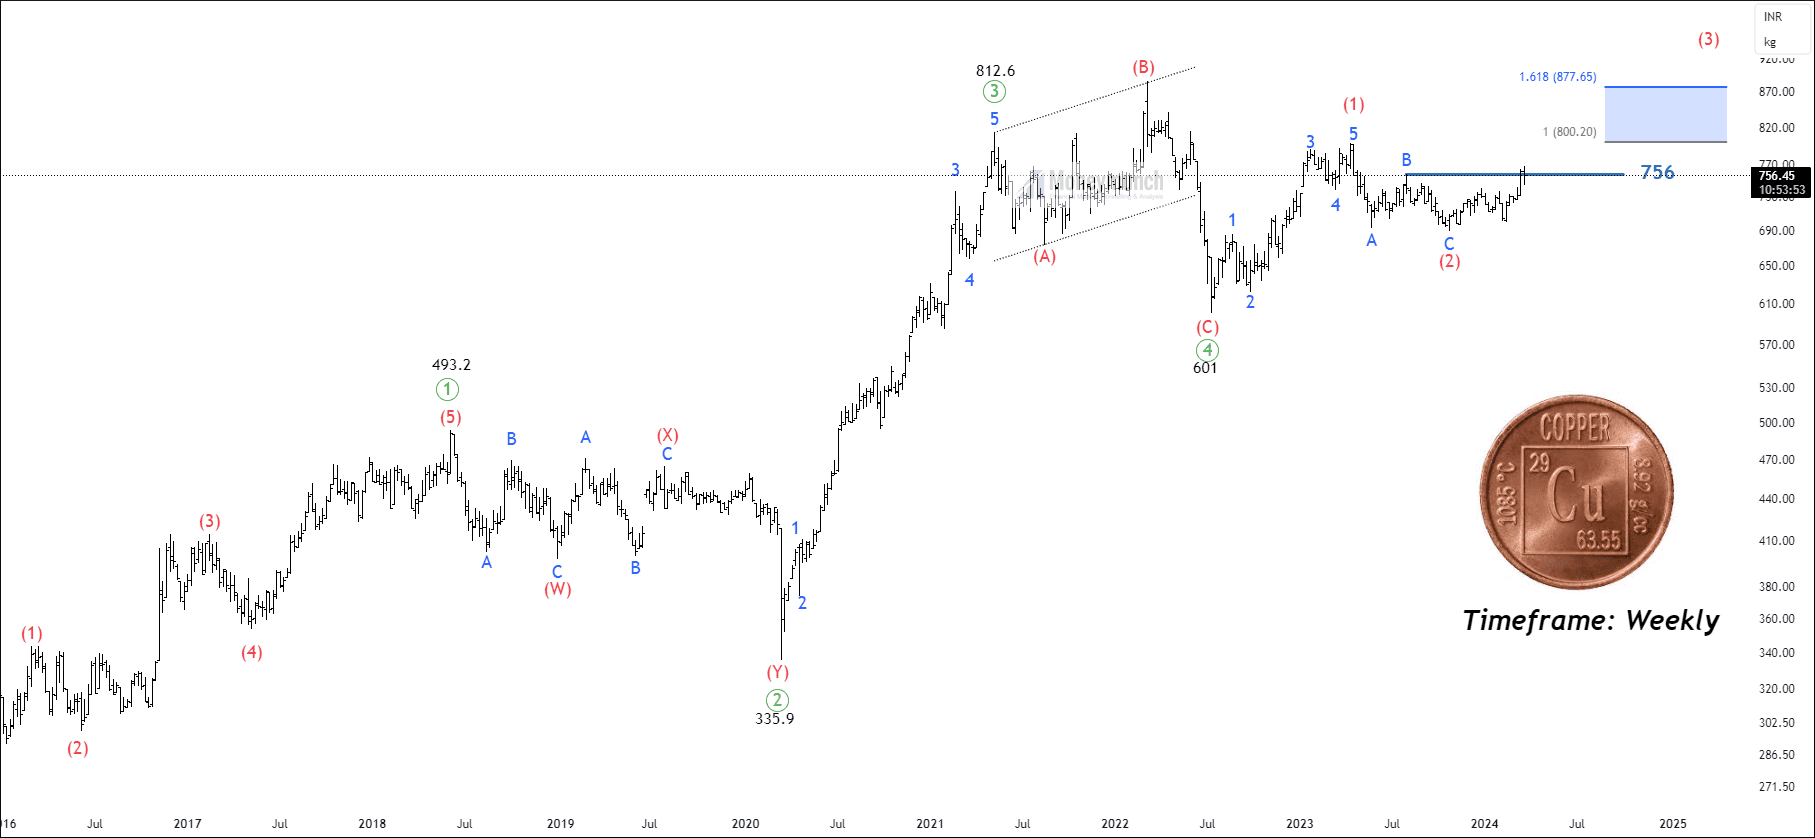
Sub-wave c of wave (2) of wave ((4)) occurred at 689.5. If the price breaks out wave B at 756, traders can trade for the following targets: 800 – 840 – 877+.
 AFTER
AFTER
MCX Copper – Trading Insights & Updates
Did you trade MCX Copper Wave Setup?
Click here: Long-Term View: IS MCX Copper Preparing For A Take-Off?
BEFORE
Sub-wave c of wave (2) of wave ((4)) occurred at 689.5. If the price breaks out wave B at 756, traders can trade for the following targets: 800 – 840 – 877+.
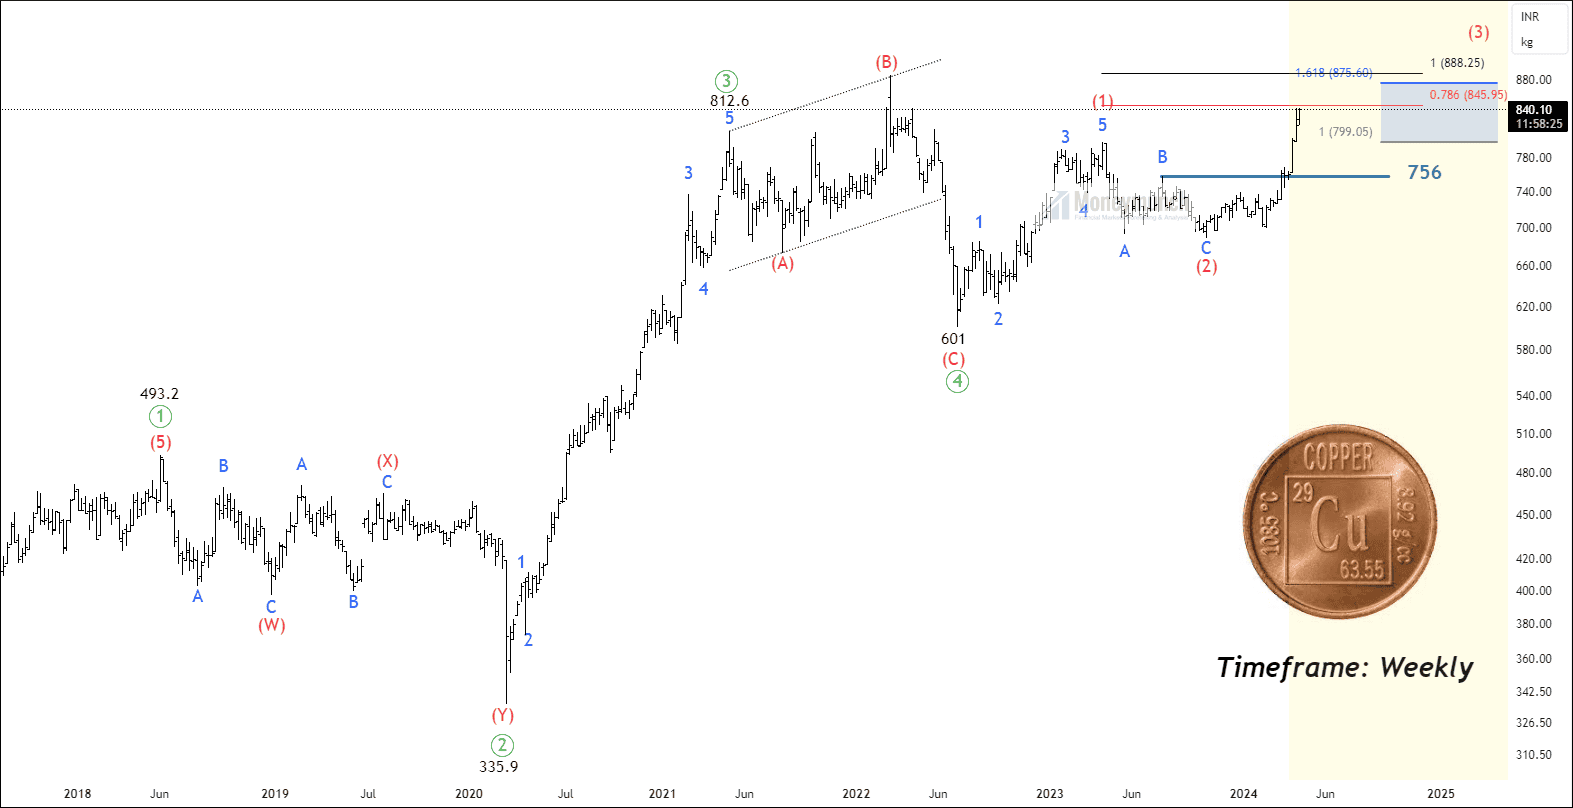
 AFTER
AFTER
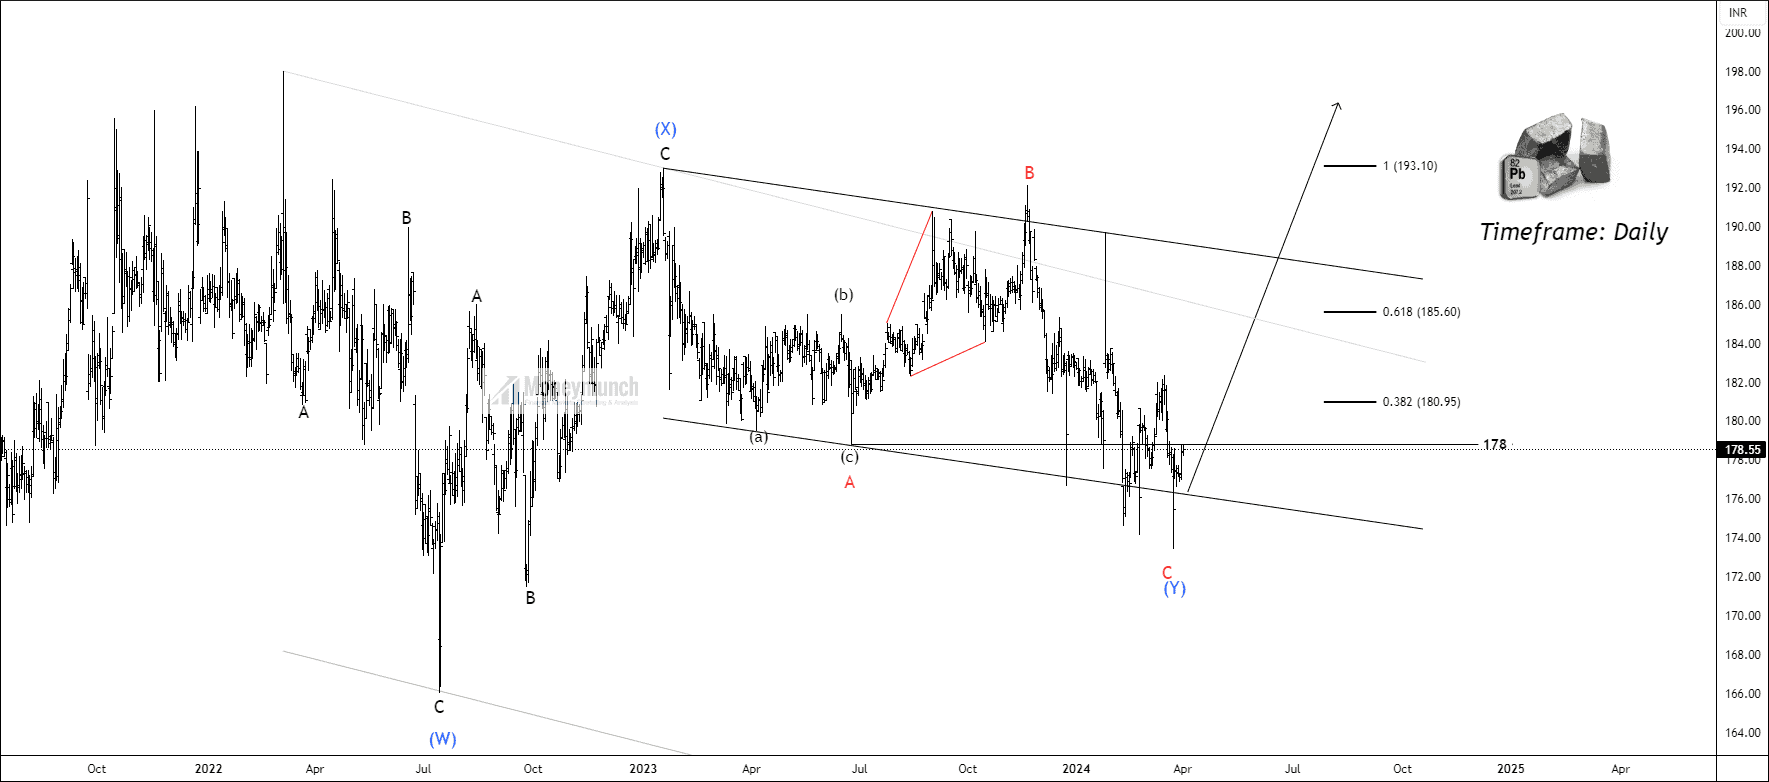
Is Lead Preparing for A Skyrocket?
MCX ZINC – Premium Setup
 Unlock This Article
Only subscribers can read the full article. Please login to read the entire article.
Get free MCX ideas, chart setups, and analysis for the upcoming session: Commodity Tips →
Have you any questions/feedback about this article? Please leave your queries in the comment box for answers.
Disclaimer: The information provided on this website, including but not limited to stock, commodity, and forex trading tips, technical analysis, and research reports, is solely for educational and informational purposes. It should not be considered as financial advice or a recommendation to engage in any trading activity. Trading in stocks, commodities, and forex involves substantial risks, and you should carefully consider your financial situation and consult with a professional advisor before making any trading decisions. Moneymunch.com and its authors do not guarantee the accuracy, completeness, or reliability of the information provided, and shall not be held responsible for any losses or damages incurred as a result of using or relying on such information. Trading in the financial markets is subject to market risks, and past performance is not indicative of future results. By accessing and using this website, you acknowledge and agree to the terms of this disclaimer.