Timeframe: Daily
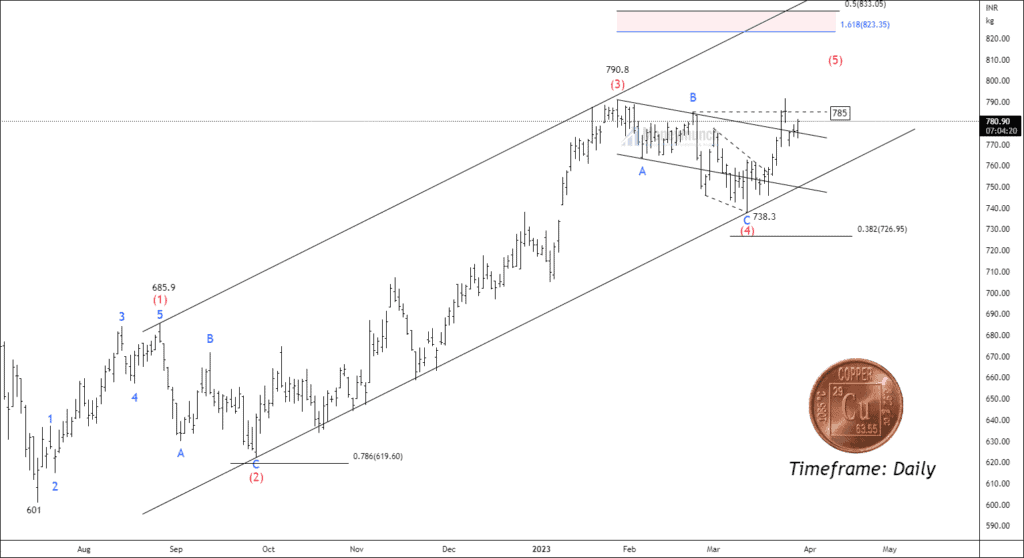
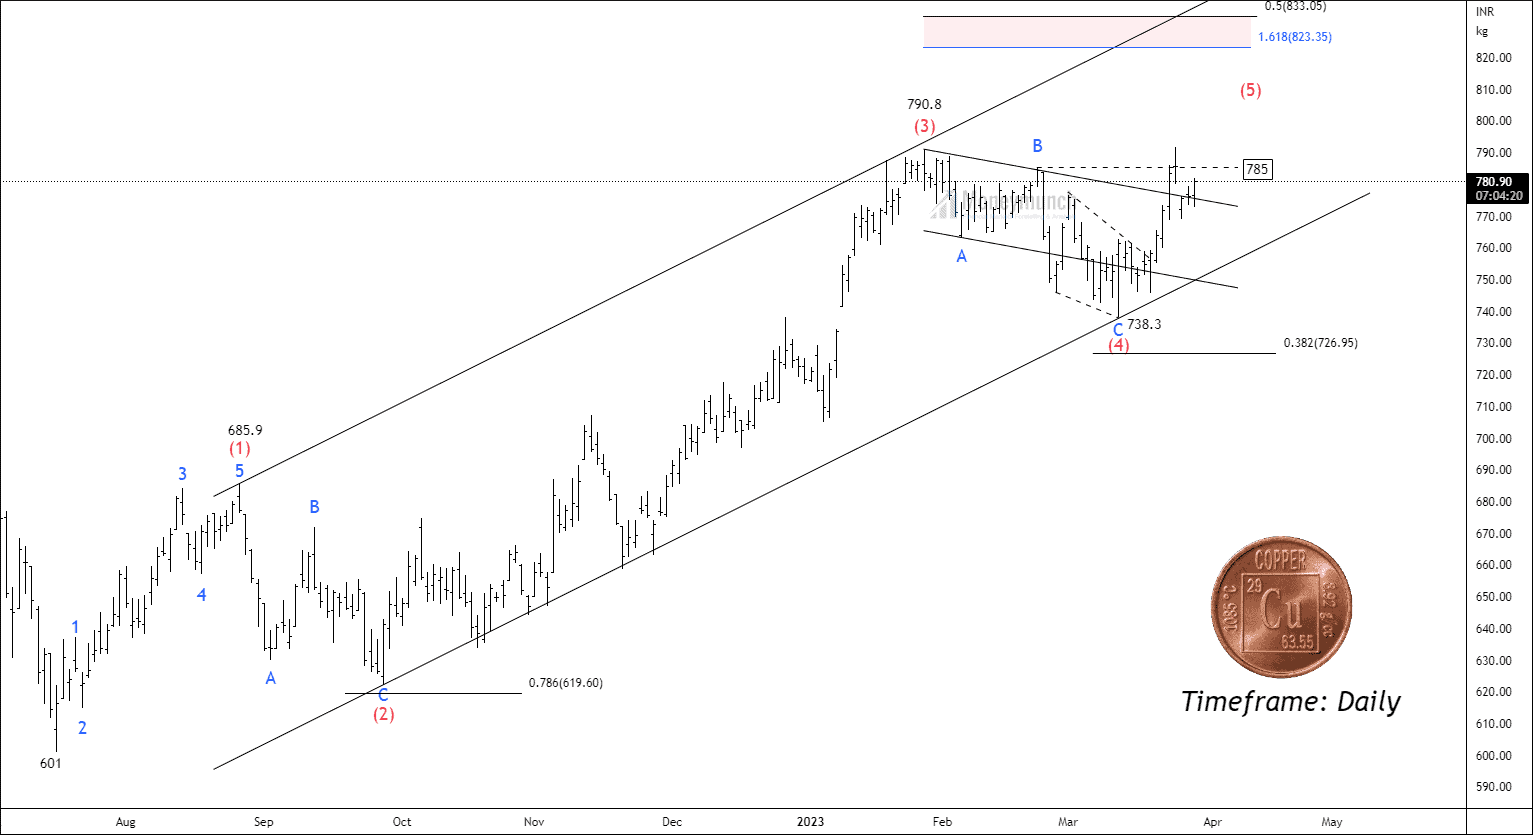
The MCX copper has initiated an impulsive cycle from 601 and has been forming this structure for over 36 weeks. At present, the price has completed the corrective wave (4) and is constructing sub-waves of the final wave (5) in the impulsive cycle. The current trend indicates that the bulls are controlling the market as Copper is trading above its 50/100/200 moving average band. Additionally, the Relative Strength Index (RSI) is above 58, which supports the strength of the price.
Fibonaaci relationship:
- Wave (2) retraced 61.8% of the Fibonacci retracement level of wave (1) at 622.05.
- Wave (4) retraced 38.2% of the Fibonacci retracement level of wave (3) at 738.3.
- Wave (3) extended by 2.618% of the Fibonacci extension level of wave (1) at 790.8.
- Wave (5) has the potential to extend by 0.5 of the Fibonacci extension level at 833.
- Wave (5) has the potential to extend up to 1.618% of the reverse Fibonacci level of wave (4) at 823.3.
According to the Elliott wave principle, a change in trend can only occur after the breakout of the previous corrective wave, which may be B, 2, or 4. Therefore, if the price remains above the B wave at 785, traders can consider trading towards the targets of 791- 809 – 821+. A bullish trend is deemed to be intact above wave B, but weak if it falls below the lower boundary of the base channel.
Get free MCX ideas, chart setups, and analysis for the upcoming session: Commodity Tips →
Have you any questions/feedback about this article? Please leave your queries in the comment box for answers.


Great insight.Thanks for the chart.