MCX Gold Measured Moves
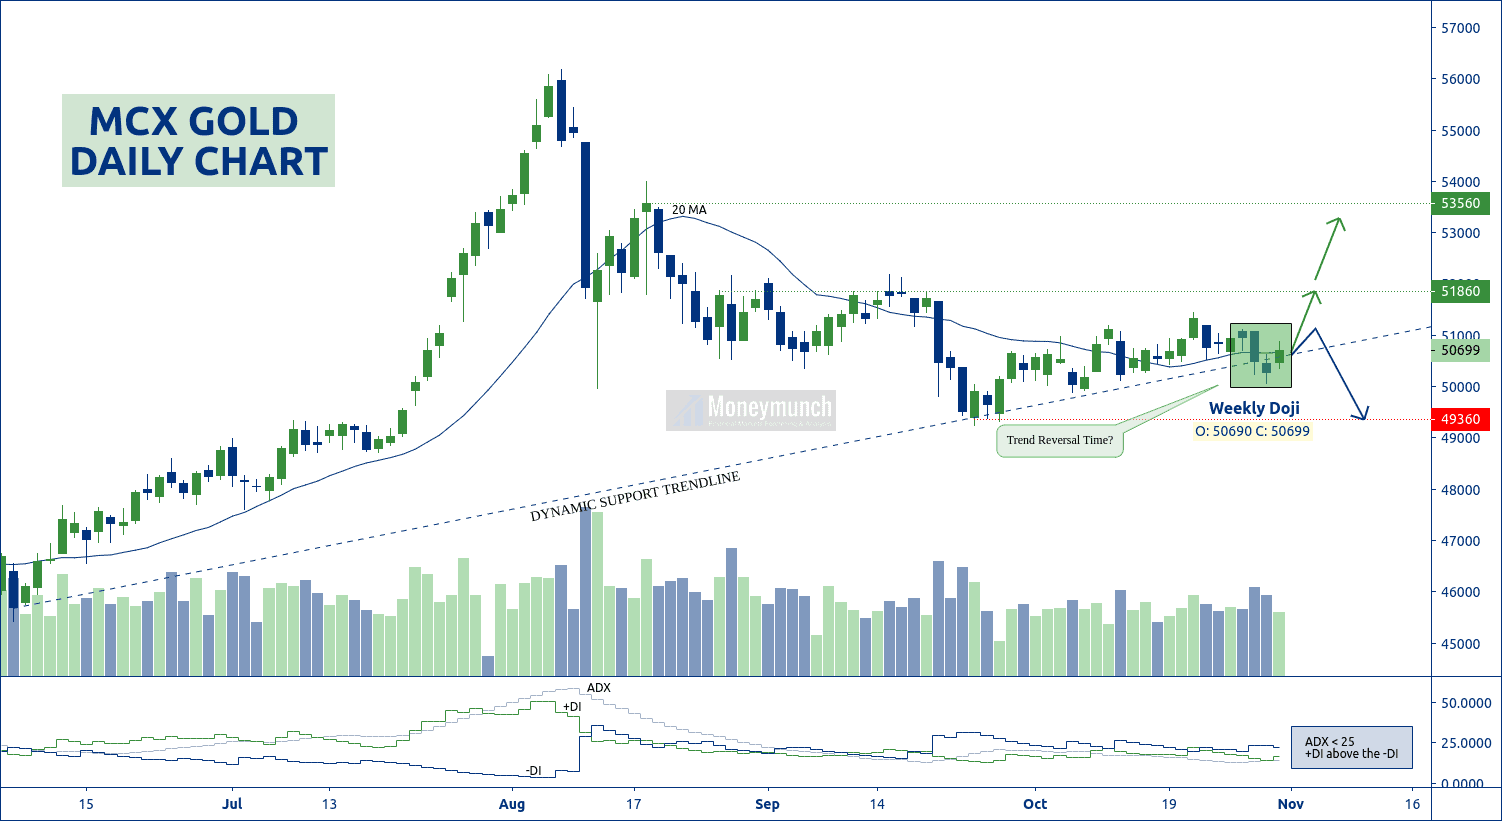
Gold has made a Doji in the weekly chart. It’s a direct sign of a reversal. And wherein ADX is less than 25 but +DI above the -DI. Additionally, the 20 MA line is trying to stay downside.
In short, DMI & MA is throwing a strong upward signal. Moreover, its volume is increasing. This week, we have chances to see gold prices above the 51860 levels. The day traders can follow the following targets:
51000 – 51360 – 51860+
And short-term investors can hold for 52000 – 53000 – 53560+ levels.
All you need to do is watch out for a dynamic support trendline. It should remain above it. Else, it will start falling. And that downfall for the levels of 50000 – 49600 – 49360.
Significant releases or events that may affect the movement of gold & crude oil:
Monday, Nov 02, 2020
- 11:00 – Gold Index
Tuesday, Nov 03, 2020
- 05:30 – U.S. Presidential Election
Wednesday, Nov 04, 2020
- 02:00 – U.S. API Weekly Crude Stock
- 21:00 – U.S. Crude Oil Inventories
Crude Oil Price Setting Up For A Downside Price Rotation
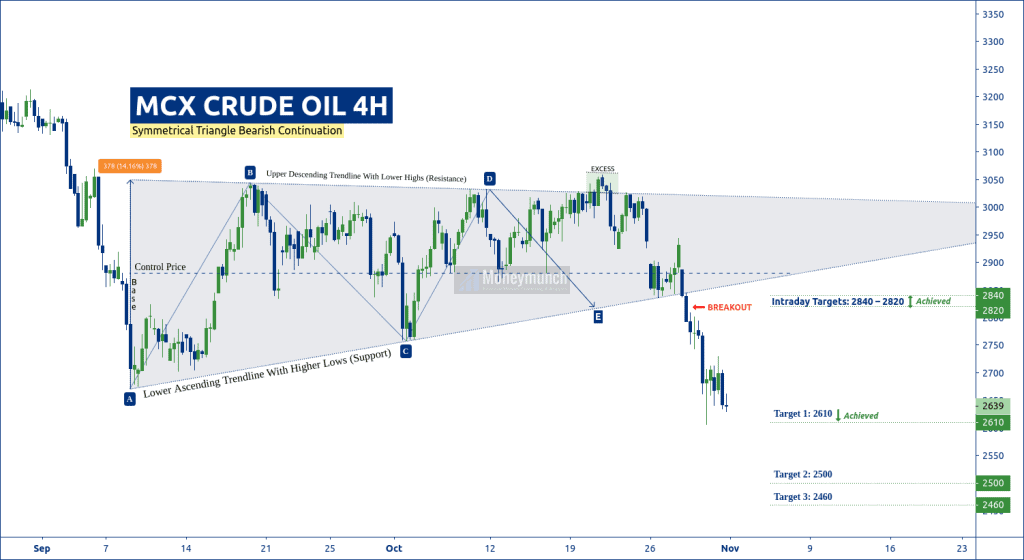
First, let’s talk about the previous update of crude oil . There, I have drawn the symmetrical triangle bearish pattern on the hourly chart of MCX’s crude oil.
I had written for the day traders, “…the last expected stop is at E. So, we may see crude oil at/below 2840 – 2820 level”.
THESE TARGETS HAS REACHED.
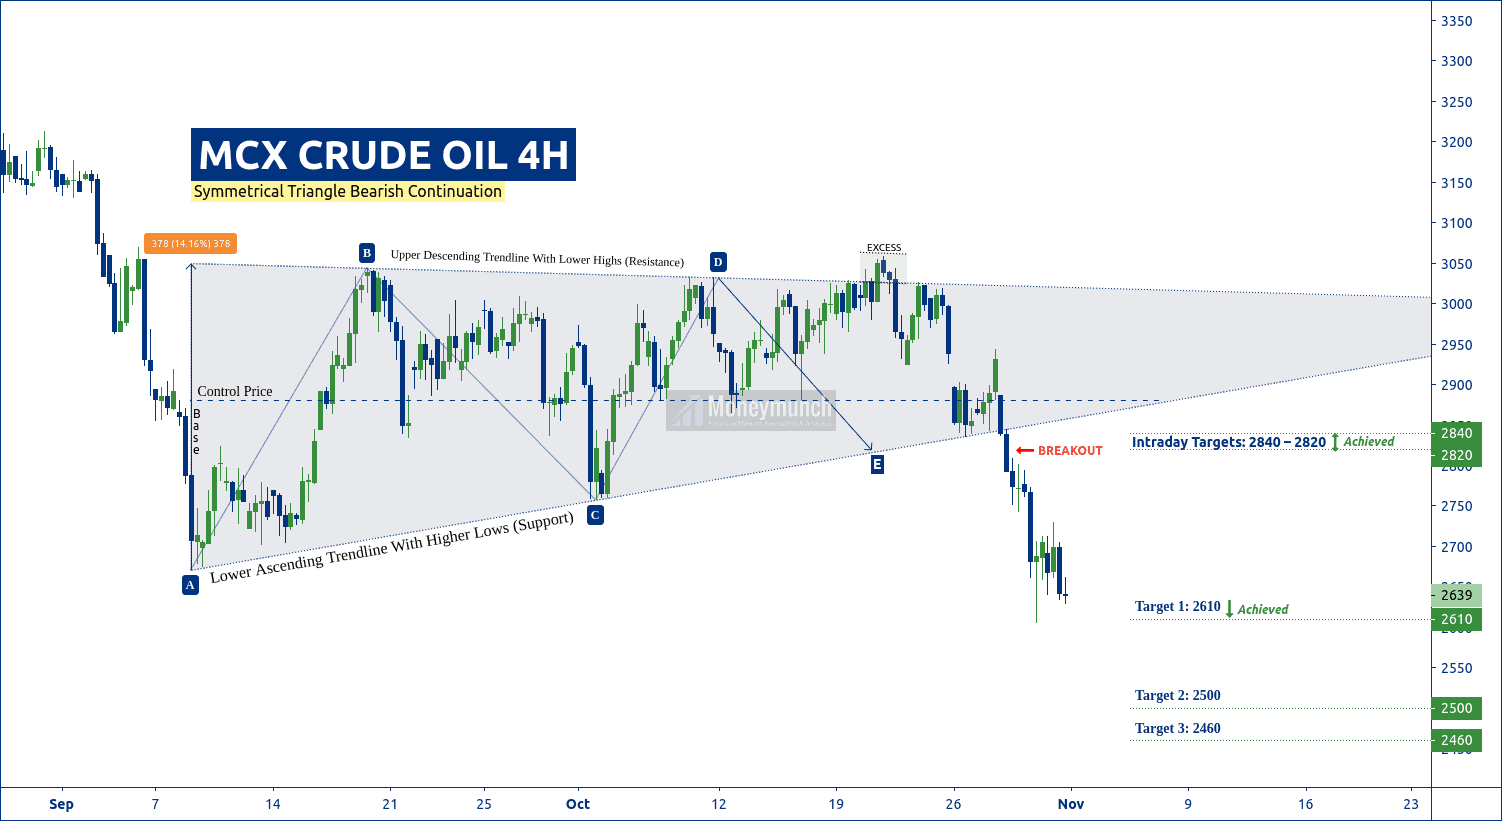
And for the short-term traders, I had written in bold words, “this symmetrical triangle base range is 378 points. So, the game will begin whenever crude oil will break out the triangle pattern . Downward breakout’s targets: 2610 – 2500 – 2460“.
Crude oil has touched the first target (2610) by making a low of 2606 level on 29 Oct ’20. Now let’s come to the point, will crude hit the second & last target or not?
CRUDE OIL DOWNSIDE BREAKOUT ALERT!
If crude oil prices break out the 2600 level, we will see 2540 – 2500 – 2460 levels before the weekend.
Please note that don’t sell it above the 2600 level.
To become a subscriber, subscribe to our free newsletter services. Our service is free for all.
Get free MCX ideas, chart setups, and analysis for the upcoming session: Commodity Tips →
Have you any questions/feedback about this article? Please leave your queries in the comment box for answers.


I follow your all the analysis reports thanks for sharing your great knowledge with us.
Superb analysis 👍
Sir what about silver? What do you say?
Sab ache se explain kiya he ache se samaj a raha he beginners ke liye b easy to understand 🙂🙂
I made a payment for 1 year plan sir I like your analysis and charts thank you
I’m following your tips from last 7 to 8 months. your charts are so interesting and easy to understand, targets are perfect. I am gonna pay for annual tomorrow. Thank you for free tips & reports Dev sir.
i have made payment of 28k for 3 years mcx plan via icici netbanking to your icici bank account. requested details send via email with screenshot of transaction number. nice crude tip thanks
Nice chart and brilliant analysis
Both the first targets achieved keep it up thnx for sharing
Two targets touched great!