Have you Traded our wave analysis on MCX COPPER?
Visit here: MCX Copper: Trend Forecasting Using Elliott Wave analysis
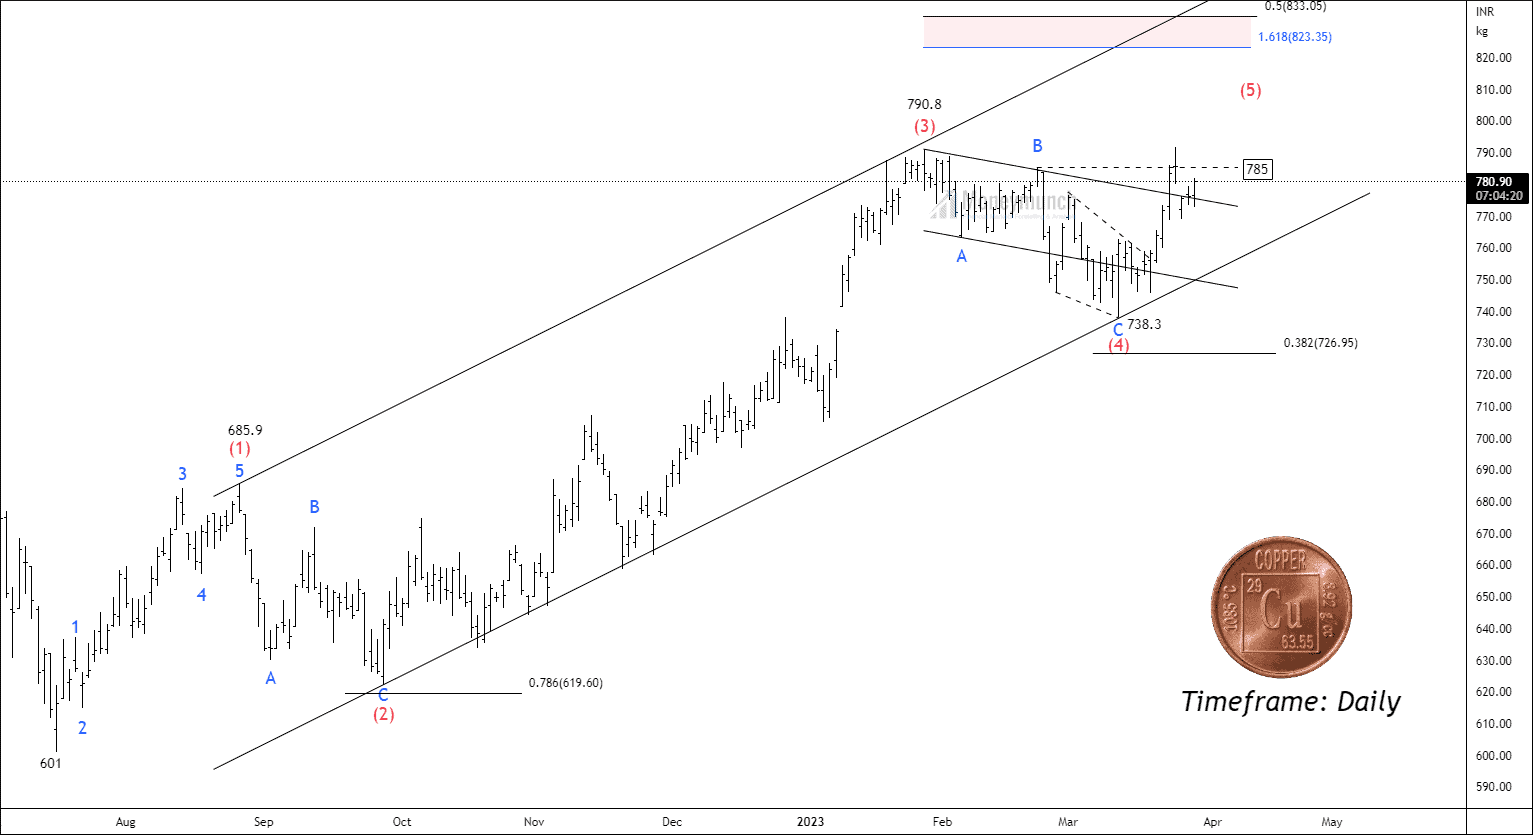 BEFORE
We have written clearly,”If the price remains above the B wave at 785, traders can consider trading towards the targets of 791- 809 – 821+.“
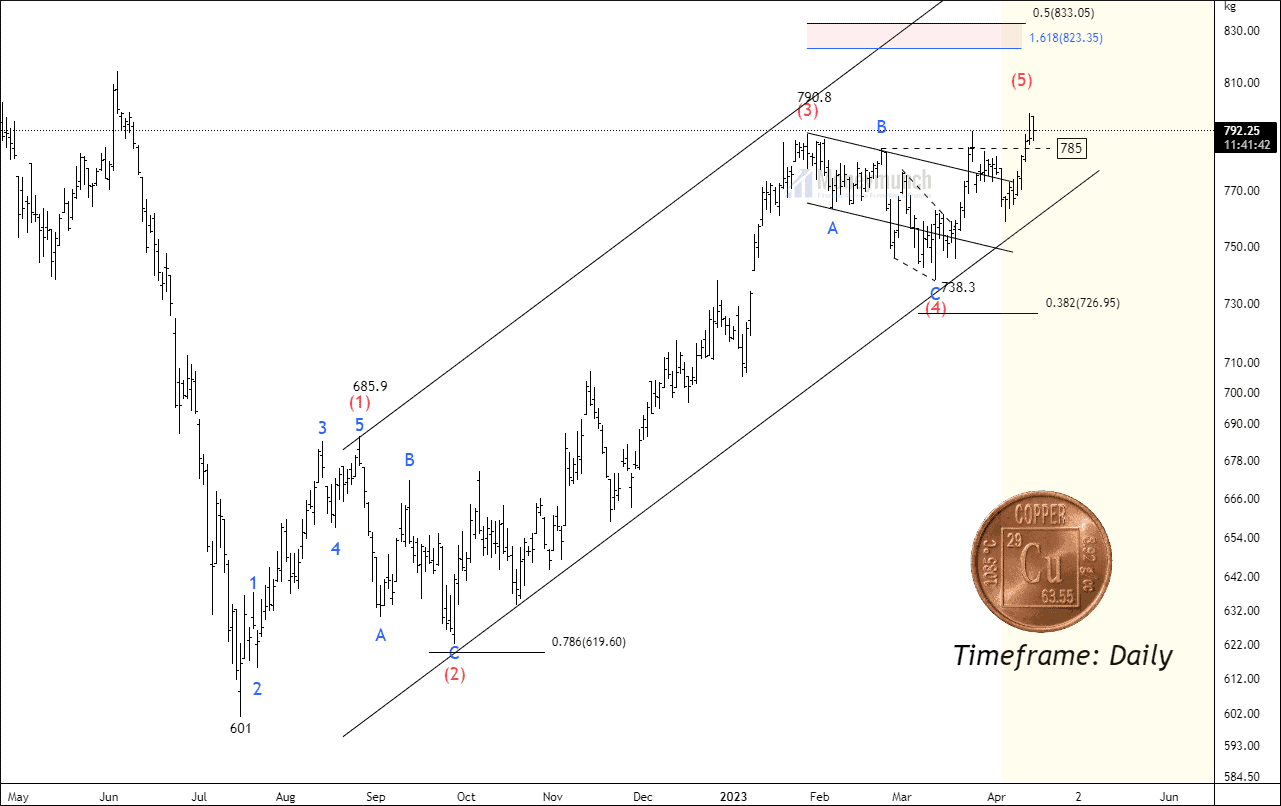 AFTER
AFTER
 Unlock This Article