NSE – UPL Will Retests Support Trendline & Boom!!!

free nse UPL stocks tips chart

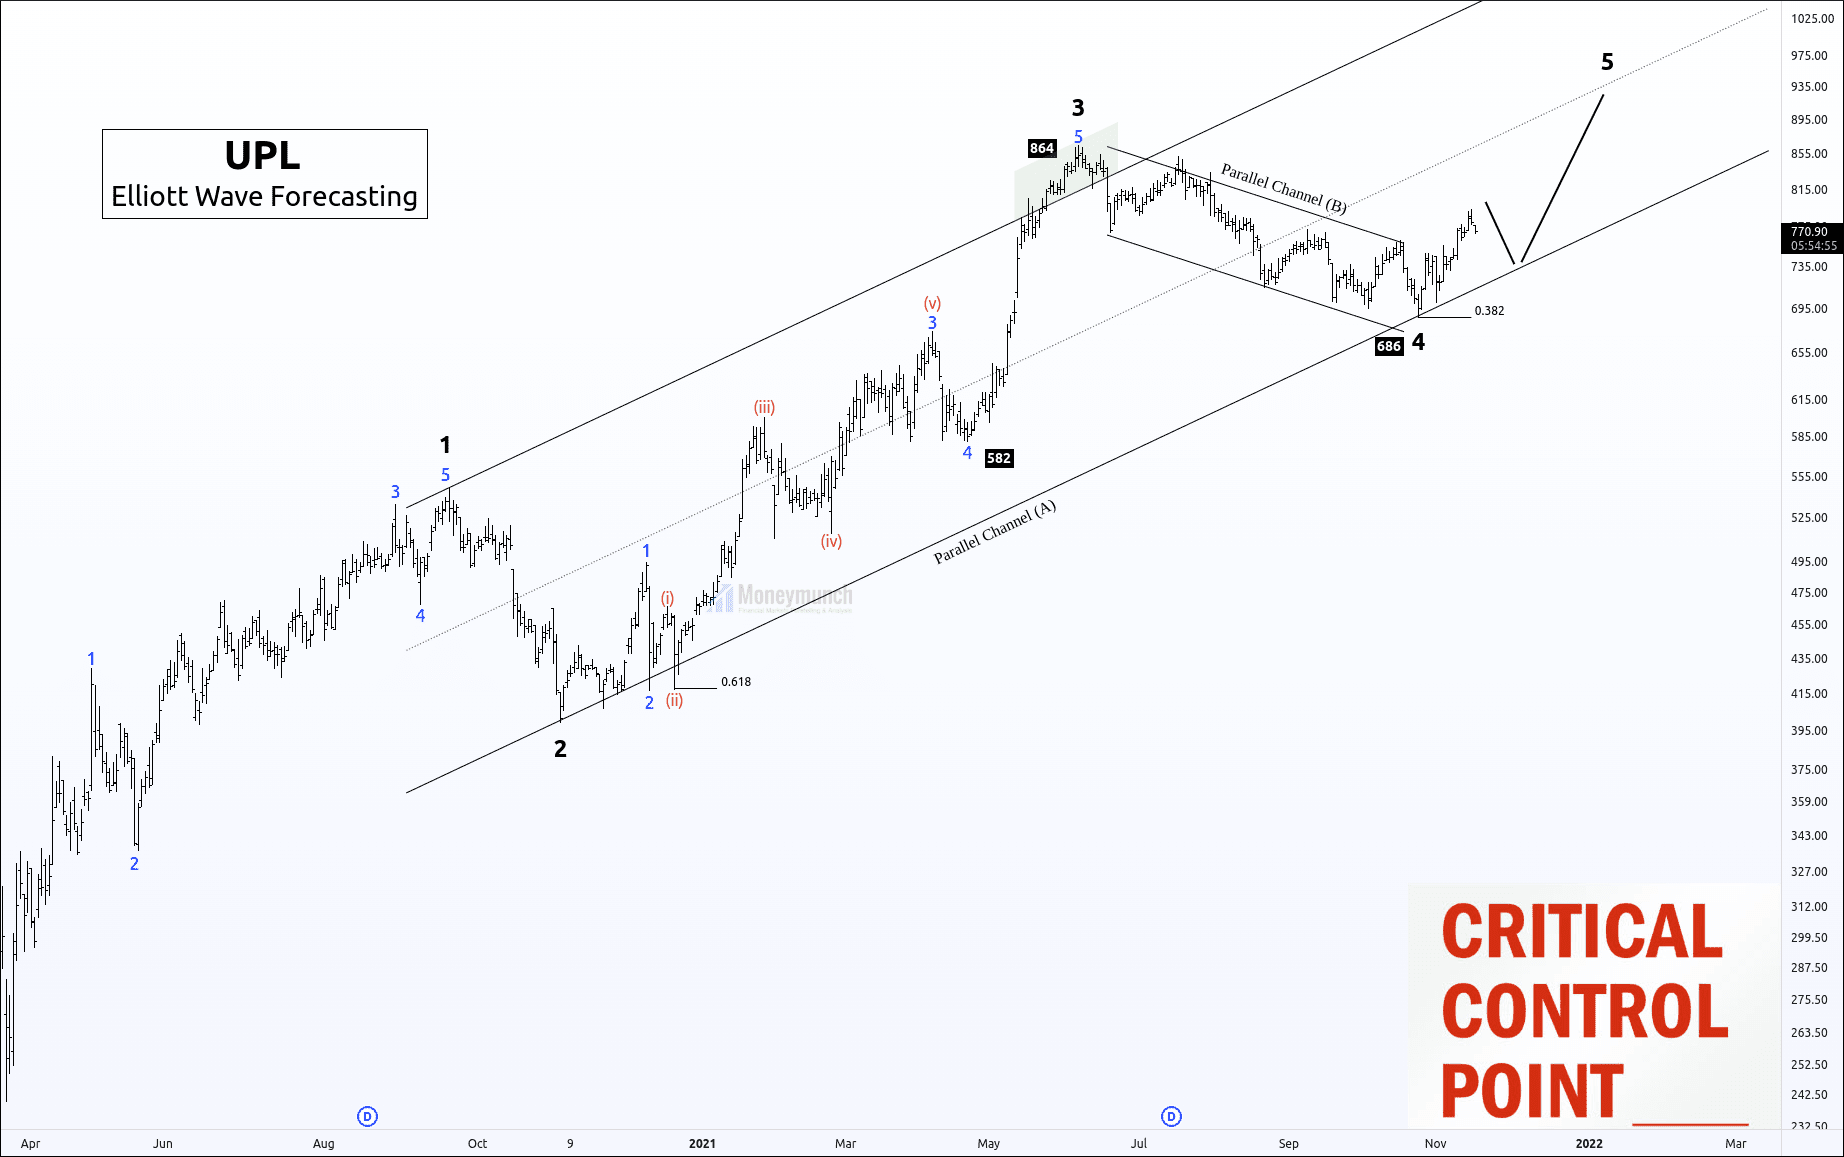
UPL is forming impulsive wave 5. Price was having complex correction of the wave 4. And wave 4 retraced 0.382% of wave 3, and the price increased sharply.

The price target for UPL is 964 because wave ((5)) ends at 161.8% of wave ((4)). Hence, the buyers can initiate the long position on a pullback.

If you are not a swing trader, you find sub-waves on smaller timeframes. To become a subscriber, subscribe to our free newsletter services. Our service is free for all.

Continue reading

Nifty Can Take Two Steps Back Before Skyrocketing

free nifty fut stocks tips & chart

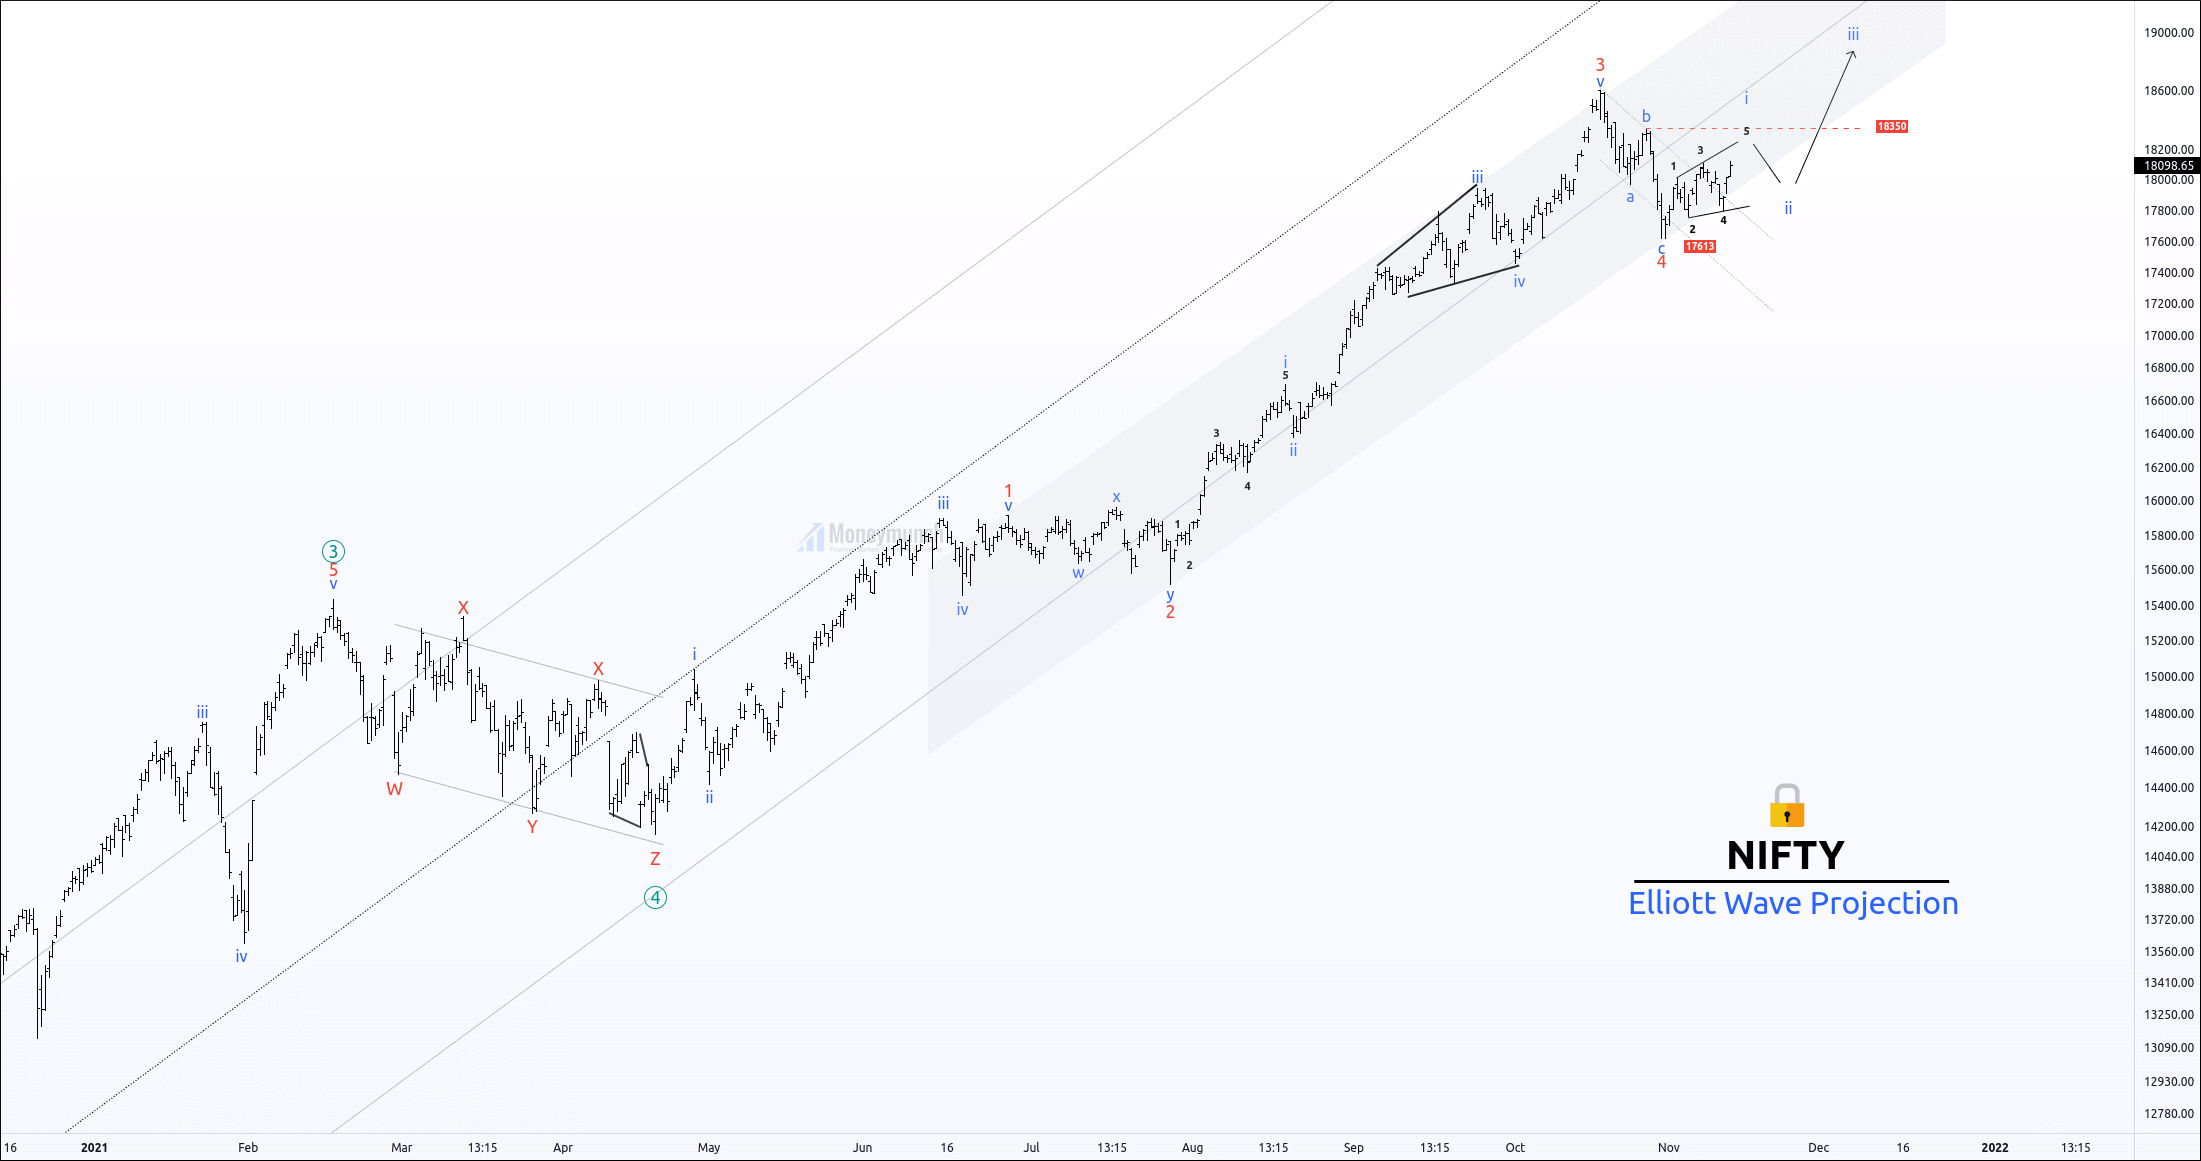
This week nifty may break 18350, and this level will increase high buying pressure.

The above chart shows that nifty seems price is forming a leading diagonal. Moreover, wave 5 is the ending point of the leading diagonal.

And completion of wave ‘i’ the wave ‘ii’ will take place. The wave ‘ii’ is corrective. So the day traders can initiate buy position there. It’s a golden opportunity because of moderated risk here.

Safe intraday traders can enter at the breakout of wave i. This point is also initiating an opportunity. If the acceleration phase is sturdy, then It can hit 19200.

Please note that wave ‘2’ can never overlap the starting point of wave ‘1’.

To become a subscriber, subscribe to our free newsletter services. Our service is free for all.

Continue reading

Crude Oil Elliott Wave Cycles Point More Upside

free commodity crudeoil daily chart tips

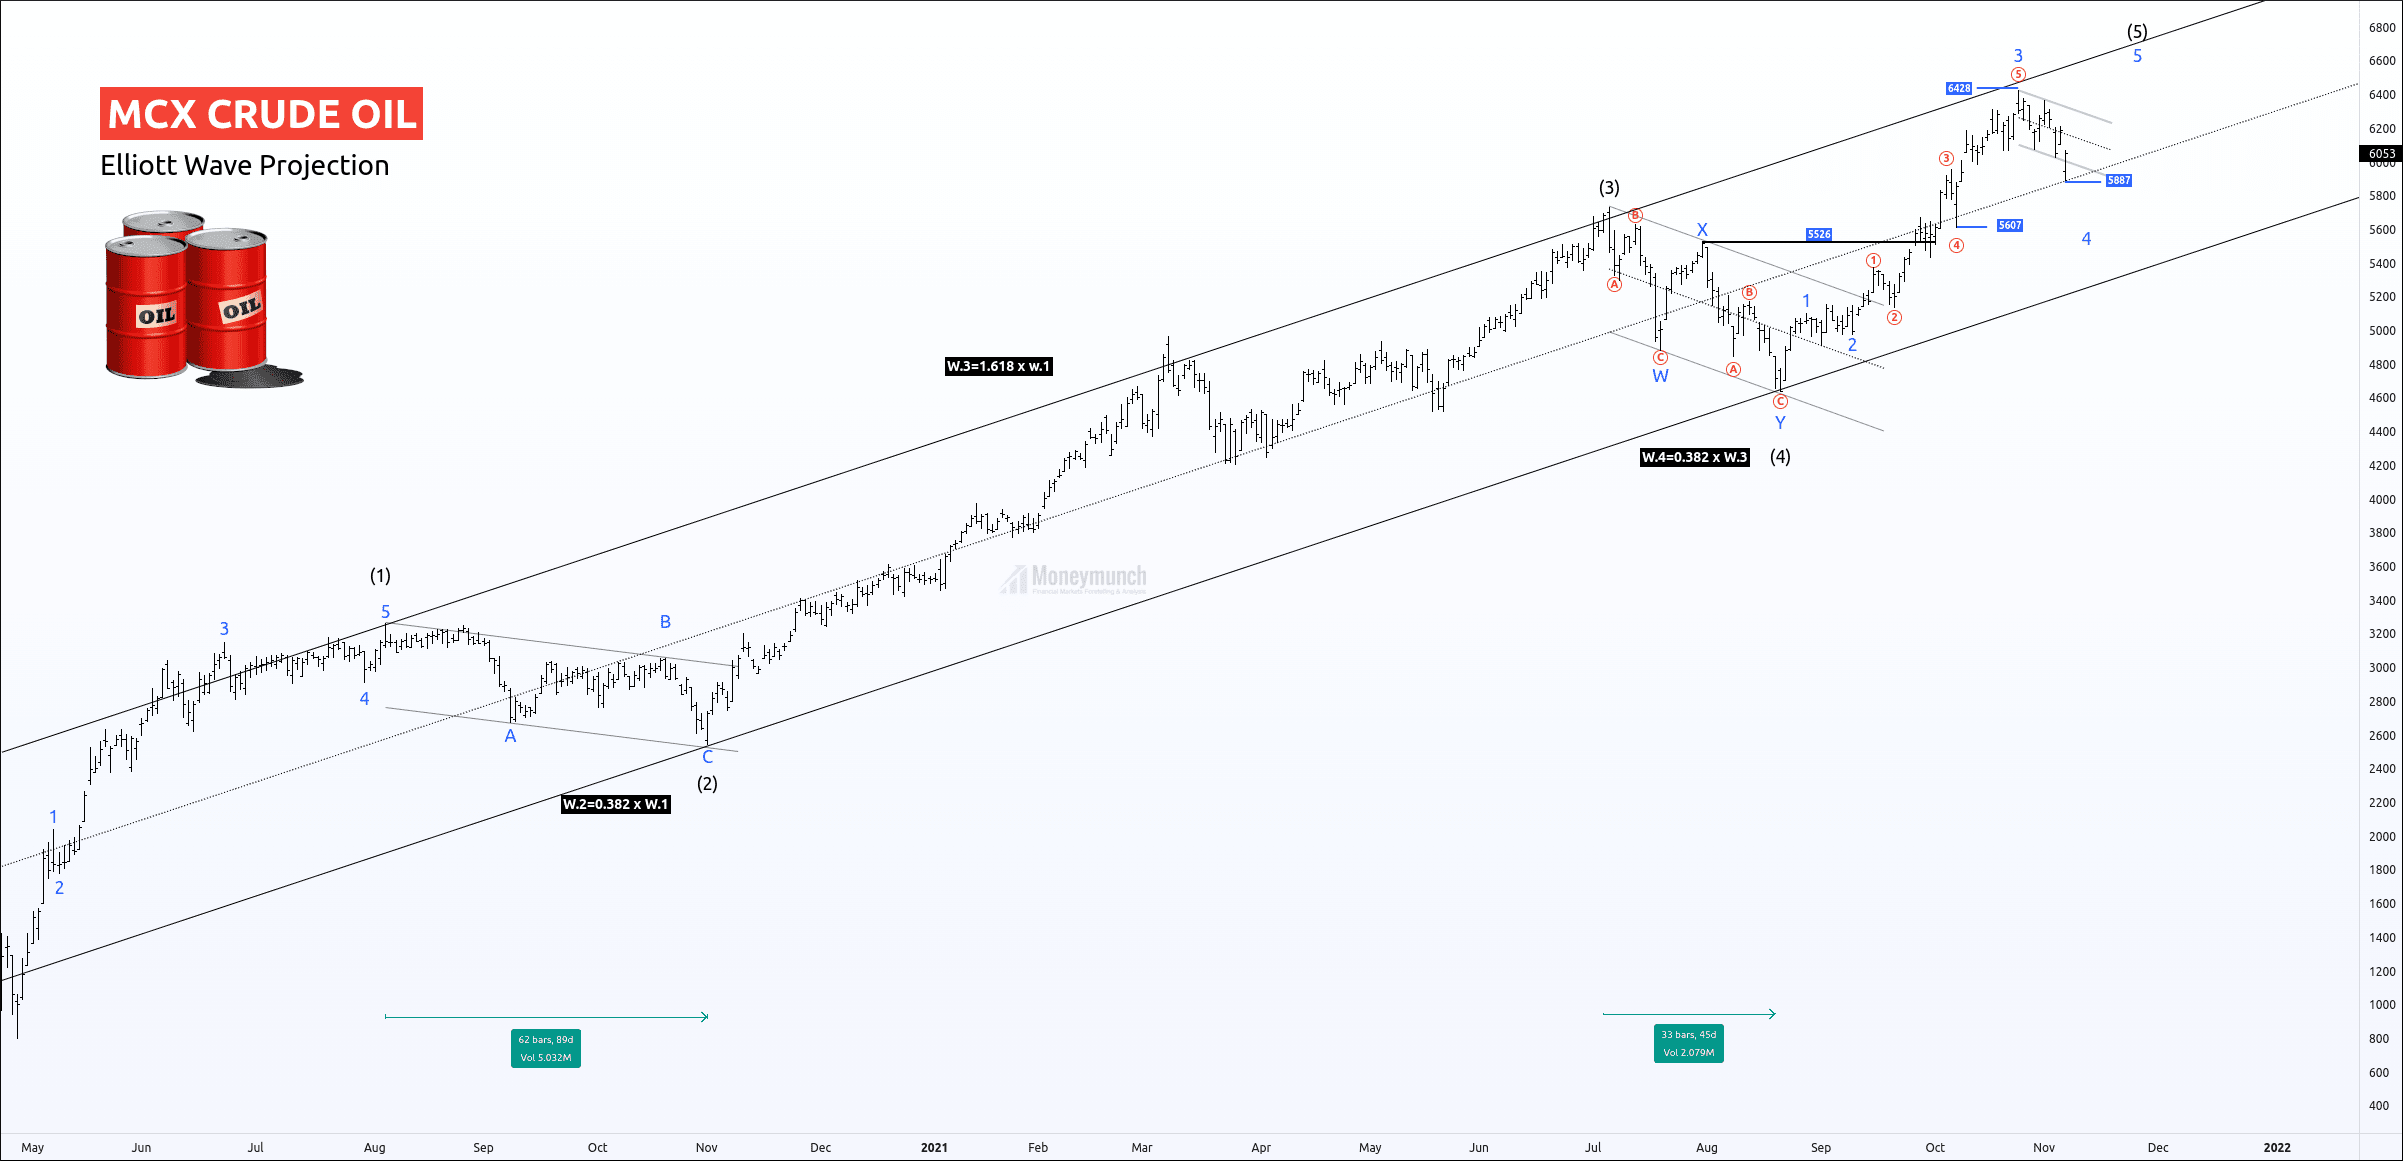
Price had made an extreme low at 795 on 20 Apr ’20.
It had started a quick recovery after an inviolable bottom-out. Due to bearish sentiments and no evidence of the verified bottom, it had constructed 2nd wave correction. The second wave retraced 38.2% of wave 1, which indicates a sturdy bull trend is ahead!

The acceleration phase lasted for 246 days and, the Fibonacci extension of wave 3 was 161.8% of the wave.
The public participation increased when the price had broken up the high of the first wave. It has the signal for bulls that crude was likely to make a new high.

After the acceleration phase, the price has corrected the bull phase with a double zigzag. It had retraced 38.2% of wave 3.
This correction was sharp in comparison with 2nd wave.

According to the above chart,
Wave 2 has taken 89 trading sessions to correct wave 1.
Wave 4 has taken 45 trading sessions to correct wave 3.

Wave 4 was a surprising disappointment for the bull traders.

Here, wave 3 is not a power extended because it hadn’t moved across wave 1.618% of wave 1.

According to the Elliott wave principle, commodities are more often extending at the 5th wave.

Currently, the price has made a new high of 6428.
Price has entered the corrective phase.
It is constructing the 4th sub-wave of the impulsive wave ((5)).

There are two possibilities,
1. If the price breaks the parallel channel, we can expect 50% to 61.8% retracement for wave 4. Be aware of the fake breakout!
Remember, entry is also not possible without an exact reversal signal.
Caution: Wave 4 can never overlap the starting point of wave 1.

2. Price is on the control line of the base channel.
The safe trader can enter the buying position when price breaks the wave B.

To become a subscriber, subscribe to our free newsletter services. Our service is free for all.

Continue reading

NSE – Apollo Hospital & ESCORTS Tips Updates

free nse stocks ESCORTS chart tips elliottwave

Bull Traders Are Preparing For The Rally In ESCORTS

Click the below link to read ESCORTS Trading Tips Report
ESCORTS, Apollo, & Tech Mahindra – Tips & Updates

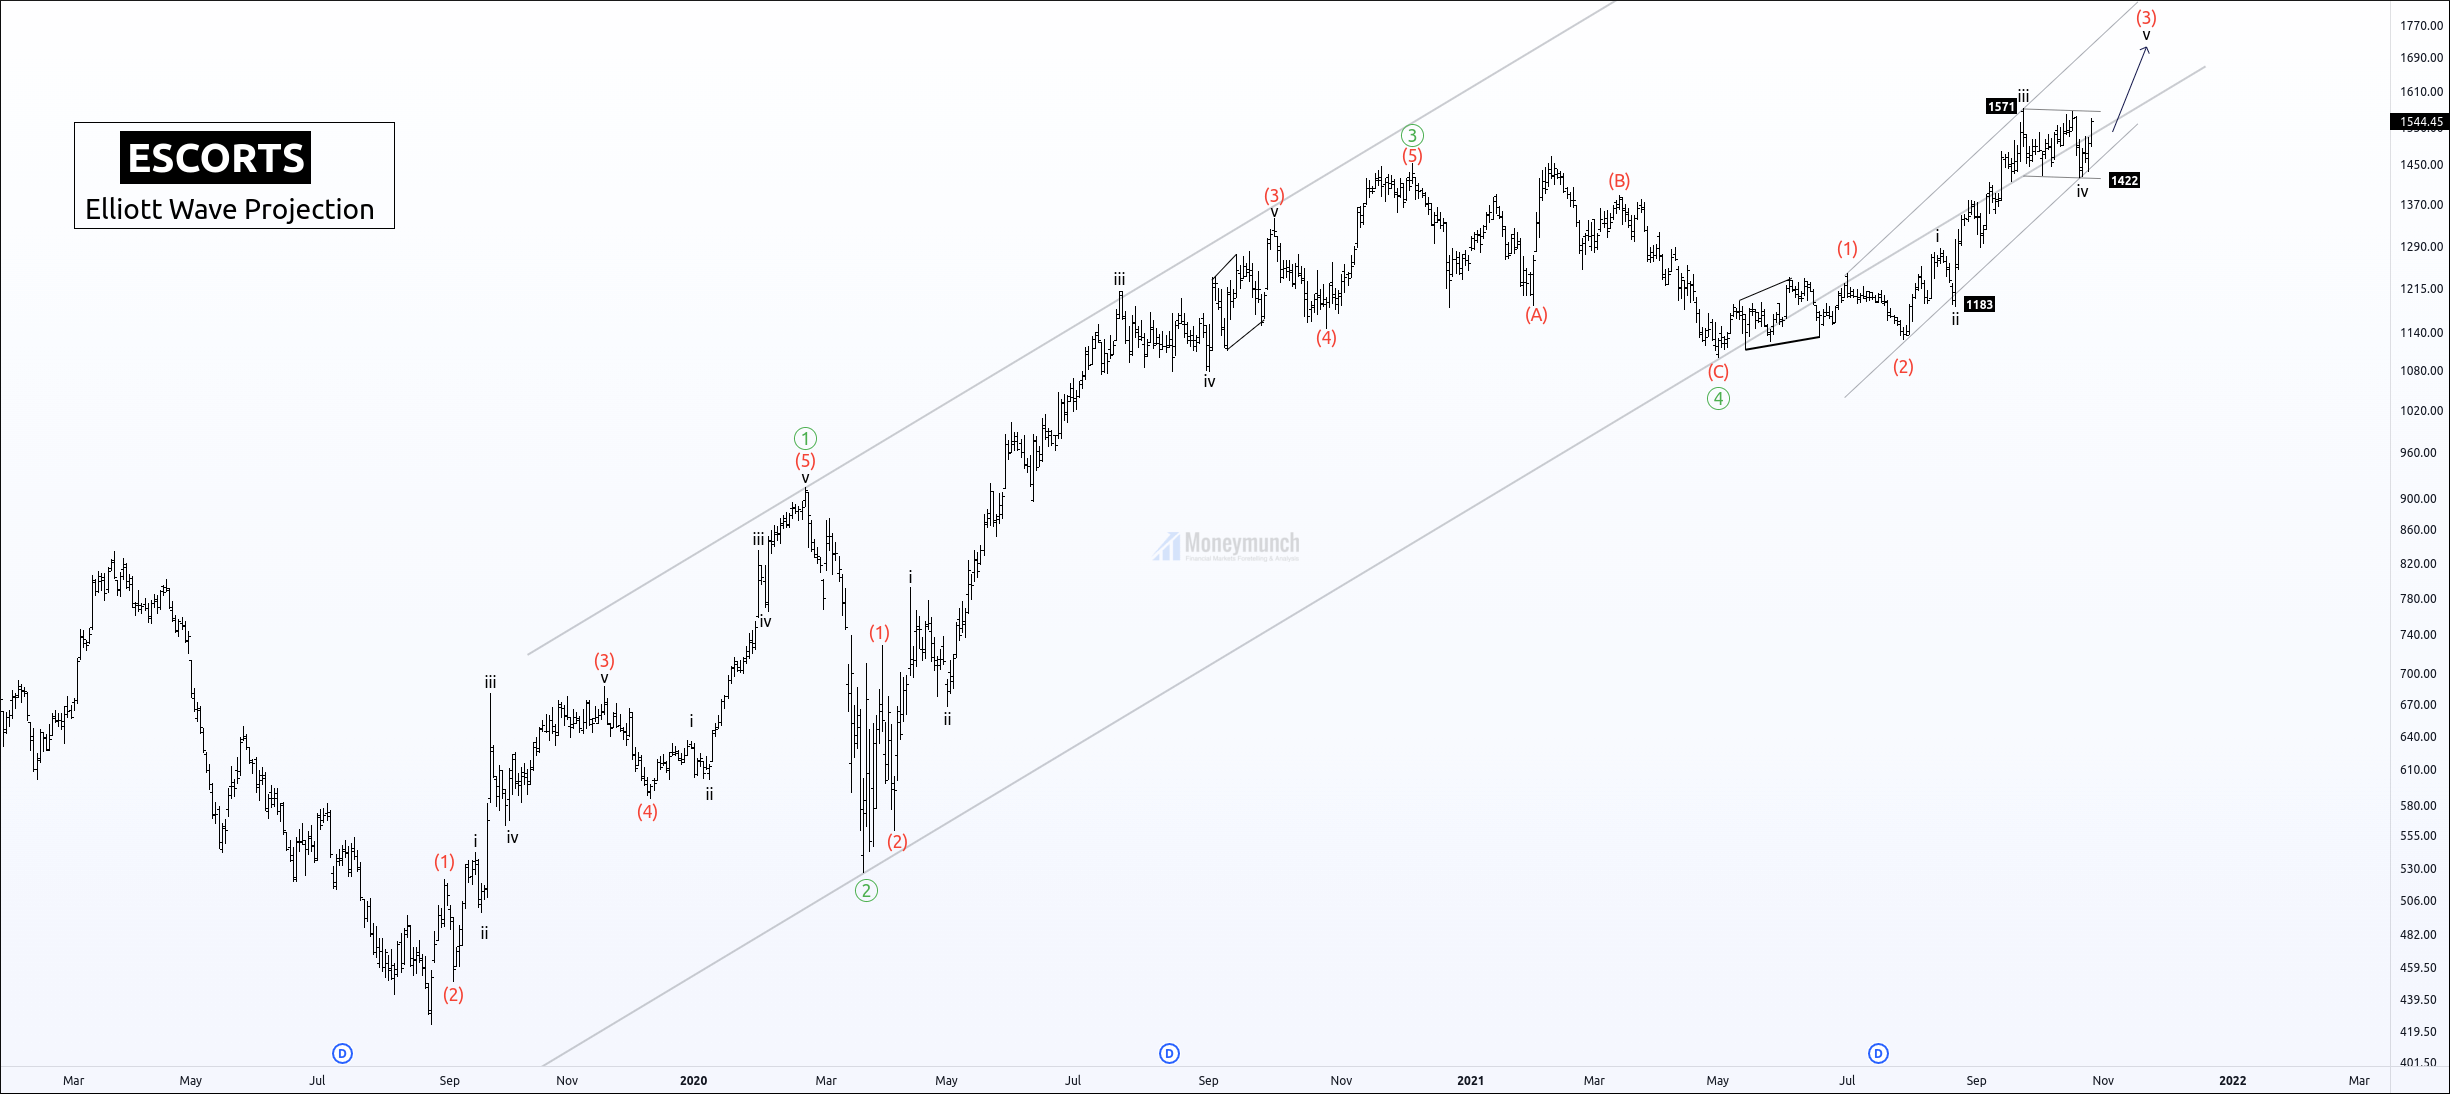
I had written, “ESCORTS has completed the corrective structure. If it gives an upward breakout, our targets will be 1576-1630-1706-1748“.

It has made a high of 1666 yesterday and touched the second target.

Flash Update: Apollo Hospital Call – Click here
Apollo hospital has made a high of 4395, which is close to the 2nd target of 4400.

To become a subscriber, subscribe to our free newsletter services. Our service is free for all.
Continue reading

A Complete Report of the Bank Nifty

Before I start, I recommend you to read the following article:
Is Bank Nifty Forming An Ending Diagonal? (September 21, 2021)

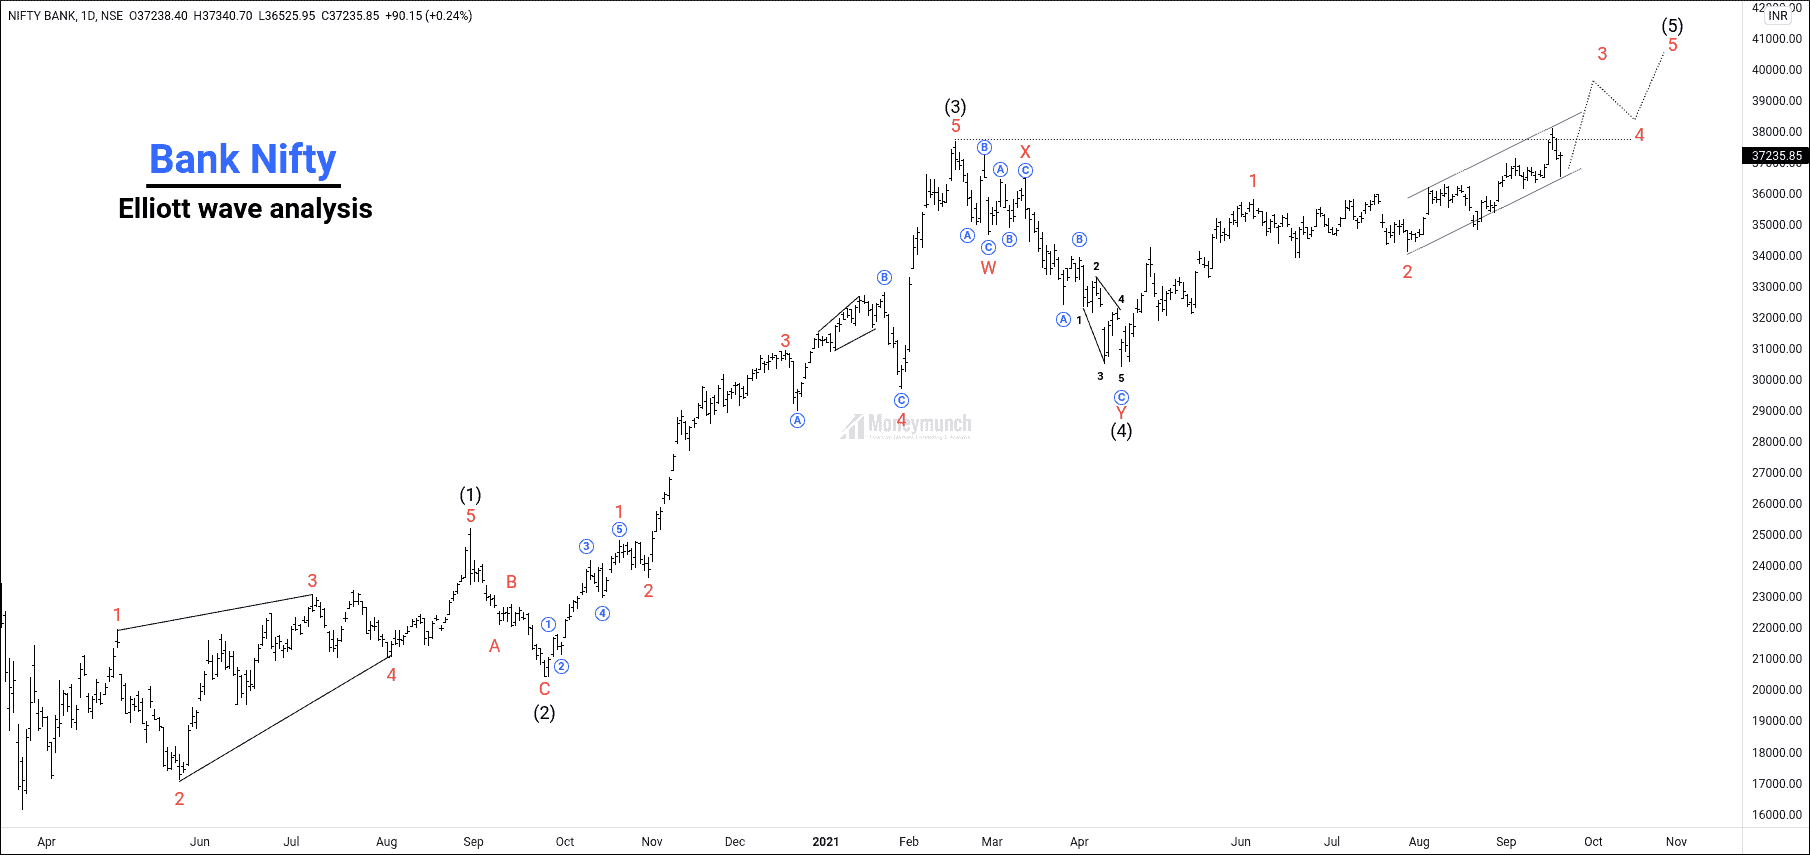
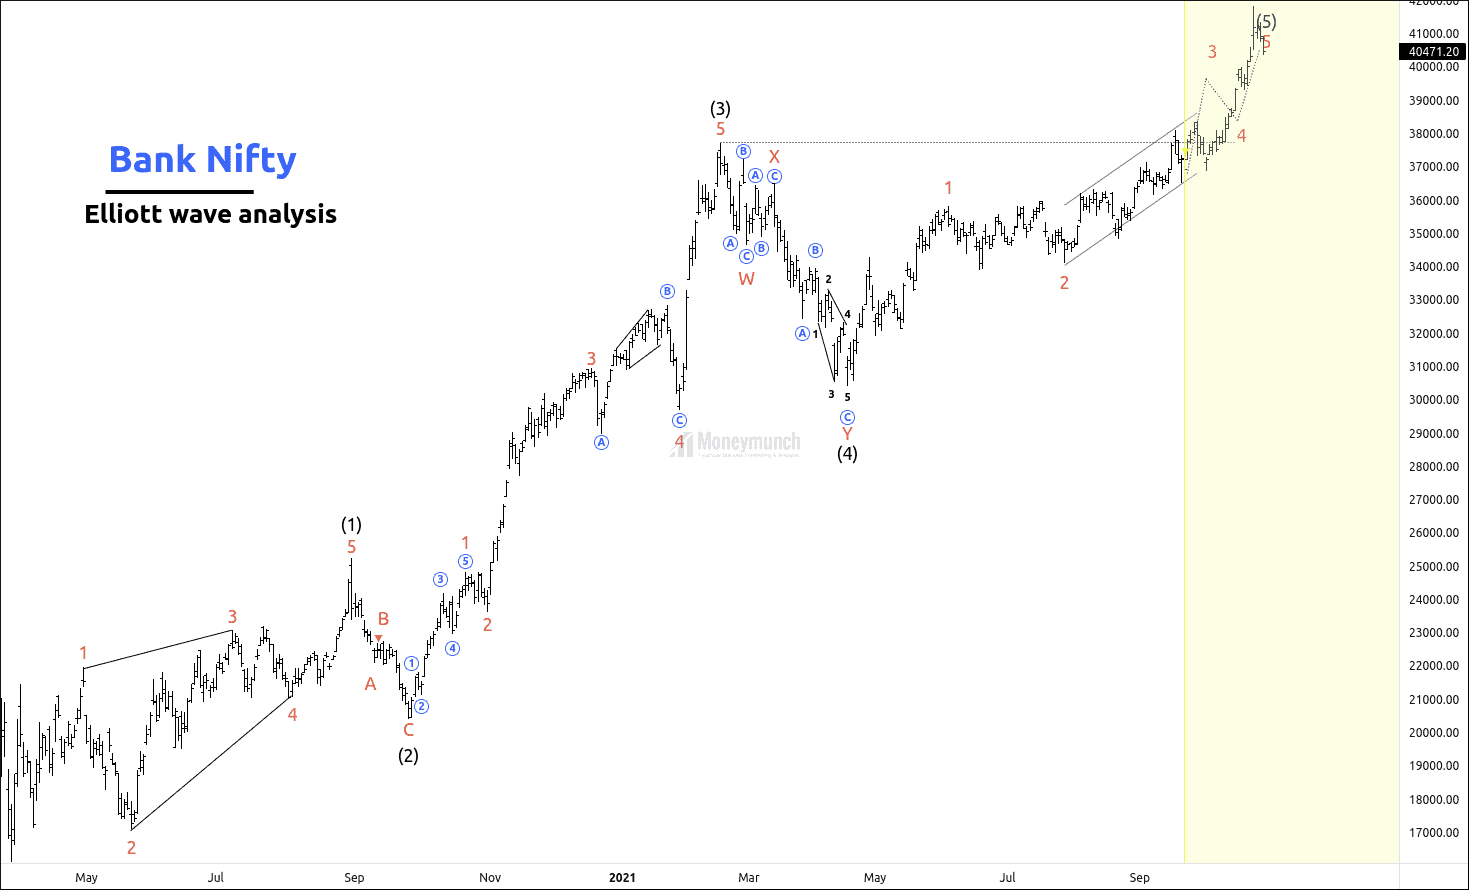
Wherein you can find Elliott Wave projection on Bank Nifty daily timeframe’s chart. See below chart:

free nse bank nifty daily chart tips

Has Bank Nifty concluded the 5th wave by making a high of 41829.6? Look at the below chart:

free nse Bank Nifty results & tips

Bank Nifty price is trying to shift at the support trendline of mid-April to June.

  • Has it created A (A B C correction) by making a low of 38426.65?
  • Or is it the sub-wave (4) of wave 4?

Look at the below chart to find correction possibilities:

To become a subscriber, subscribe to our free newsletter services. Our service is free for all.

Continue reading

Last Warning to NIFTY Sellers

free nse nifty daily chart tips

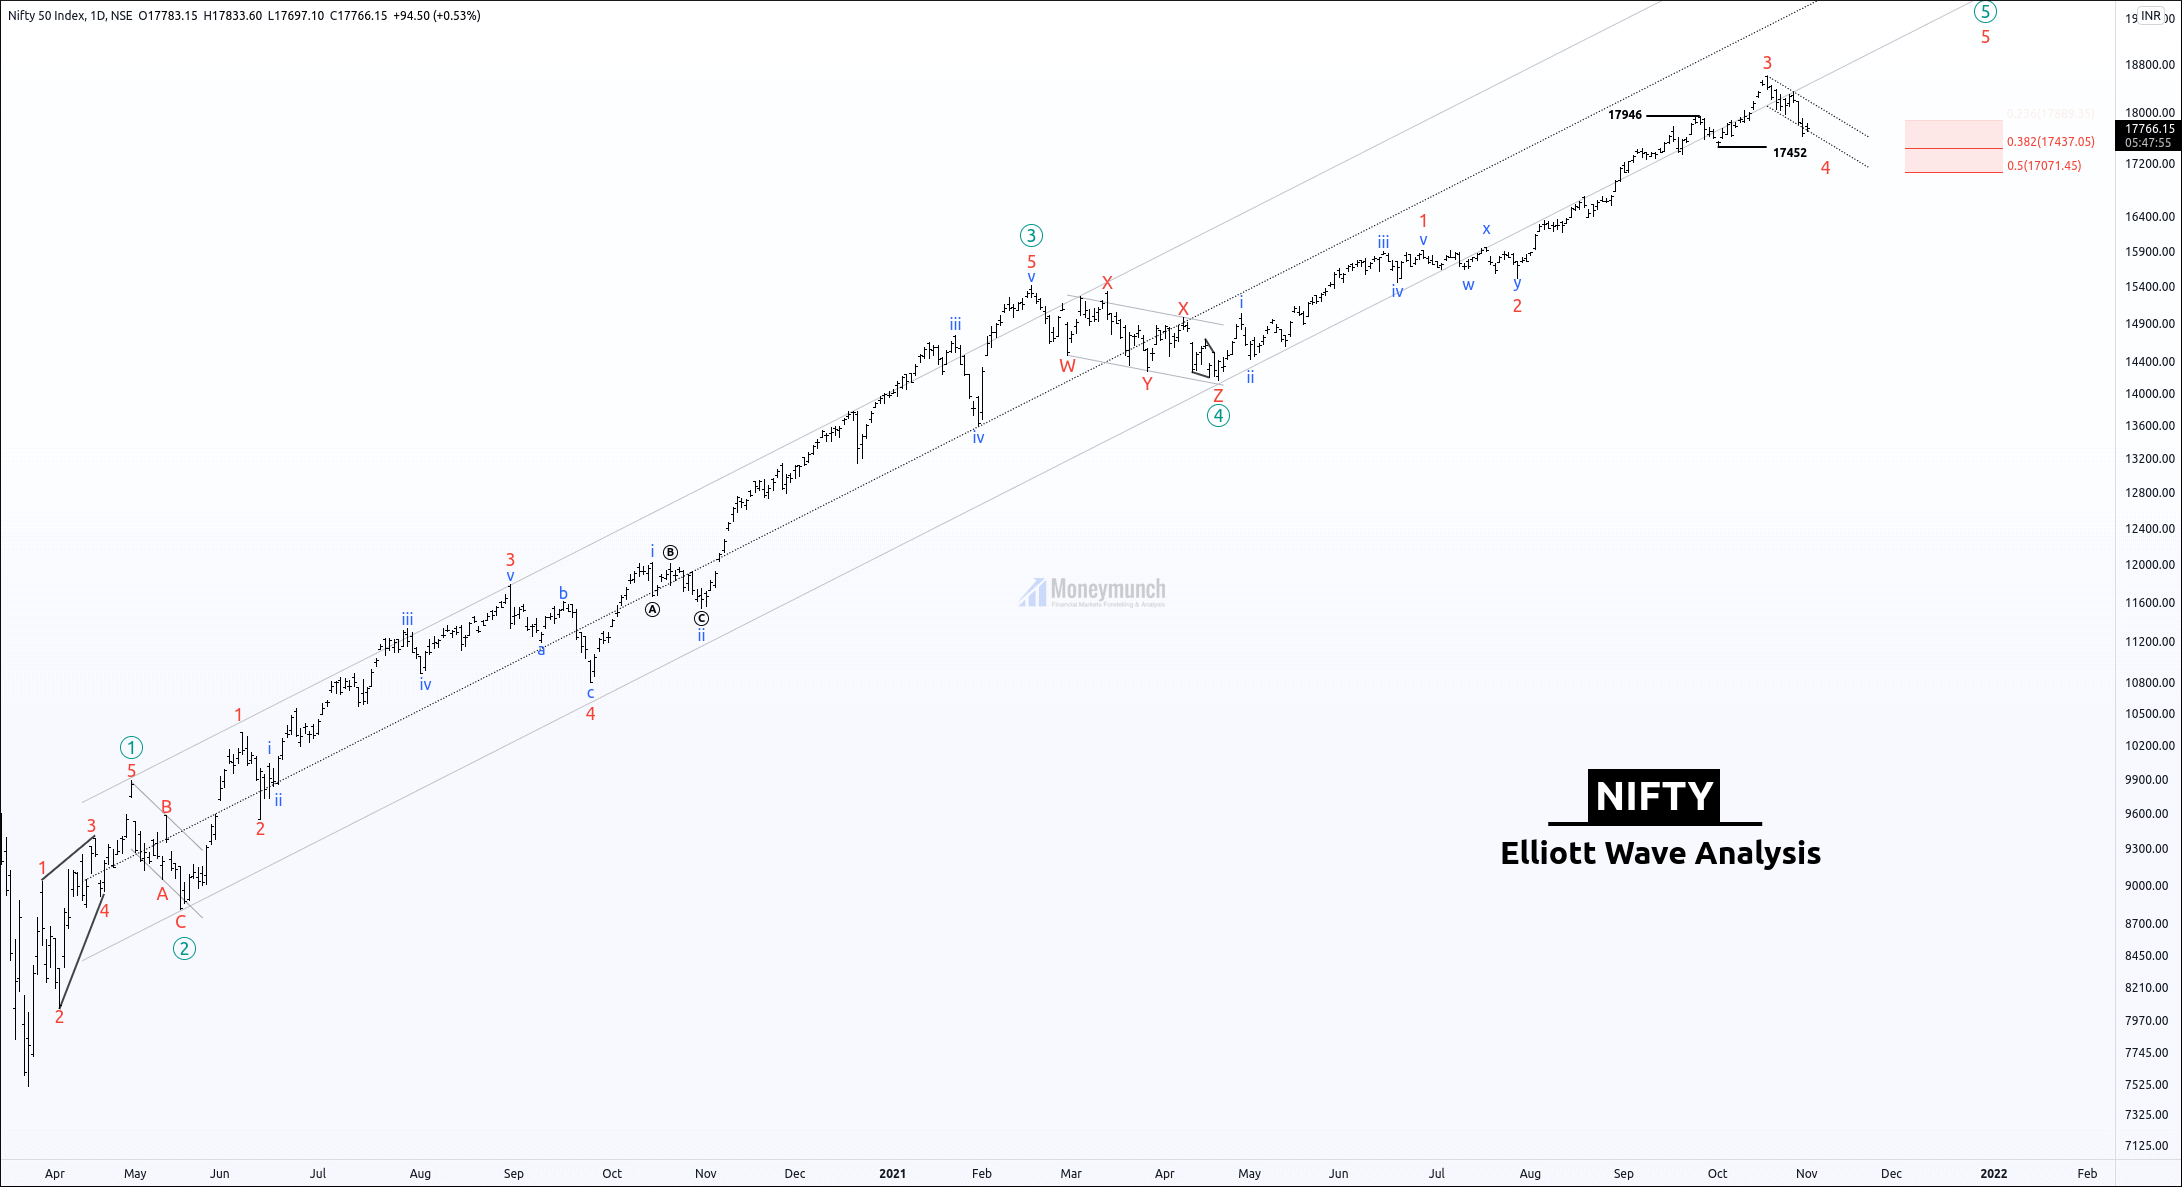
Nifty is forming corrective wave 4 of wave ((5))

Nifty has made a high at 18604 and started falling due to conclude of wave 3.

It has broken the base channel due to high selling pressure on Nifty.

The following terms confirm the nifty pullback.

  • The common Fibonacci retracement of wave 4 is 38.2%. Nifty has entered the 38.2% retracement level. It seems like the reversal is ahead.
  • Wave equality (A = C)
    Wave C is 100% of wave A and vice-versa. If nifty breaks the previous low, then it can reverse between 100% to 161.8% range.

The corrective wave can complete if it sustains in the channel trendline.

To become a subscriber, subscribe to our free newsletter services. Our service is free for all.

Continue reading