Free Live Call: Nifty Futures
How many of you sold Nifty futures today?
BEFORE – 1:26 PM
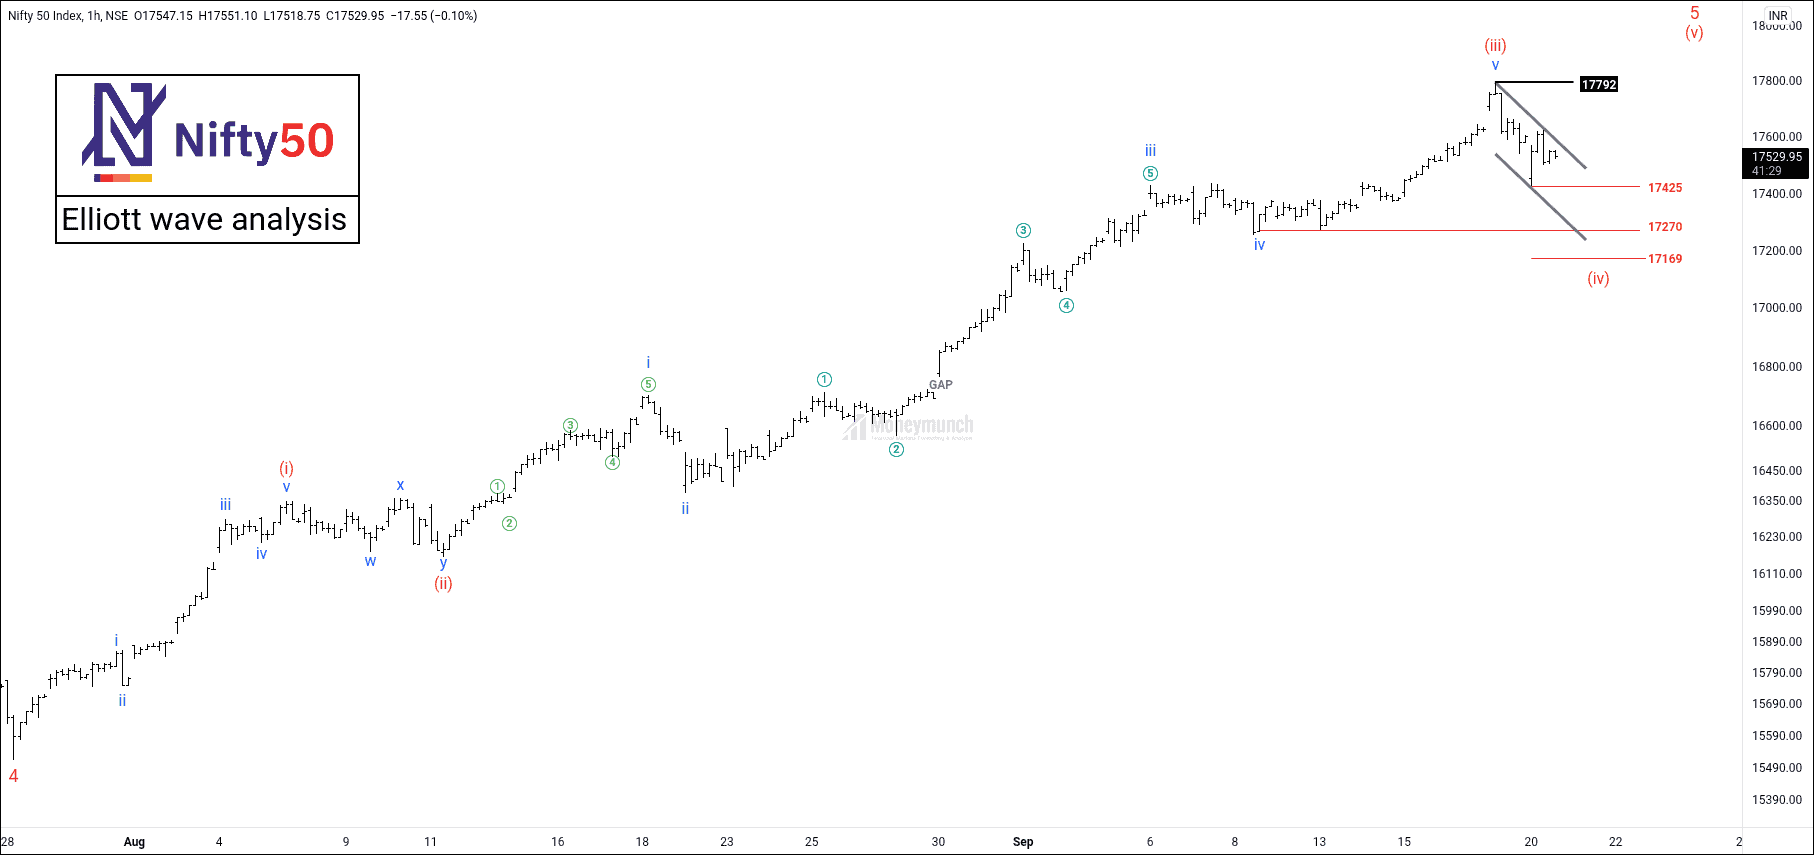
First Update URL: https://moneymunch.com/nifty-can-retest-17169-before-hitting-the-18000-levels/
I had written to sell Nifty at 1:26 PM, “The nifty trader can see the following targets:
Target 1: 17425
Target 2: 17270
Target 3: 17169“.
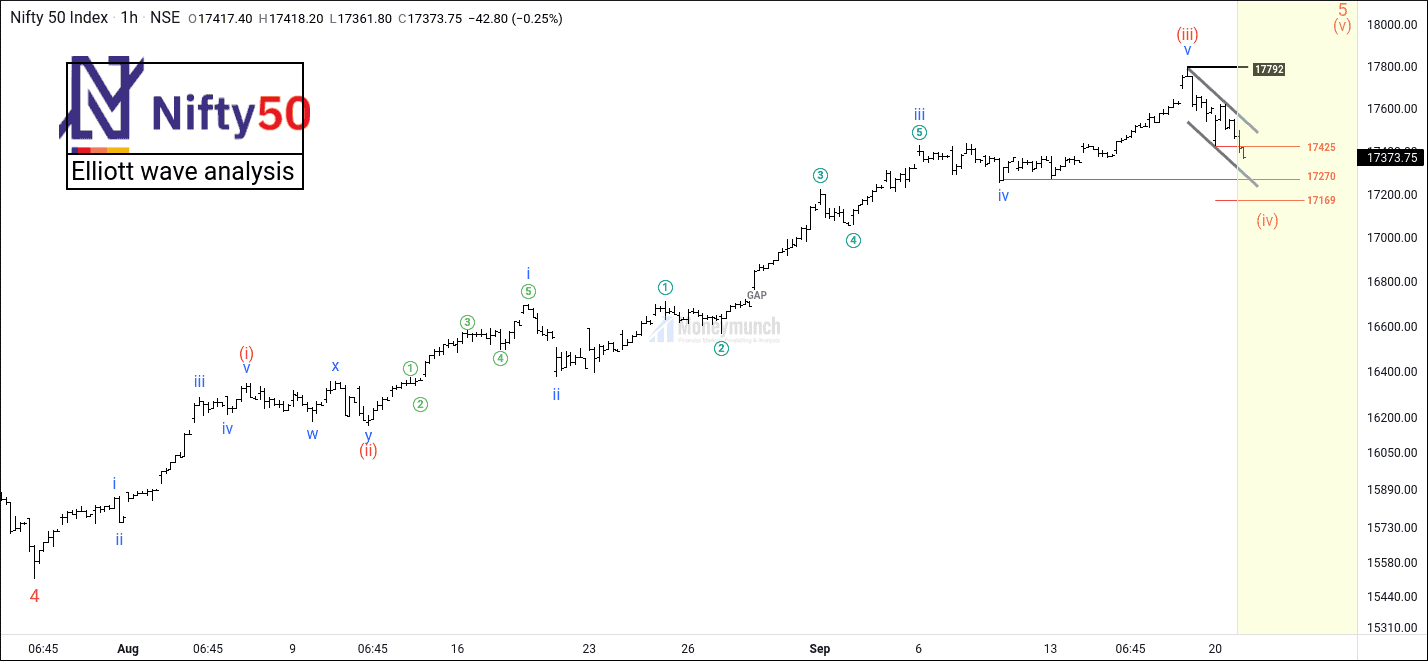
AFTER – 3:08 PM
The first target of nifty has come. To become a subscriber, subscribe to our free newsletter services. Our service is free for all.
Continue reading
 Unlock This Article