
Click on the chart to enlarge
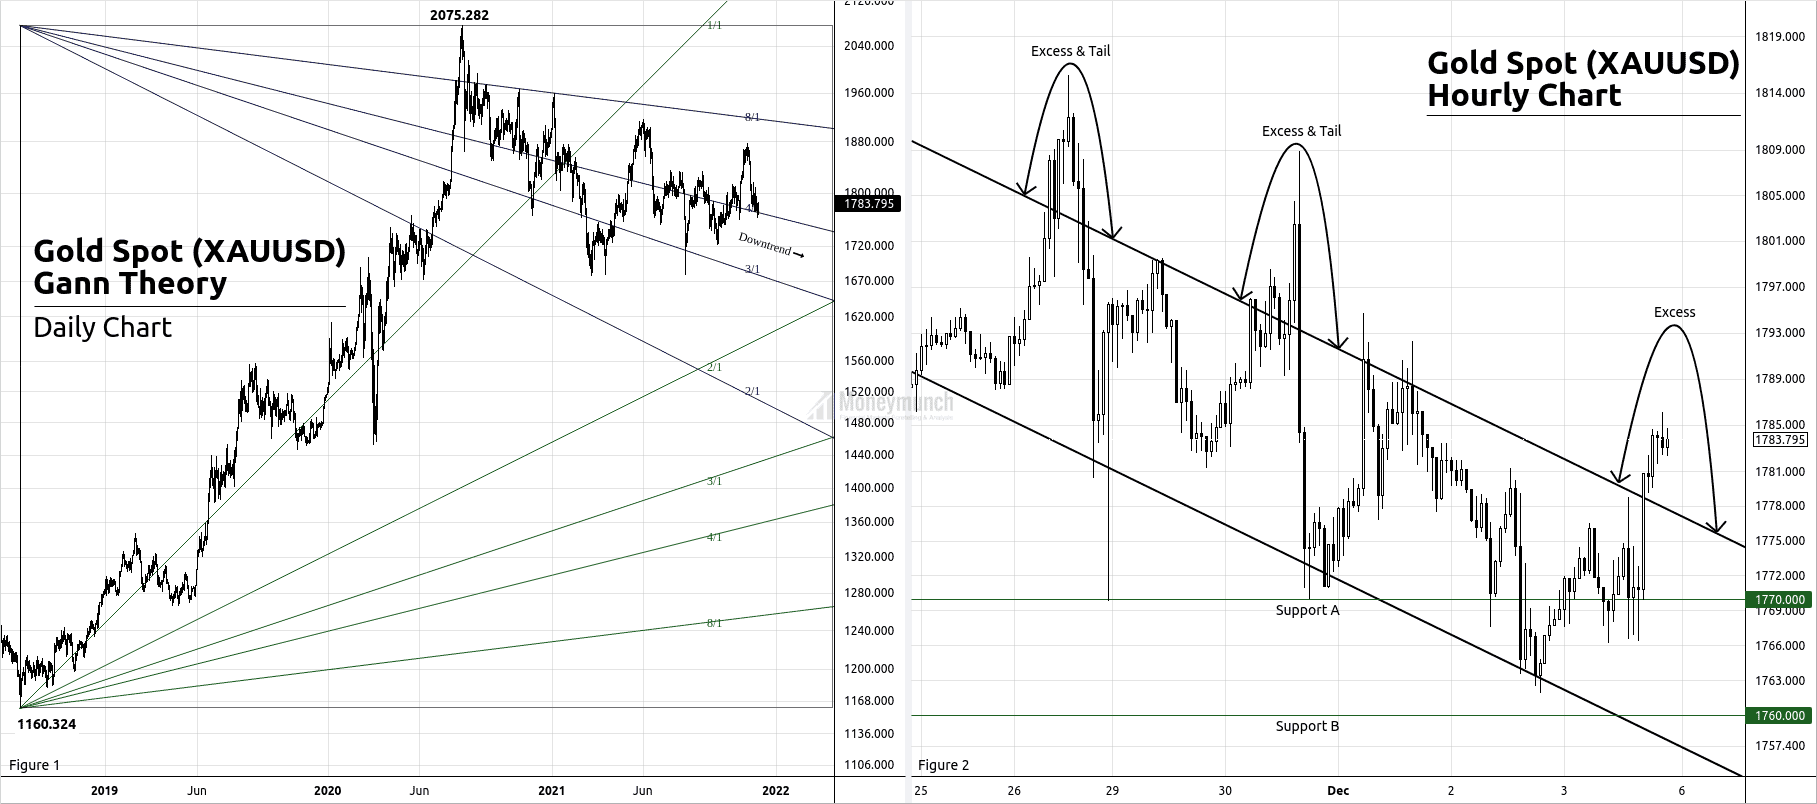
See the above chart wherein I have used the Gann Angles as support & resistance. As per the rules of All Angles, when the stock price breaks an Angle, it will rotate to the next Angle. Gold Spot is under a downtrend until the breakout of 8/1.
But that’s all about the long-term view. If you see the above Gold Spot’s hourly chart, there are two supports. And if XAUUSD repeats the game of excess & tail, then the downtrend will begin.
Hence, be ready for the levels of $1752 – $1726 – $1680 below.
Gold Spot can hold the downtrend by staying above 4/1. If it happens, then we will see $1830 – $1860 – $1900+ levels.
Continue reading
 Unlock This Article