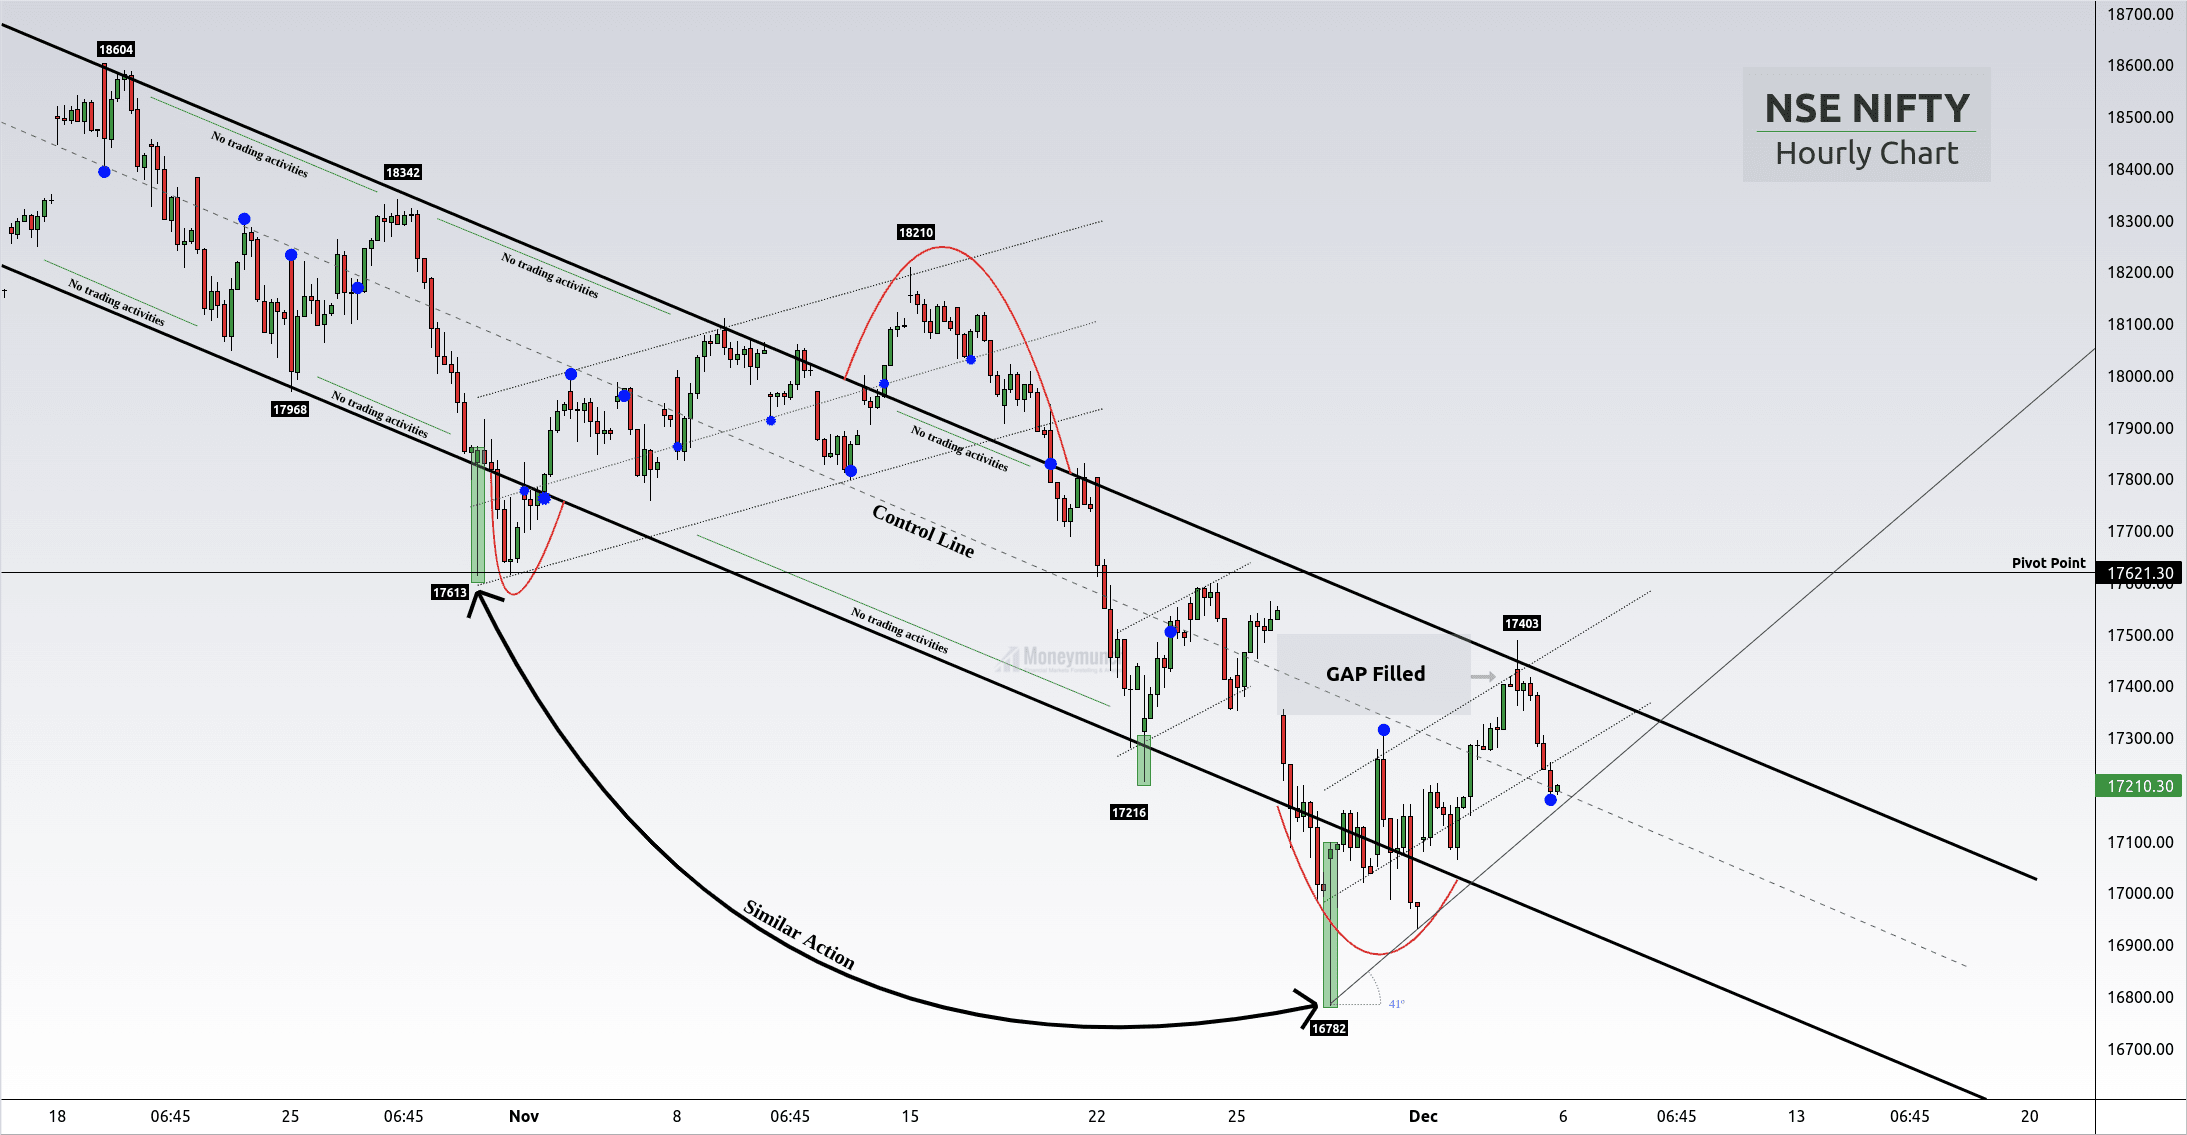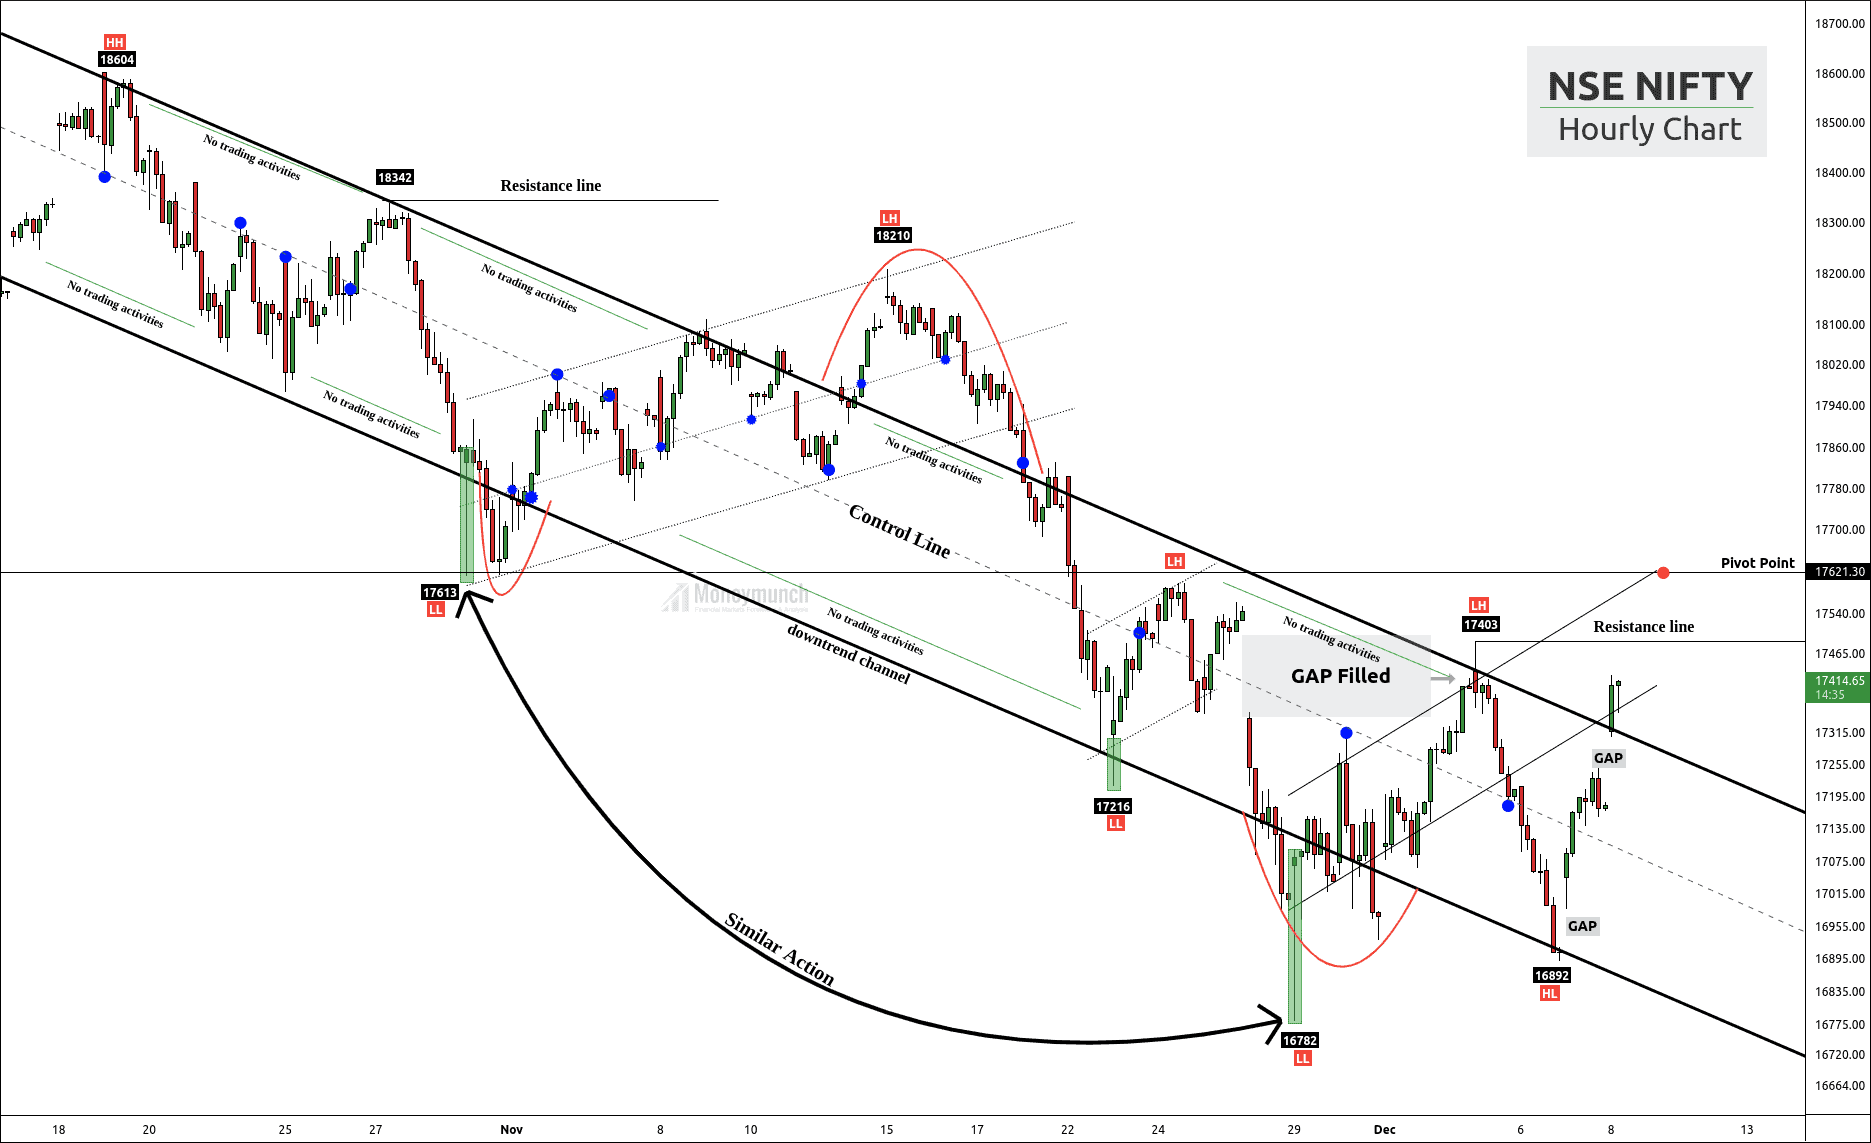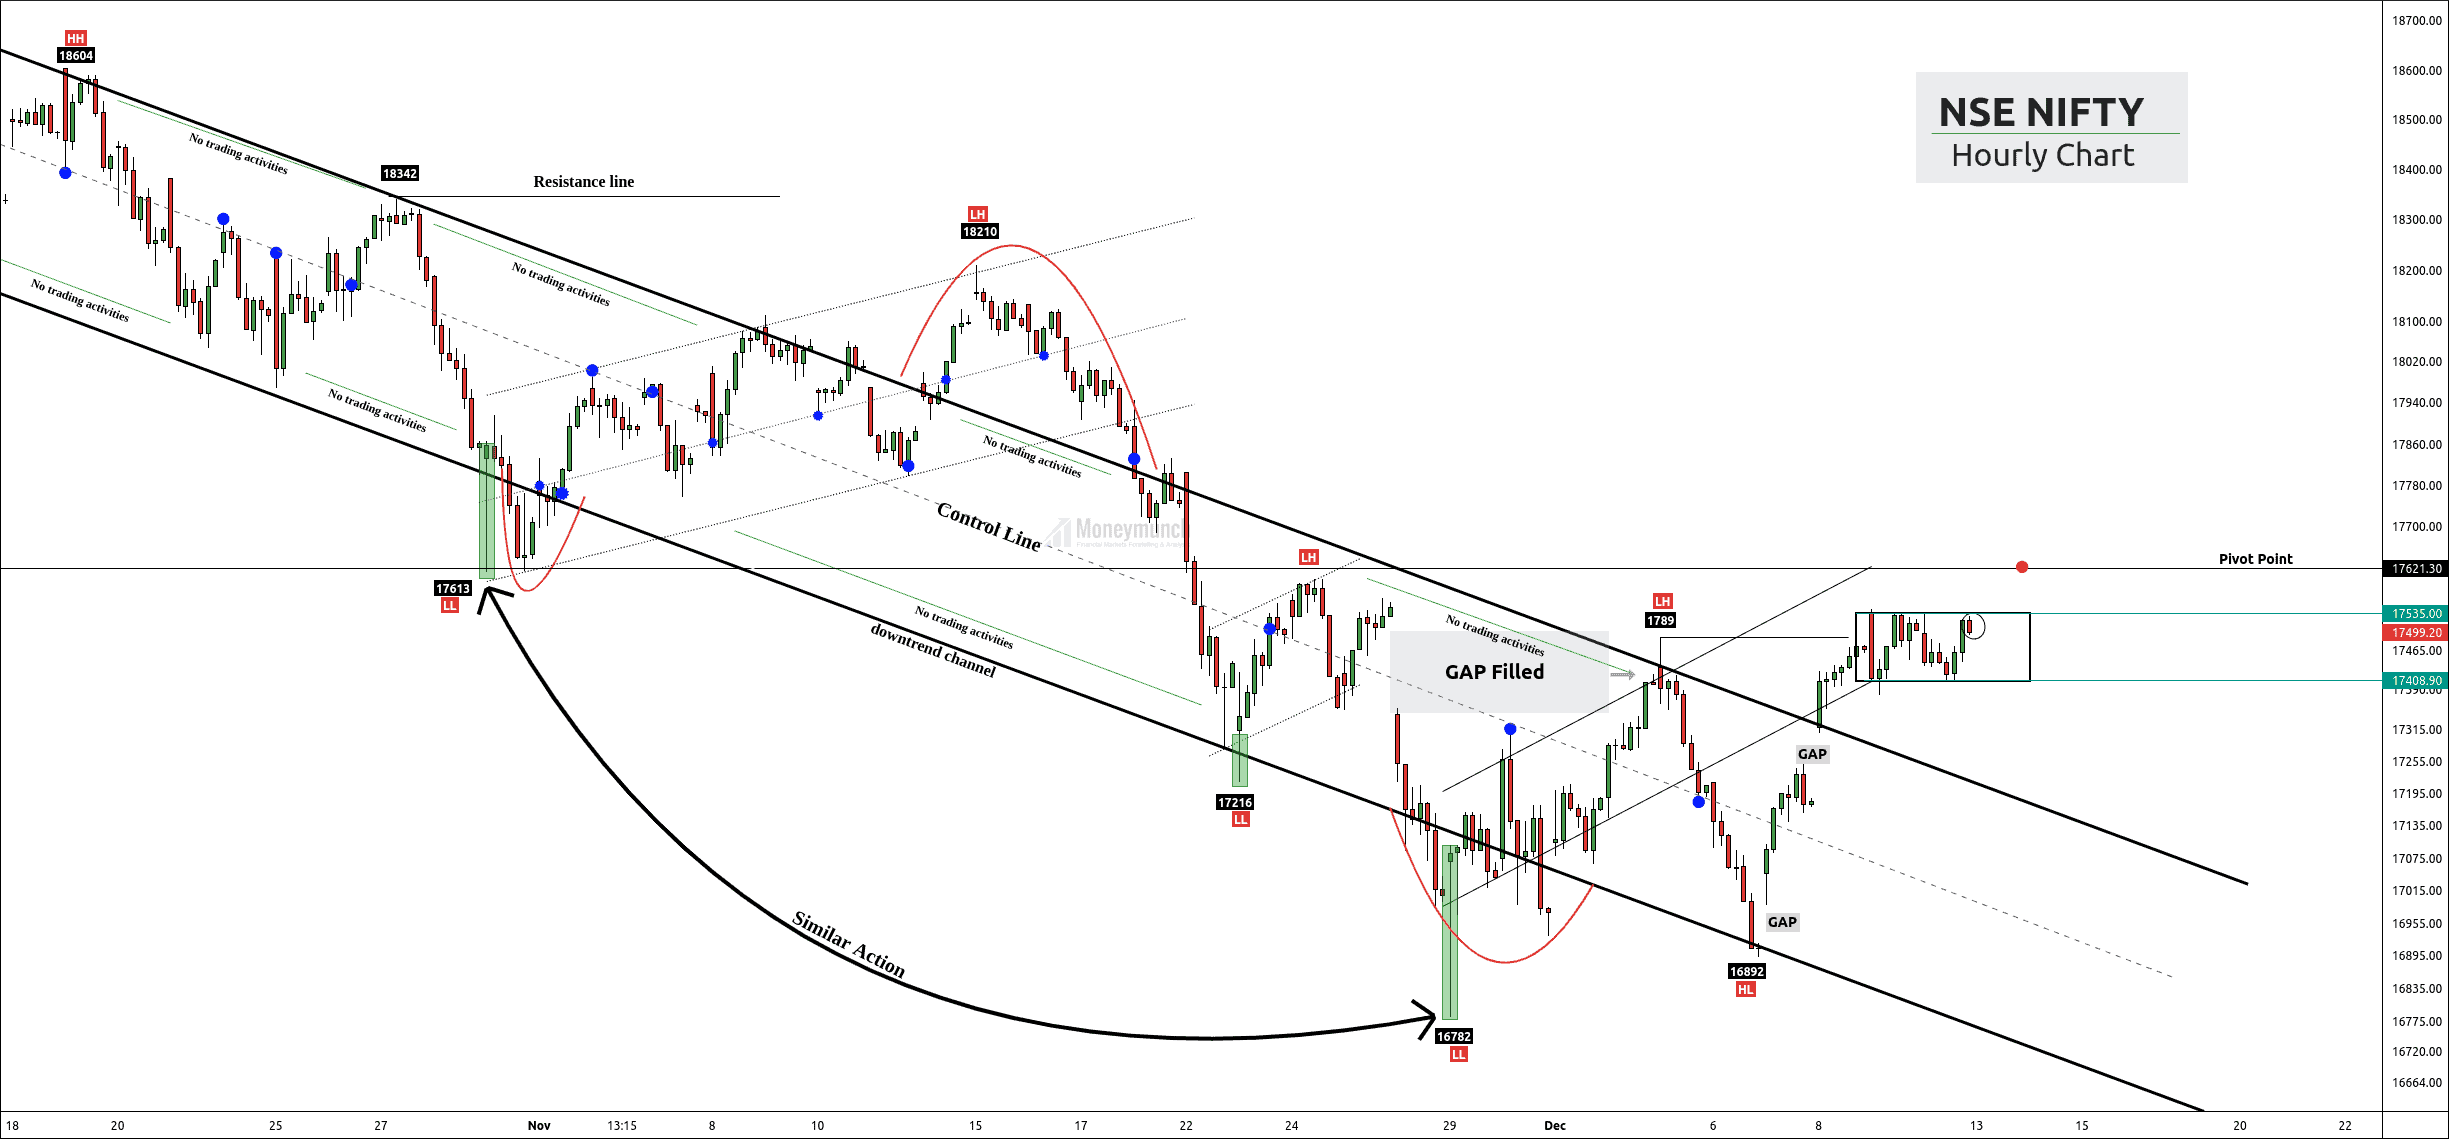
Nifty hasn’t given a continuous breakout of the lower high. If nifty couldn’t give consecutive closes above lower high, there can be a failed swing low and signals resumption of the trend.
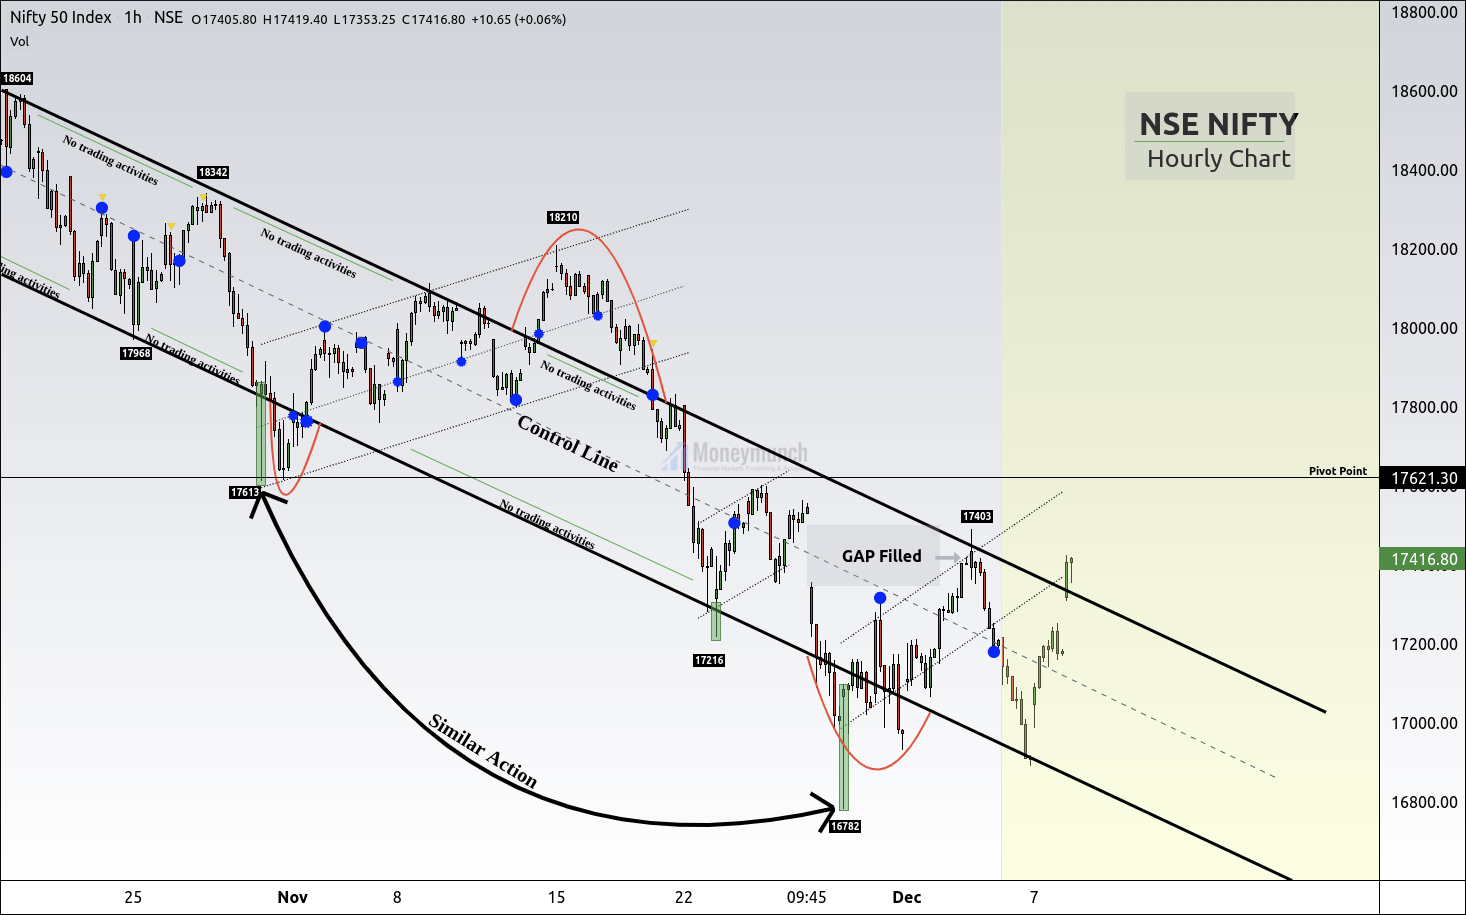
In 30-minute timeframe, the price has made a value area box where supply equals demand. If nifty gives a continuous break to the upper band of the value area, traders can initiate a buy position for the target of 17554-17586-17618.
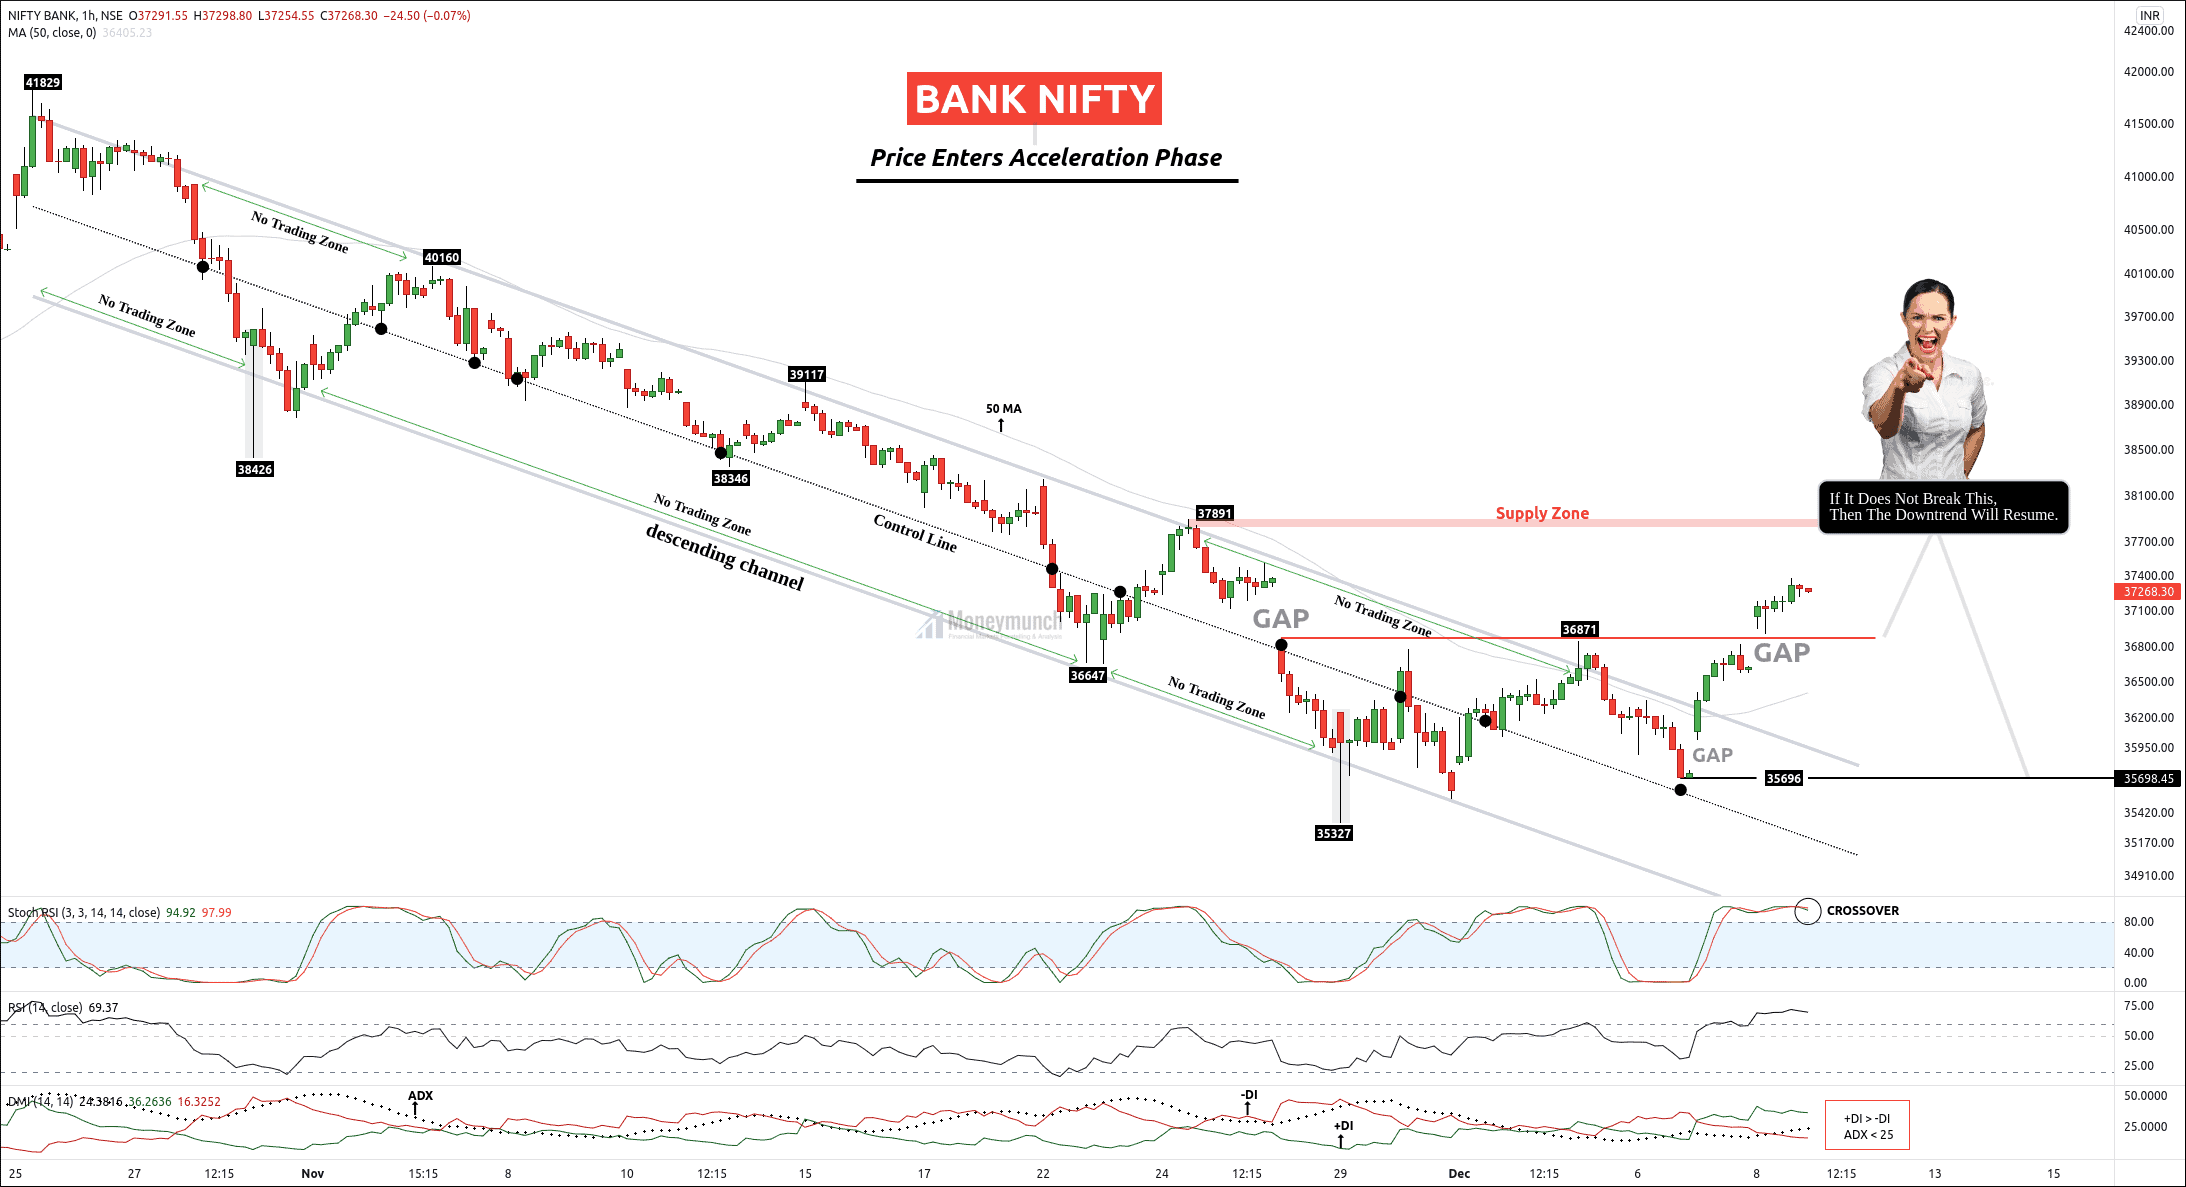
Strong closes above 17621 indicate a good time for bull traders.
Swing failure may drive the price lower. Bear traders can look for 17465-17408-17312.
To become a subscriber, subscribe to our free newsletter services. Our service is free for all.
Continue reading