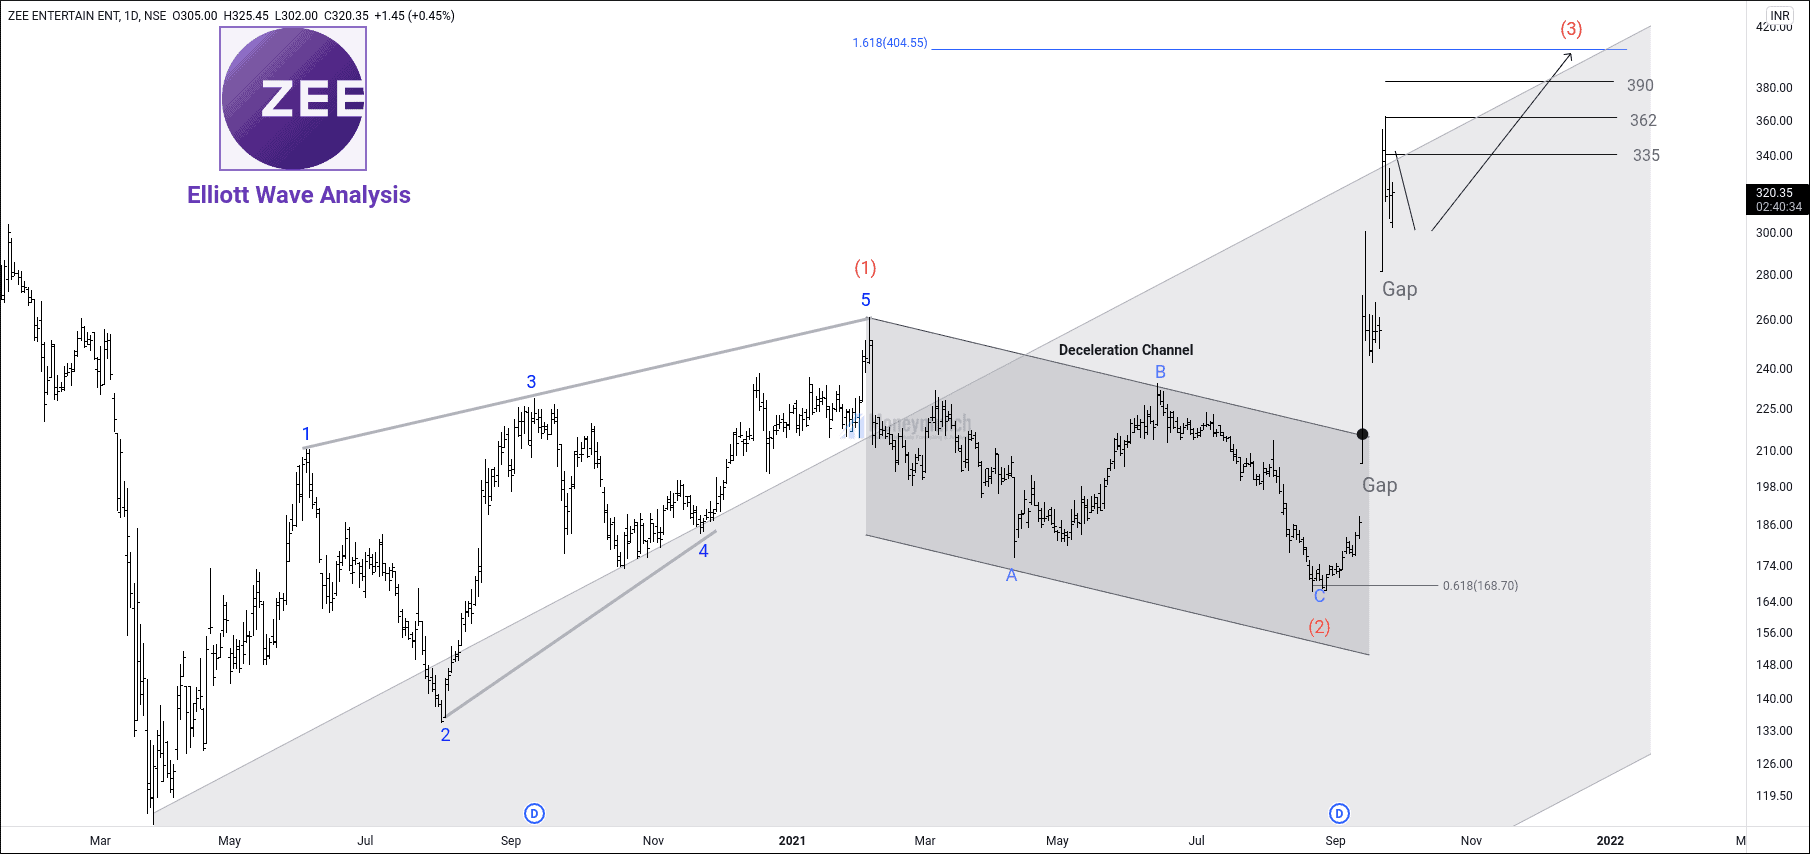
NSE Free Calls on Kotak Bank, YES Bank, and Eicher Motors

free nse yes bank daily chart & tips

YES Bank: Price action analysis & trading tips

The YES Bank stock has started falling for a long period. If it breaks the consolidation area, it will keep collapsing, and we may see 10 – 9.60 levels soon. It’s under that range from the last 17 days.

But according to price action analysis, it will try to jump up to make a new LH. It can be nearby the 12.15 – 13.5 range. Safe investors can start selling nearby dynamic LH with the stop loss above the hurdle line.

free nse kotakbank chart & tips

Kotak Bank Has An Explosive Rally Ahead

NSE Kotak Mahindra Bank has started marching upside because it has completed wave ((4)). Its fifth wave will end nearby the retracement of wave ((4)) of 161.8% and sub-wave of (4) of 161.8%. So, long-term investors may hold for the targets of 2345 – 2446 – 2536.

At present, intraday & short-term investors can also jump on this stock. Kotak bank prices may move forward up to 1900 – 1960 – 2056 levels to hit the halfway of wave 5th. Consecutive closing above the level of 1832 is a direct buy signal.

A short reversal is expected at the last target of 2056.

nse eicher motors stock tips & chart Continue reading

Will Crude Oil Hit 5400 Next Weekend?

free commodity crudeoil daily chart & tips

Crude oil has started moving forward since May. And it will not stop here. It’s just a WXY correction.

According to Elliott’s wave theory, it has completed the sub-wave under the 4th wave. It’s consolidation time. Crude oil prices may fluctuate between the range of 4000 – 5400. Hence, long-term investors can keep buying crude oil.

So, what about short-term investors and intraday traders? If you look into 4 hours chart, it seems bullish from here. Crude oil is trying to break the resistance trendline. Whenever that the resistance trendline break, then we may see the prices at 5300 – 5400+.

Kindly note, if crude oil remains below to resistance trendline, then do not buy.

What happens if it does not break the resistance trendline? To become a subscriber, subscribe to our free newsletter services. Our service is free for all.

Continue reading

Will Bitcoin reach $1,00,000 Before 2022?

BTCUSD Bitcoin Cryptocurrency Signals

Bitcoin prices were moving upward at the beginning of 2021. But, its investors have seen heavy downfall into May to June. Afterward, it has hiked from 28600 to above 51356. According to Elliott’s wave theory, it’s running under the 4th wave. We may see a sideways trend here. Bitcoin is preparing for a solid uptrend ahead. It’s a right to jump on Bitcoin for the long-term investment. And the correction can be between the range of 28600 to 50000 because it will start marching for $1,00,000 soon.Continue reading

Part 1: A simple analysis of Wyckoff of Wall Street

wyckoff trading pattern

Wyckoff was a pioneer in the technical analysis of the stock market in the early 20th century. He established the Stock Market Academy in 1930. The main course is to introduce how to identify the dealer’s process of collecting chips and the process of distributing chips/judge. Second and third, in the basic law of “causality”, the horizontal P&F count within the trading range represents the cause, and the subsequent price changes represent the result.

Fourth, fifth, the relationship between price and volume on the candlestick chart to analyze the relationship between supply and demand. This law sounds simple, but it takes a long time to practice in order to accurately grasp the volume and price. I heard that Wall Street financial institutions are using Wyckoff’s trading method to judge the trend of the stock market and look for opportunities. So what exactly is Wyckoff’s theory? Today, I will introduce to you the famous Wyckoff transaction method.

The background of the birth of Wyckoff theory

Wyckoff’s theory was proposed by Richard Wyckoff. He was a pioneer in the technical analysis of the stock market in the early 20th century. He and Dow Jones, Gunn, Elliott, and Merrill Lynch are considered the five giants of technical analysis.

Wyckoff is good at summarizing his years of failures in stock investment, and is committed to introducing individual investors to the rules of the game in the market and the impact of large funds behind them.

In 1930, he established the Stock Market Academy. The main course is to introduce how to identify the dealer’s process of collecting chips and the process of distributing chips. Till, there are still many professional traders and institutional investors applying Wyckoff’s method.

Two Five Steps of Wyckoff Analysis

(1) Determine the current state of the market and possible future trends.
Judging the current market trends and future trends can help us decide whether to enter the market and go long or short.

(2) Choose stocks that are consistent with market trends.
In an uptrend, choose stocks that are trending stronger than the market. In a downtrend, choose stocks that are weaker than the market.

(3) Choose stocks whose “reason” equals or exceeds your minimum target.
An important part of Wyckoff’s trading selection and management is his unique method of using long-term and short-term trading point forecasts to determine price targets.

In Wyckoff’s basic law of “causality”, the horizontal P&F count within the trading range represents the cause, and subsequent price changes represent the result.

(4) Make sure that the stock is ready to move.

(5) When the stock market index reverses, there must be contingency measures
Three-quarters of the stocks are moving in line with the market. Grasping the market trends can increase the success rate of transactions.

Wyckoff Price Cycle Pattern Chart

Continue reading

EWP: Will GBPUSD touch 1.400 before the next weekend?

free forex gbpusd 4h chart & signals

Price has made significant Low at 20th August 2021. Extreme low has given us beautiful Impulsive structures. Wave ((1)) Wave Nature: Motive wave Type of motive wave: Impulse (Five waves) Wave ((2)) Wave Nature: Corrective waves Type of corrective pattern: Irregular or Expanded flat. Retracement of wave ((2)): 50% of wave ((1)). Wave ((3)) Wave Nature: Impulse (3rd wave can only be an Impulse with 5 waves) Extension of wave ((3)) : At this motion, price is riding on sub-wave (3) of wave ((3)). Wave has an extension of ((3)) 161.8%, but the party is not over yet. We are to get waves (4) and (5) of wave ((3)). One can expect 2.618% of wave ((3)) and even more! Sub-waves of wave ((3)) : Wave (1) is an impulse. Wave (2) is an irregular flat. Wave (3) is an impulse. Extension: 161.8% of wave 1 The price extension of wave (3) is 161.8%. If the price breaks the 1.39154 level without any correction, we will have a powerful extension. Wave (4): According to rules of alternation, if the second wave seems flat & time-consuming, then wave four can be sharp and quick. We may get a running triangle or a zigzag correction. Common Retracement: 38.2% of 3rd wave at 1.38305 50% of 3rd wave at 1.38101 61.8% of 3rd wave at 1.37924 50% retracement for wave 4 is acceptable for two reasons: 1. An Important support level is the 1.38107 – 50% retracement level of Wave 3. 2. Wave 4 is more often complete nearby the sub-wave (4) of wave ((3)). If the price breaks the hurdle line, Continue reading

EWT: Will Nifty Hit 18000 Before September End?

free nifty stock tips daily chart

Extending wave (5) should easily travel above 18000 and is likely to continue toward 18480.

Target 1: 18000
Target 2: 18142
Target 3: 18350
Target 4: 18480

To become a subscriber, subscribe to our free newsletter services. Our service is free for all.

Continue reading