Basic Tenets: Elliott waves are famous for finding crowd behavior trends and reverses in recognizable patterns. Elliott’s wave principle is inspired and made from the Dow theory, which is the foundation of the technical analysis.
Elliott’s wave principle consists of eight waves. In this eight wave, price forms two types of wave structure,
1. Motive structure: – Five Wave Pattern. – Moves with the primary/main trend. – Labeled in Numerical method (1,2,3,4,5).
2. Corrective structure – Three Wave Pattern. – Moves against the primary/main trend. – Denoted in alphabetical method (A, B, C).
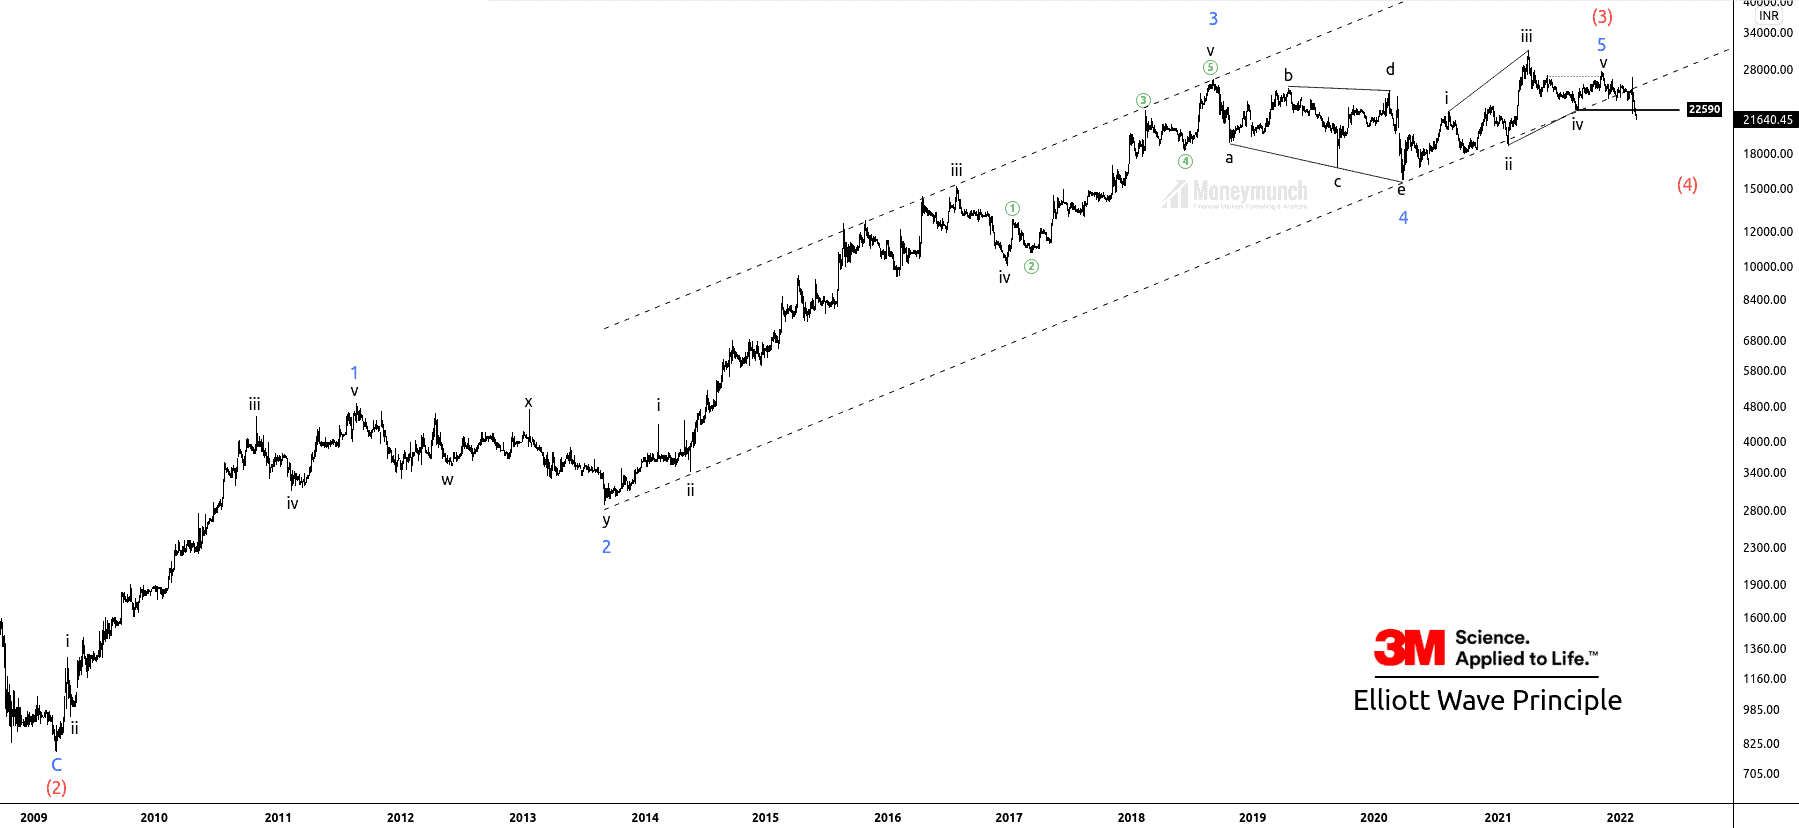
Now, let’s look at the 2-day chart of 3MINDIA.
Timeframe: 2 day Price has accomplished the impulsive wave (3) and started forming corrective wave (4) by breaking sub-wave iv of wave 5 of wave (3). Currently, the price is in corrective mode.
Sub-wave 5 of wave (3) has ceased, the terminating wave v of ending diagonal. Price has broken down the corrective wave iv at, 22590, which signals bearish sentiments. After breaking the main channel, the price started falling sharply.
Calculation of wave (4): The common retracement of wave 4 is 38.2% of wave 3. Wave 4 can never retrace more than 61.8% of wave 3. Wave 4 occurred near sub-wave 4 of lower degree.
Timeframe chart: 4-hour
Price has broken down the sub-wave iv of the ending diagonal of wave 5. After the pullback, if the price sustains below, 22590, it is likely to give a big move below the parallel channel.
Traders can initiate a short position for the following targets of 21010-20557.
To become a subscriber, subscribe to our free newsletter services. Our service is free for all.
Unlock This Article
Only subscribers can read the full article. Please login to read the entire article.
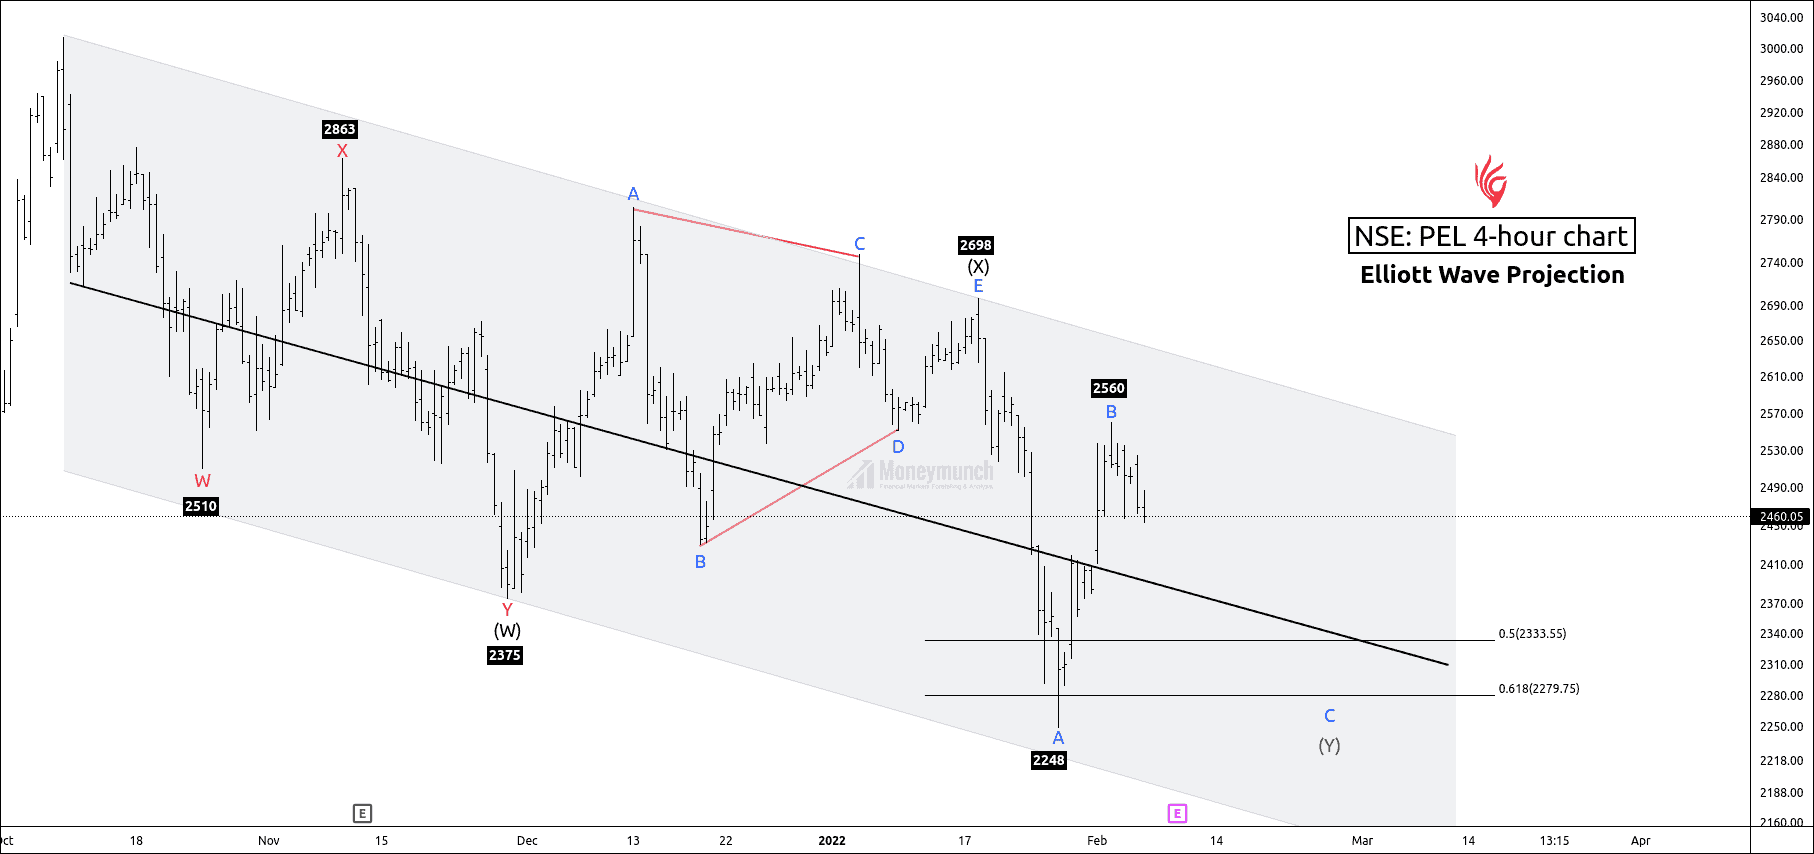
PEL has formed a double three corrective structure. Price had completed wave B of complex correction W-X-Y.
As the price formed in the downward channel and the Y wave was to cease, the price had bearish sentiments.
I had mentioned in clear words,” Traders can initiate short positions for the following targets:2400 – 2376 – 2301 – 2279.”
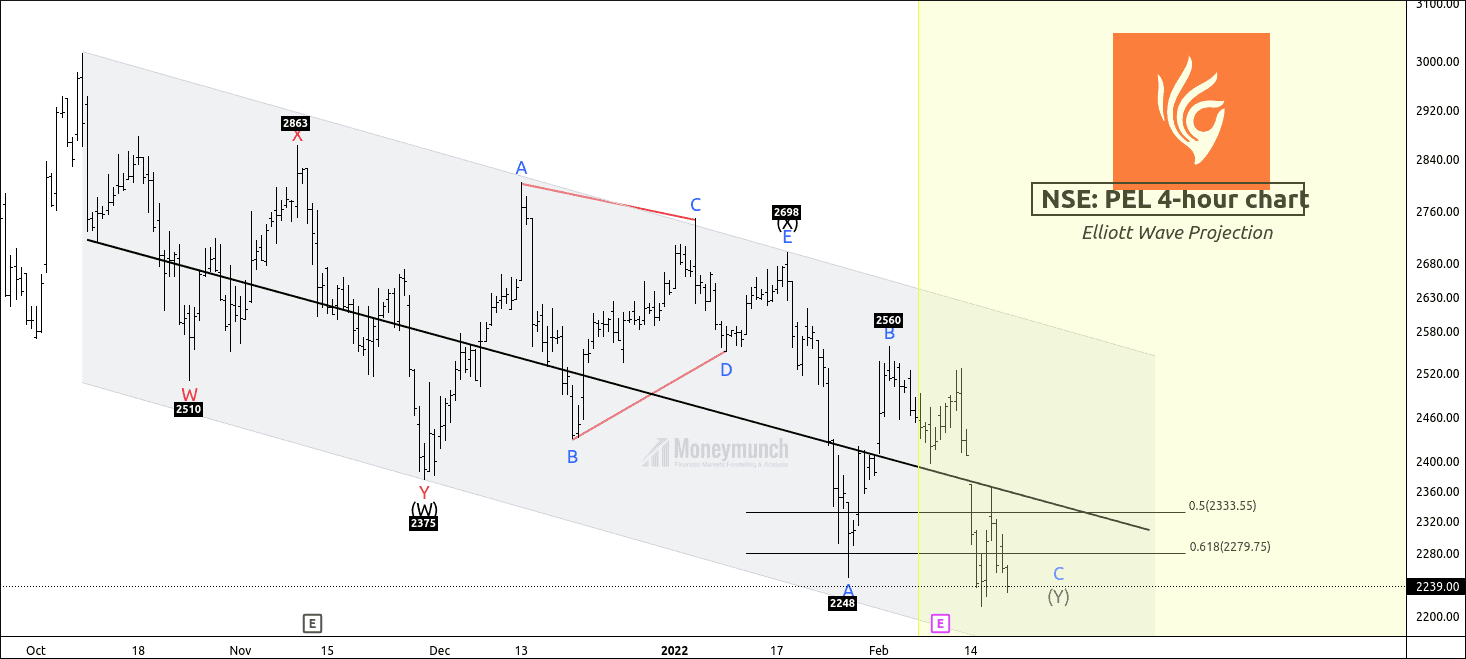
After:
8 February:
Price reached the first target of 2400 and made a low of 2996.
14 February:
Price reached the 2nd target at 2376.
Price reached the 3rd target at 2301.
Price reached the 4th target at 2279.
Unlock This Article
Only subscribers can read the full article. Please login to read the entire article.
GPIL: Godawari Power
Before:
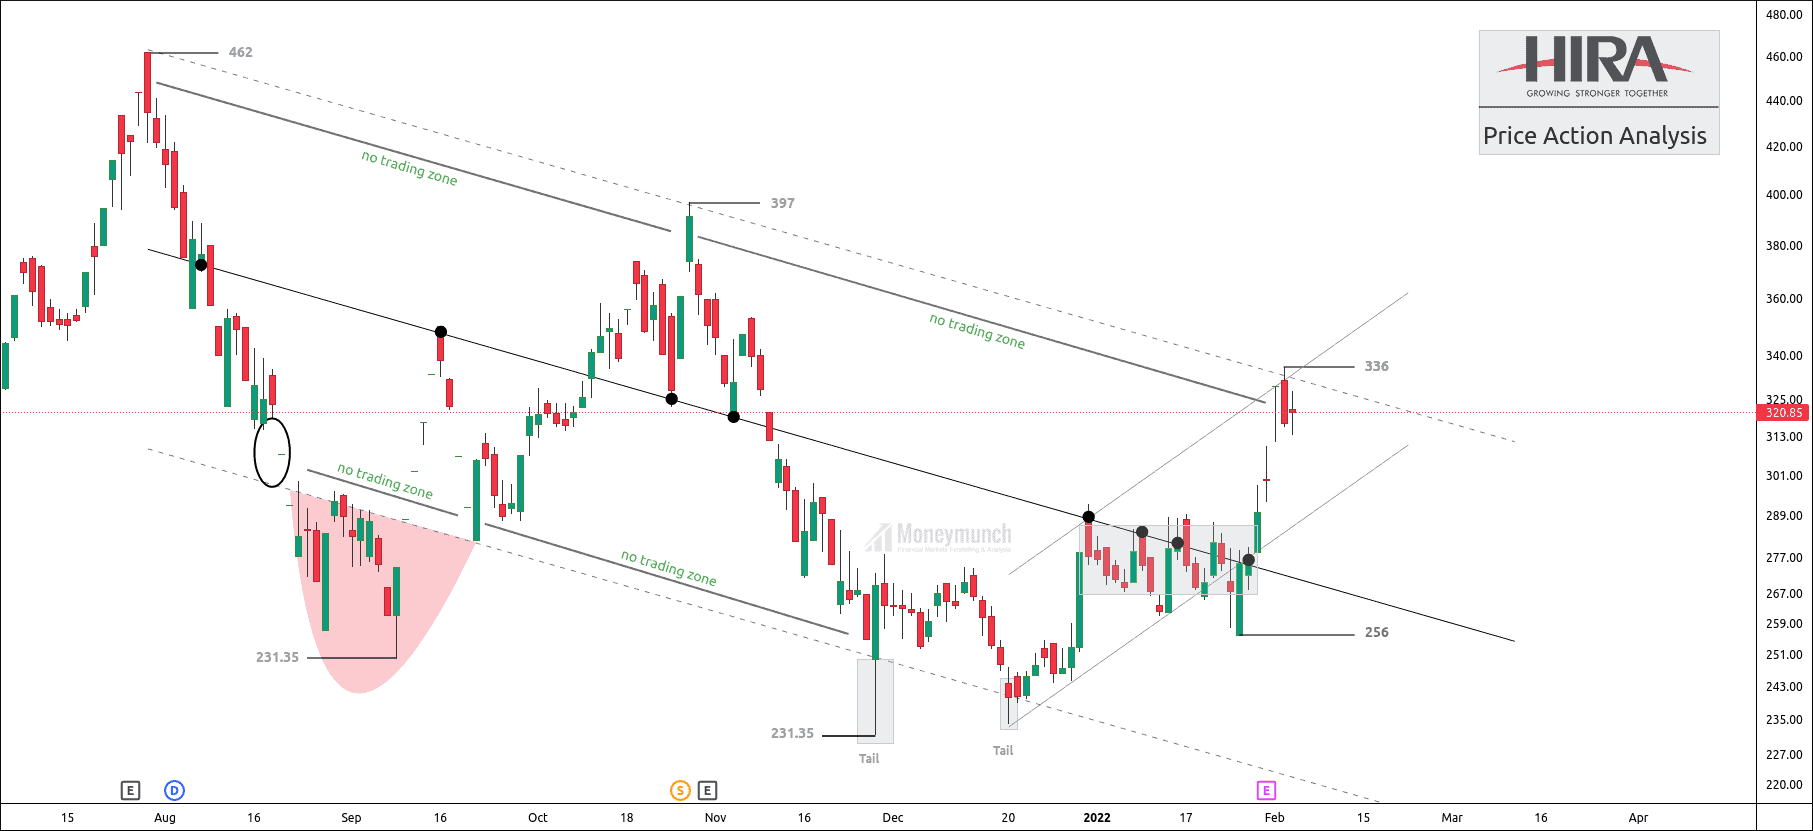
PEL has formed a downward corrective structure. Price was at the upper band of the parallel channel.
The upper-band indicates supply pressure where sellers exceed buyers.
The price has provided two successful rejections from the upper band.
GPIL had bearish the sentiments.
I had mentioned in clear words,” The trader can initiate a short position for the following targets: 313 – 304 – 290.”
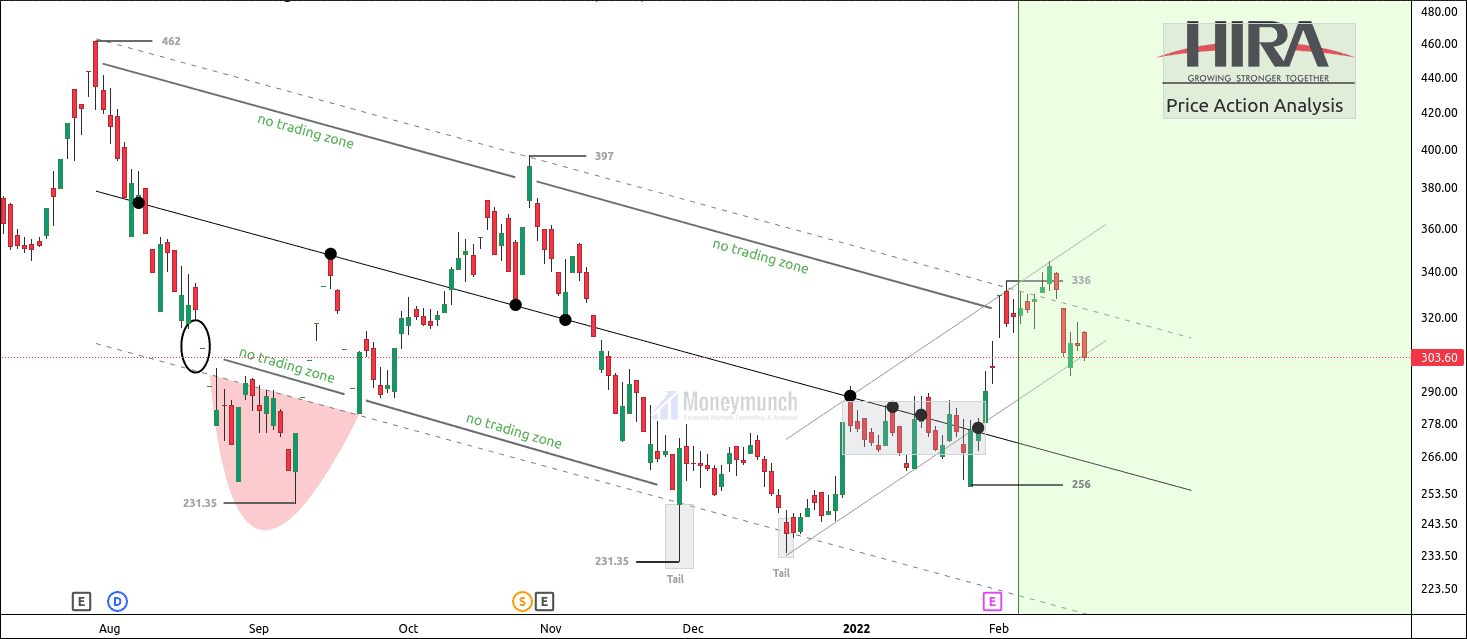
After:
At the upper band, the price couldn’t break the upper band of the parallel channel.
14 February: GPIL reached the First target of 313.
15 February: GPIL reached the second target of 304.
What’s next?
Price is at the lower band of the parallel channel. And if the price breaks down the minor parallel channel, it can travel up to the control line of the downward channel.
To become a subscriber, subscribe to our free newsletter services. Our service is free for all.
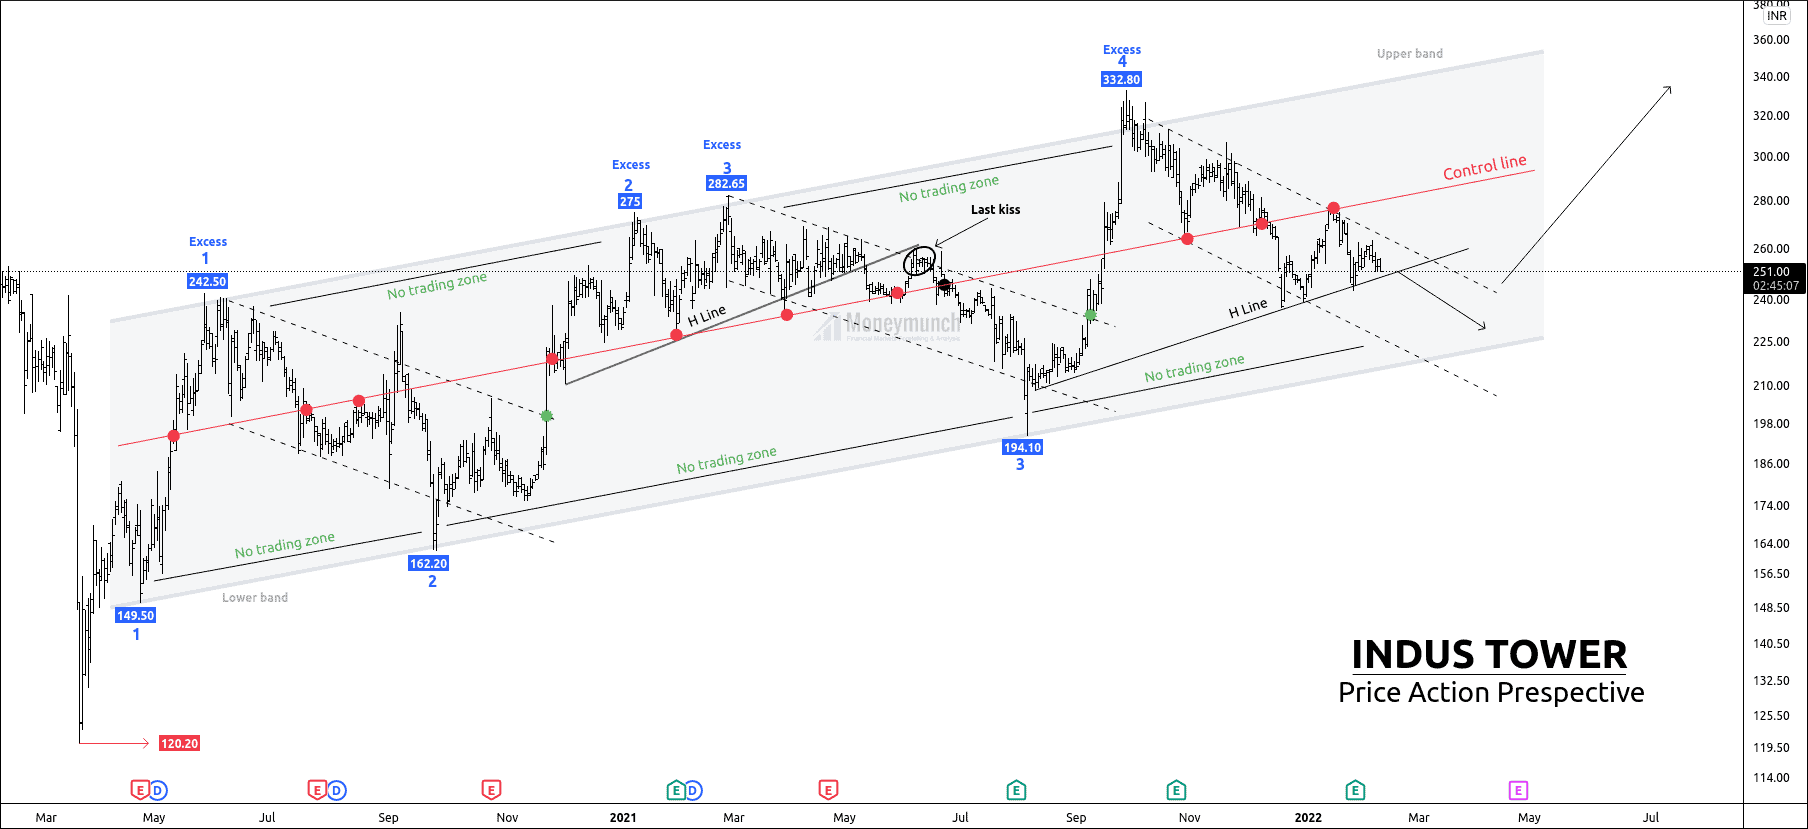
Alright, the operation started after creating an extreme low at 120.20. Price has created an upward channel from the extreme low, where the equilibrium has occurred between bull and bear traders. Control line has given eleven touches, which shows the strong gravitation at the middle.
Here, we can see four reversals on the upper band, and three reversal points occurred on the lower band.
We have two opportunities:
1. Now, the price is on the H-line, and the breakout of the h line indicates the lower band touch.
2. Bull can buy at excess, or they can enter at reappearing in the value area for the target of the control line.
Every beginner who wants to start trading with naked strategy (without indicator) can use this method because the price is the thing that will pay you. Let me explain to you important aspects of the breakdown strategy.
Value area:
A zone in which bulls and bears both are satisfied to stay within it. In this zone, supply and demand equally exist.
Value area has two bands:
1. Upper band
2. Lower band
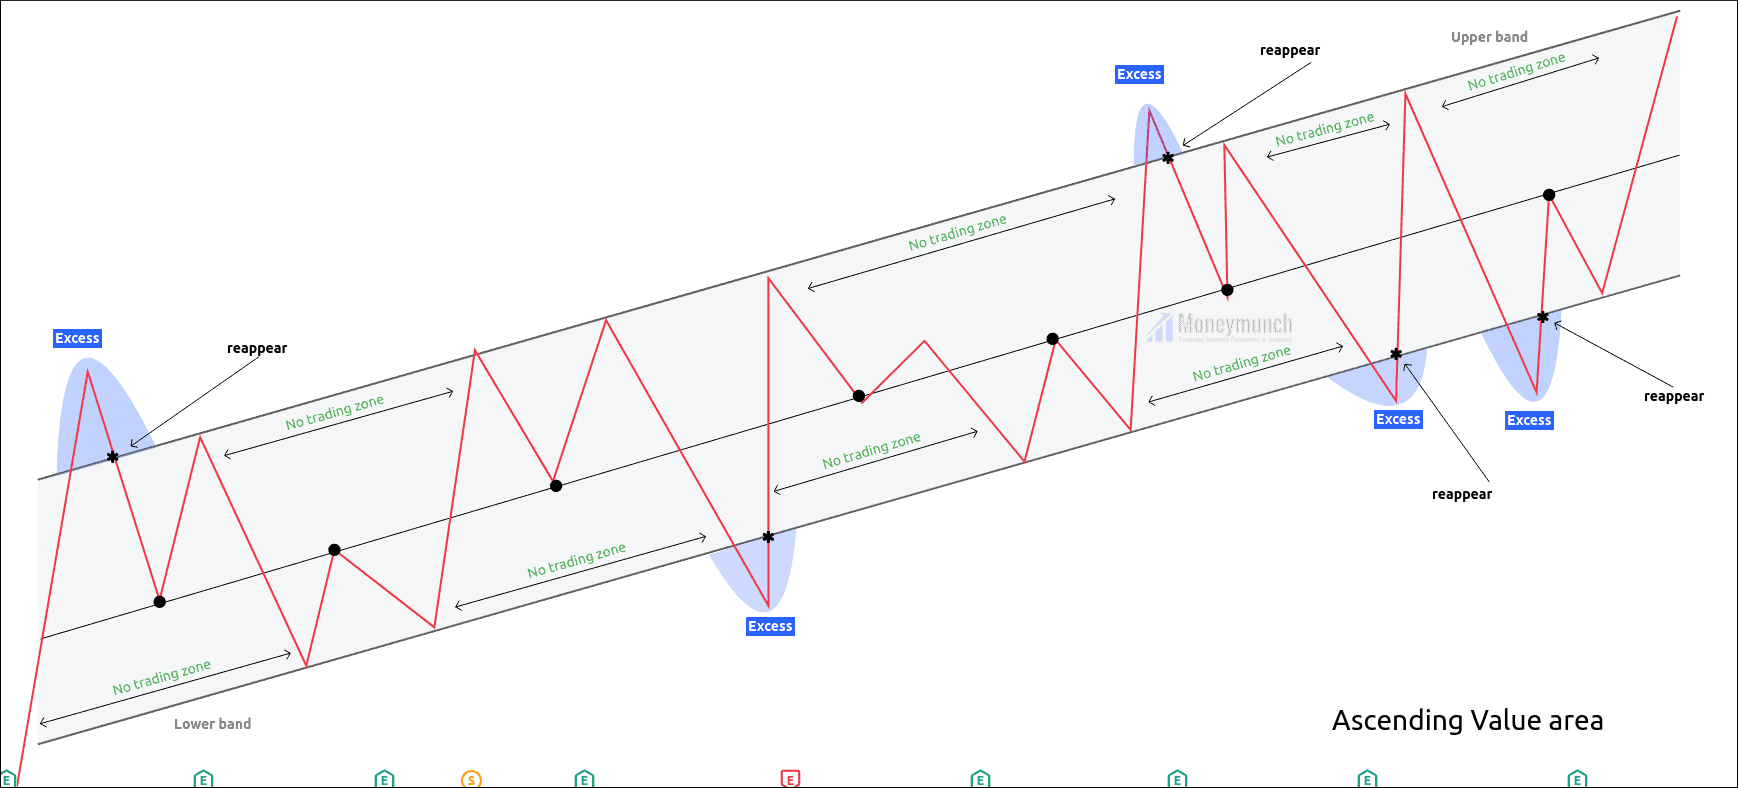
Ascending Value area:
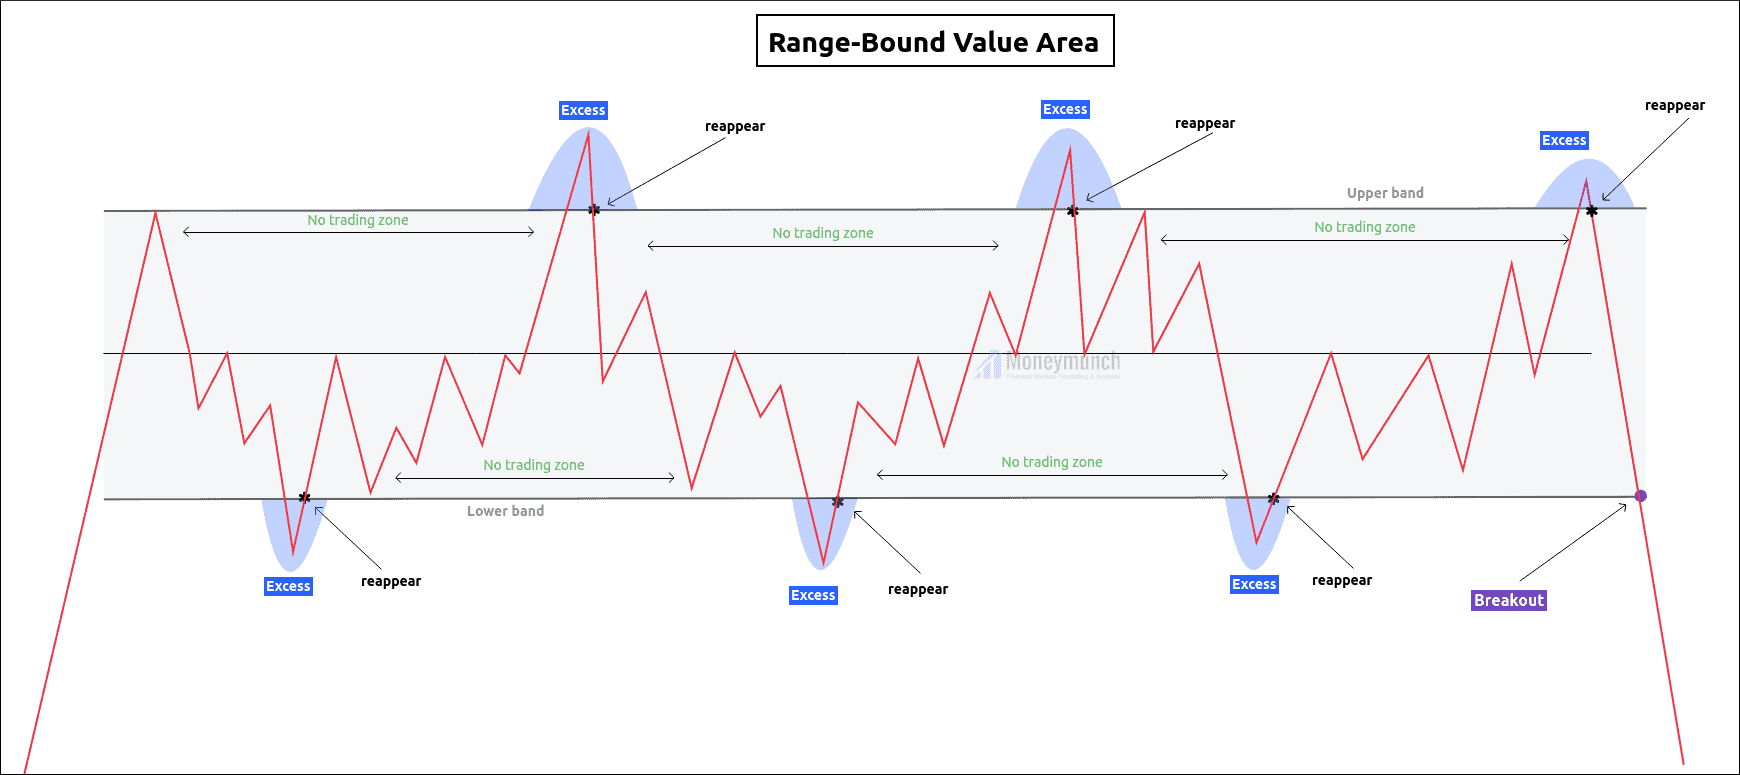
Range-Bound Value area:
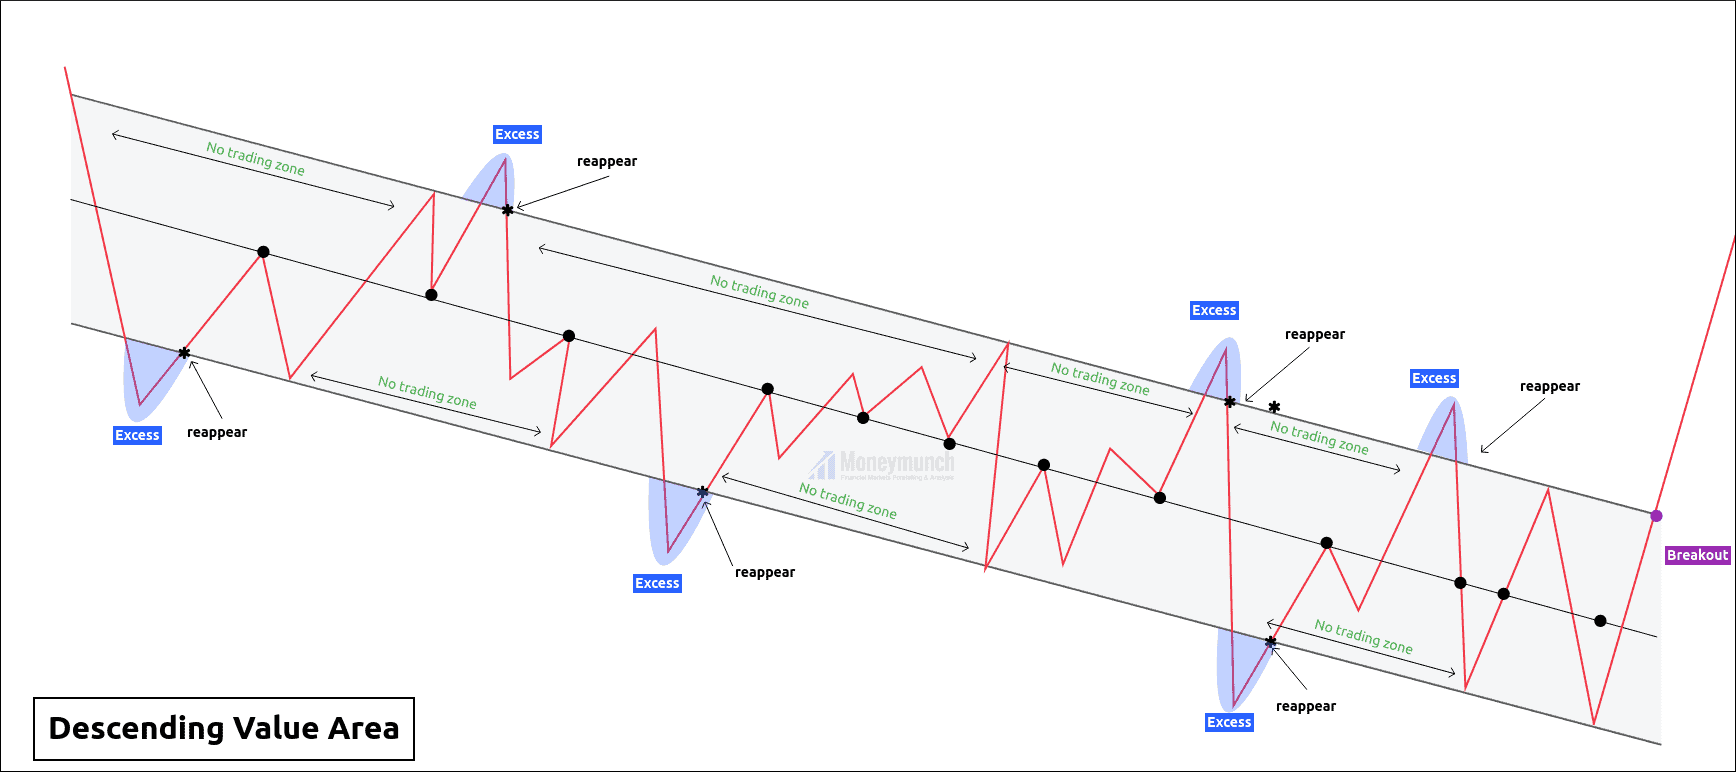
Descending Value Area:
Upper band:
Upper band indicates demand-supply. In this chart, the price has taken four reversals from the upper band to maintain the equilibrium. The upper band put a stop to the bull power.
Lower Band: The lower band indicates demand pressure. In this chart, the price has taken three reversals from the lower-band to maintain the equilibrium. The lower band put a stop to bear power.
No trading zone: In order to respond to either bull or bear’s initiative, the price creates an area. In which no trading activities have taken. It helps to find the weakness of any particular move.
H Line. After completing the last share move, the price creates the bulk trading activities, where bulls’ power becomes dull. Breakout of the H-line indicates the cease of the particular move.
Excess:
Excess is regret and fake-out.
In simple words, price breaks the upper band and again re-enter into the parallel channel. Buying or selling at the excess is the perfect deal.
An excess is a signal of reversal.
The psychology behind the control line: Price is forming in the parallel channel, but bulls are not satisfied with the current trend. That’s why bulls increase demand pressure to break the upper band of the value area. After breaking the upper band, bulls face some problems with profit booking. Now, bulls realize that the price is not going up. Bulls give up on the thought of trend change. Bears were watching this patiently. And after they realize that prices are too high, they increase supply pressure above the upper band of the channel. Now bulls are out of the market, and the seller has maintained the equilibrium & Vice versa.
Control line:
The Control line is the gravitation point of any value area. We can draw by connecting the reversal points in the middle. The more the points are available, the higher the effectiveness.
Please note that the price can not stay away from the control line of the value area. We can use it as a price target or breakout trade.
Here, the price has given eleven touches on the control line.
Breakout or breakdown of the channel: Bulls and bears both disagree with the current price trend. Either bulls or breaks out the value area by giving consistent closing. It often happens after a complex correction or trend change.
Unlock This Article
Only subscribers can read the full article. Please login to read the entire article.
To become a subscriber, subscribe to our free newsletter services. Our service is free for all.
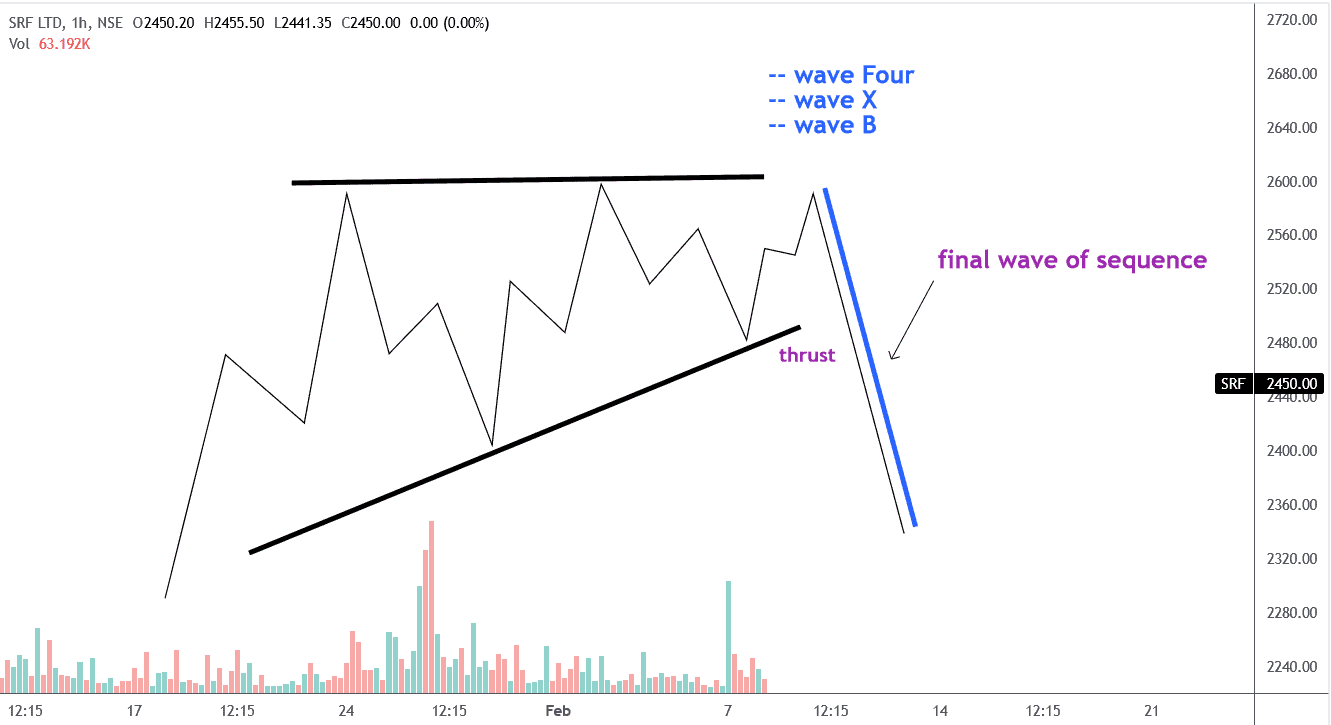
Getting started with today’s real-time research, I’m going to talk a little about triangle types and their position. If you are calling from my recent posts, I have written various types of Triangles: 1. Contracting triangle, Expanding triangle, and Barrier triangle. I’m going to be showing you a triangle thrust measurement technique and going to be utilized to identify a high probability target. The Triangles are limited in where they can from by themself at wave 4, Wave X and Wave B and rarely wave 2.
Protective Stop, Critical Resistance and Failed Pattern:- Only word of caution with respect to this pattern in this market at this time that prices have yet to get below extreme of wave “D”. On an hourly closing basis being the case, that means we can actually see maybe another move to the upward OR a more time-consuming wave “E” OR wave “E” itself can actually form into a triangle. Therefore, until the price actually get below the extreme of wave “D” on an hourly closing basis. You need to do is simply view this point right here in the extreme of wave “C” as are critical support level for this interpretation. Whenever the price close above critical support, it means simple I’m wrong. But, the price would come below extreme of wave “D” on a hourly basis that would provide very strongest evidence for this pattern is indeed to complete. And, then the price is going to see a thrust.
Thrust Measurement Technique: At the origin of the move for ABCDE triangle or simply taking the widest portion of the triangle in measuring it. In this real-time instance, expecting trust measurement move is approximately at 2226 downside from the extreme of wave E.
Trade-Setup: I’ll divide the “Trade-Setup” into two portion, one for Aggressive Trader and other for Safe-Trader. The safe trader can take action after breaking down wave “D” on basis that means after revealing the evidence of thrust move. An aggressive trader can act at or nearby “Critical Support” in advance. Yes, absolutely traders can create their position at these both trade-setup.
Therefore,
Trade 1: Sell SRF in base of cash/equity market price 2495-2425 for Aggressive Traders
Trade 2: For the Safe Traders, Sell 2410 below and protective stop is above wave “E” after confirmed and, target ratio 1:3 minimum.
To become a subscriber, subscribe to our free newsletter services. Our service is free for all.

 Unlock This Article