EWT: NSE INDHOTEL Price Ready For Another Blast
Price Action Perspective:
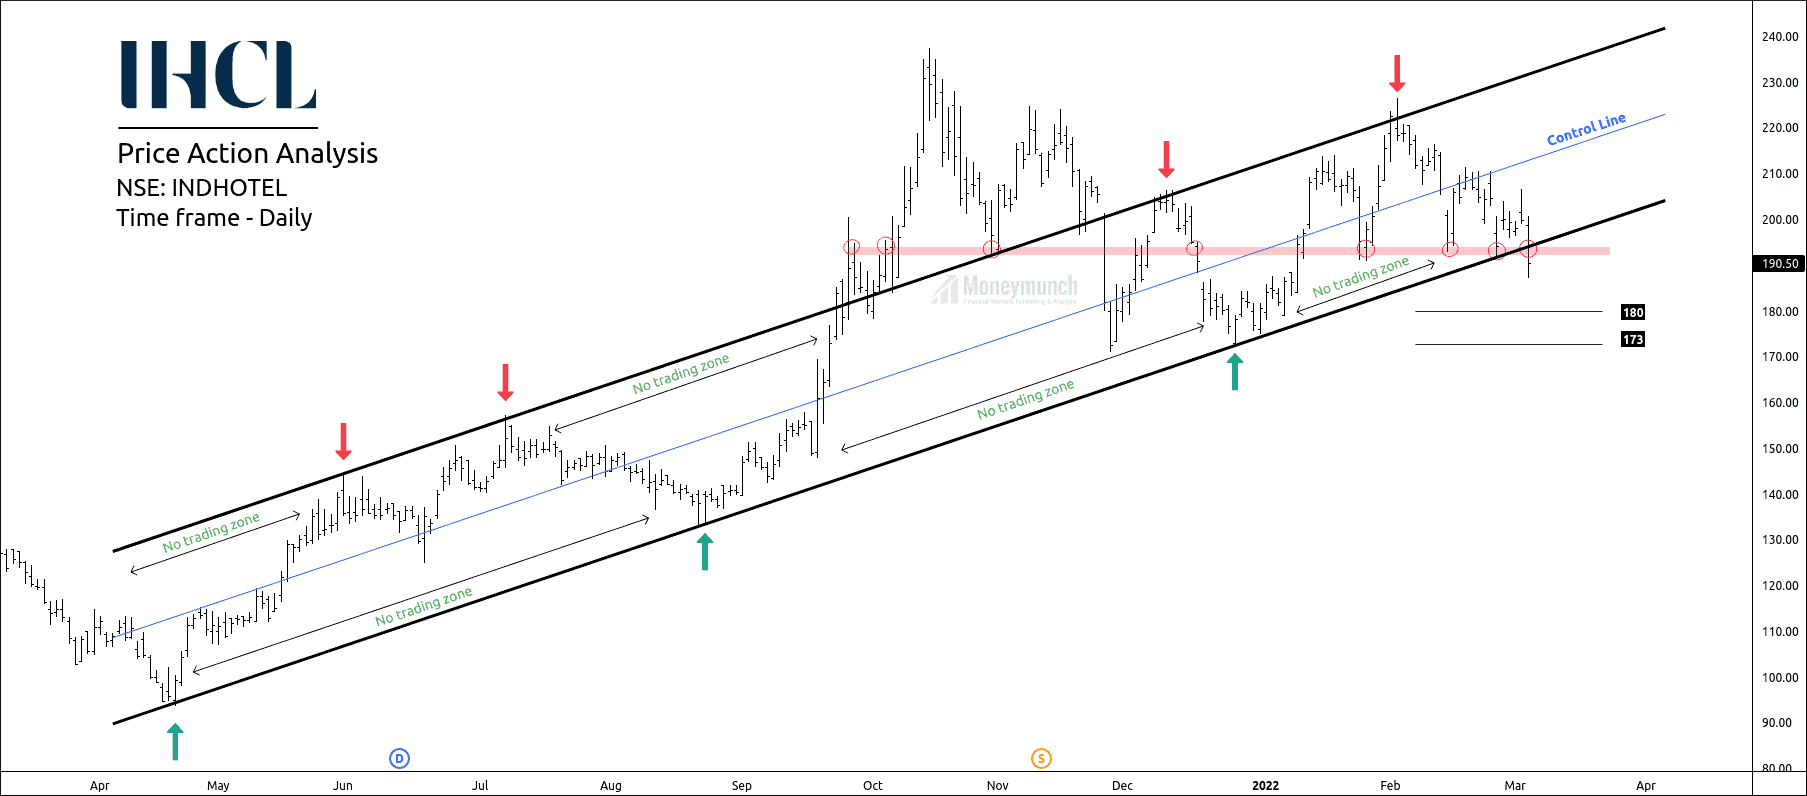
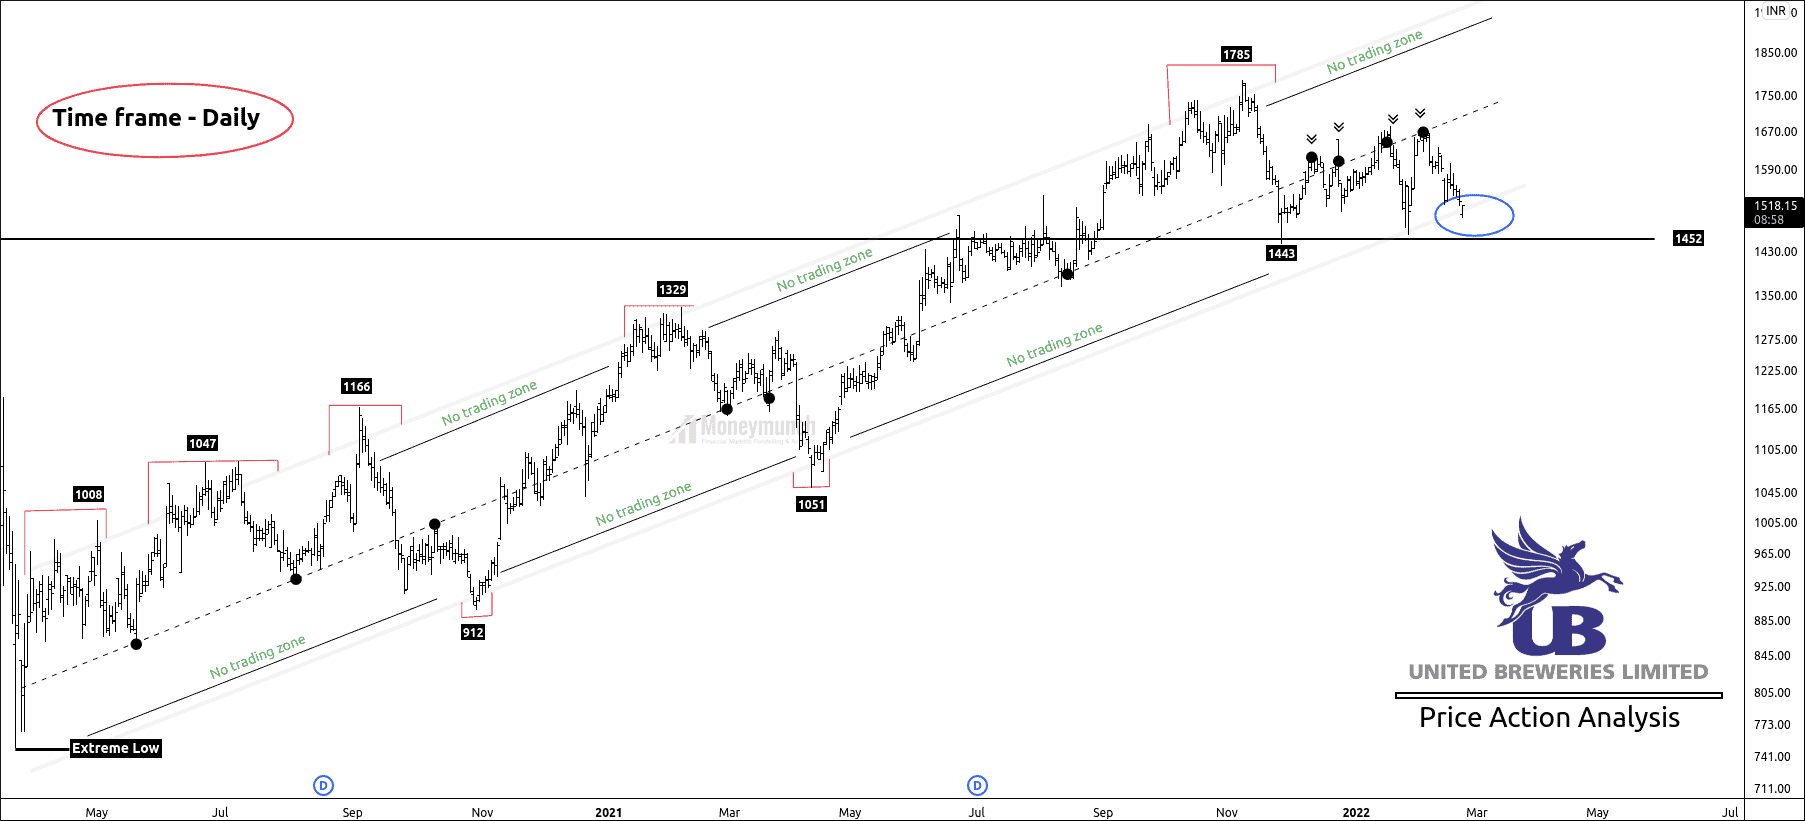
INDHOTEL is on the lower band of the parallel channel, and we have a pivot zone of 192.
If the price breaks down the pivot zone & parallel channel, we can expect a down move for 180 – 173+.
The invalidation point for subscribers is the high of the previous sessions.
To become a subscriber, subscribe to our free newsletter services. Our service is free for all.
Elliott Wave Perspective:
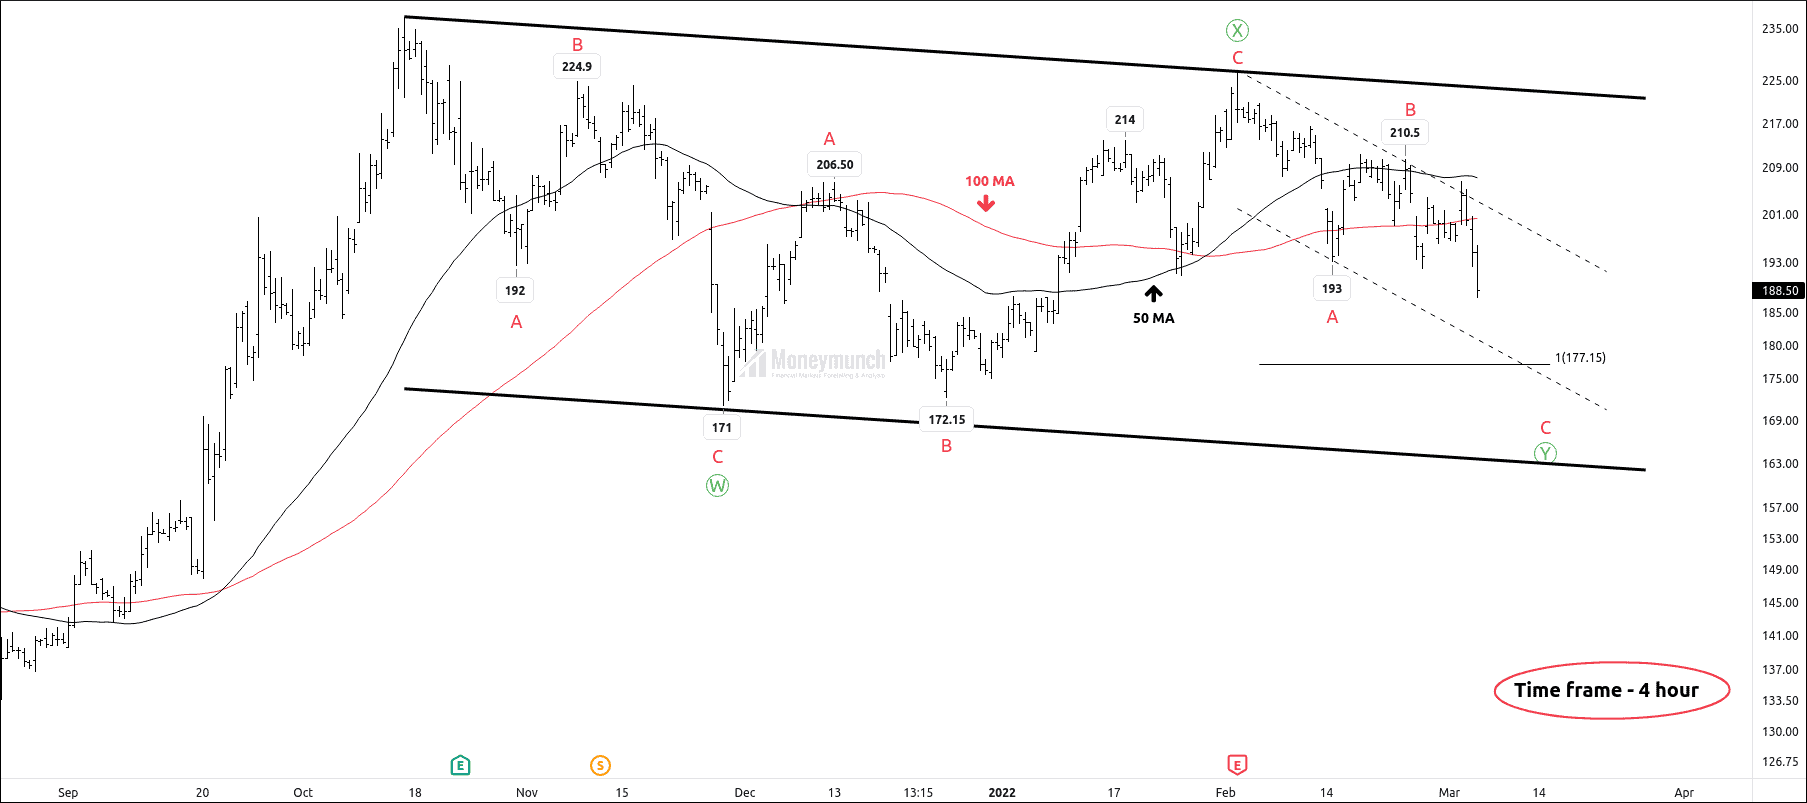
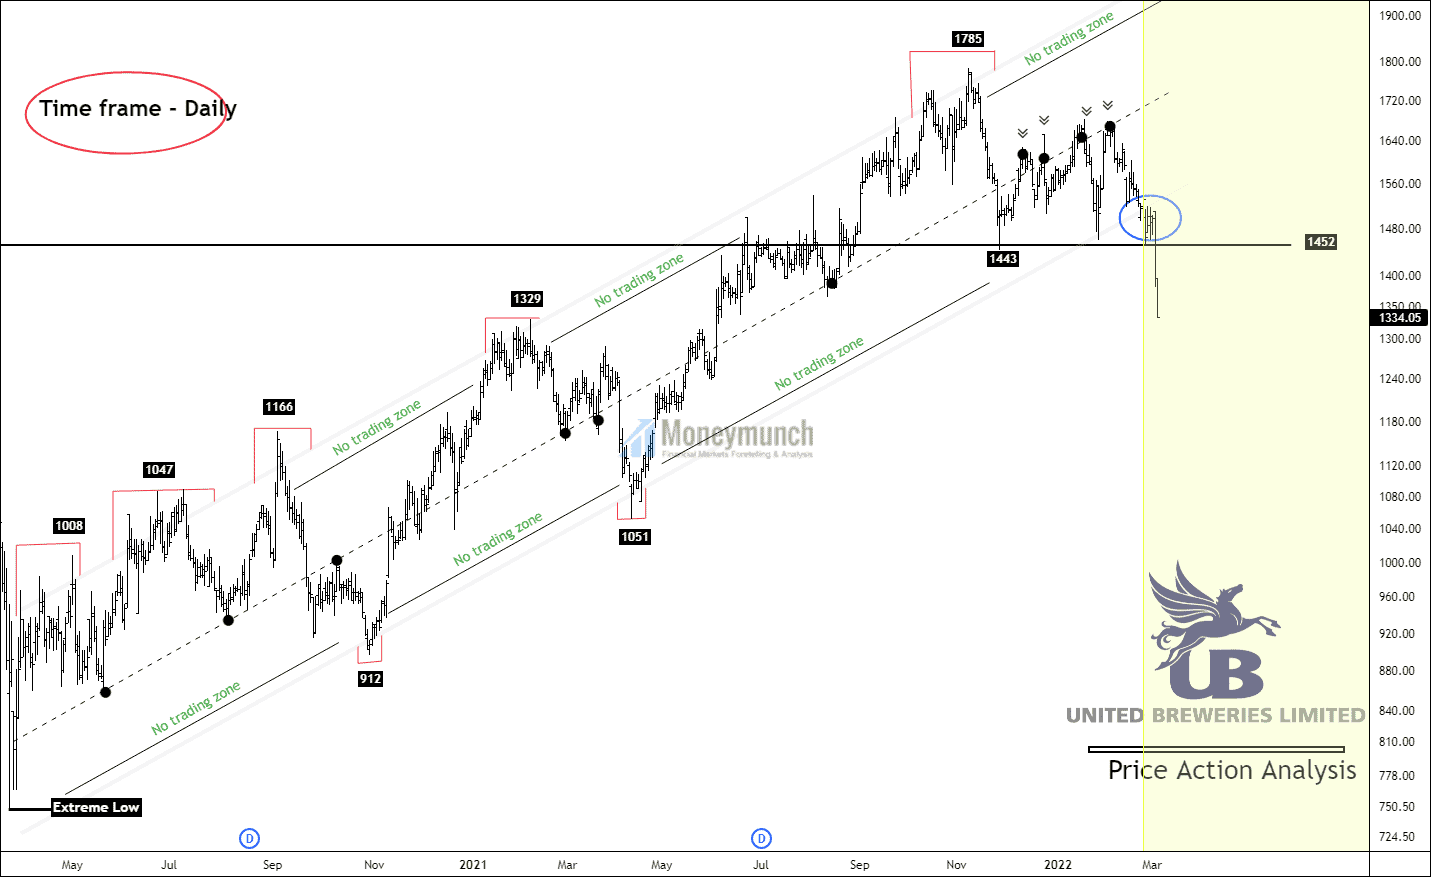
INDHOTEL has accomplished wave B of wave ((Y)) and marching for final wave C of wave ((Y)). Price has broken down wave A at 193, and it is a bearish signal. Wave C can occur at 100% Fibonacci extension at 177 (wave A = Wave B).
However, if the price breaks the level of 177, it may fall for the lower band of the main corrective channel.
Indicator study:
I have used moving averages for confirmation. Price has broken down the 50 MA & 100 MA. It is a bearish signal.
NSE Coal India Bearish Again Rejected At the Resistance
Coal India has failed to break SEP 2021 high. And it took a reversal from the level of 197.75. Here, selling pressure is increasing due to speculators. We may see the following targets on Monday’s trading session: 177 – 172 – 165.
Invalidation level has an important role here because that will change the direction of stock from downtrend to uptrend.
 Unlock This Article