
Preface:
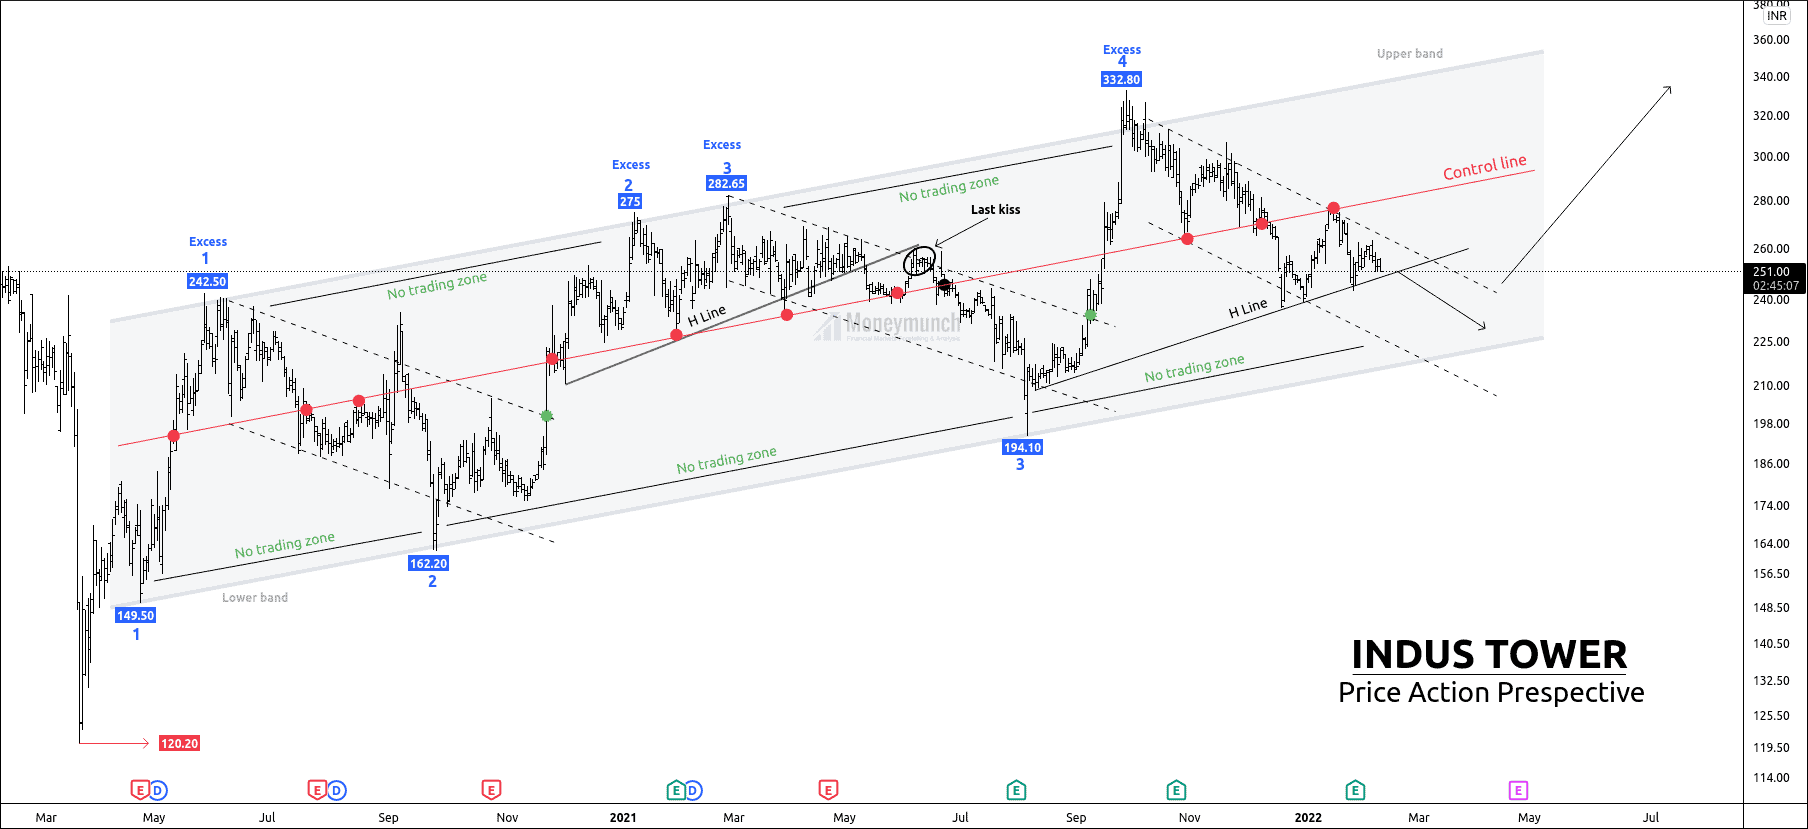
Alright, the operation started after creating an extreme low at 120.20. Price has created an upward channel from the extreme low, where the equilibrium has occurred between bull and bear traders. Control line has given eleven touches, which shows the strong gravitation at the middle.
Here, we can see four reversals on the upper band, and three reversal points occurred on the lower band.
We have two opportunities:
1. Now, the price is on the H-line, and the breakout of the h line indicates the lower band touch.
2. Bull can buy at excess, or they can enter at reappearing in the value area for the target of the control line.
Every beginner who wants to start trading with naked strategy (without indicator) can use this method because the price is the thing that will pay you.
Let me explain to you important aspects of the breakdown strategy.
Value area:
A zone in which bulls and bears both are satisfied to stay within it.
In this zone, supply and demand equally exist.
Value area has two bands:
1. Upper band
2. Lower band
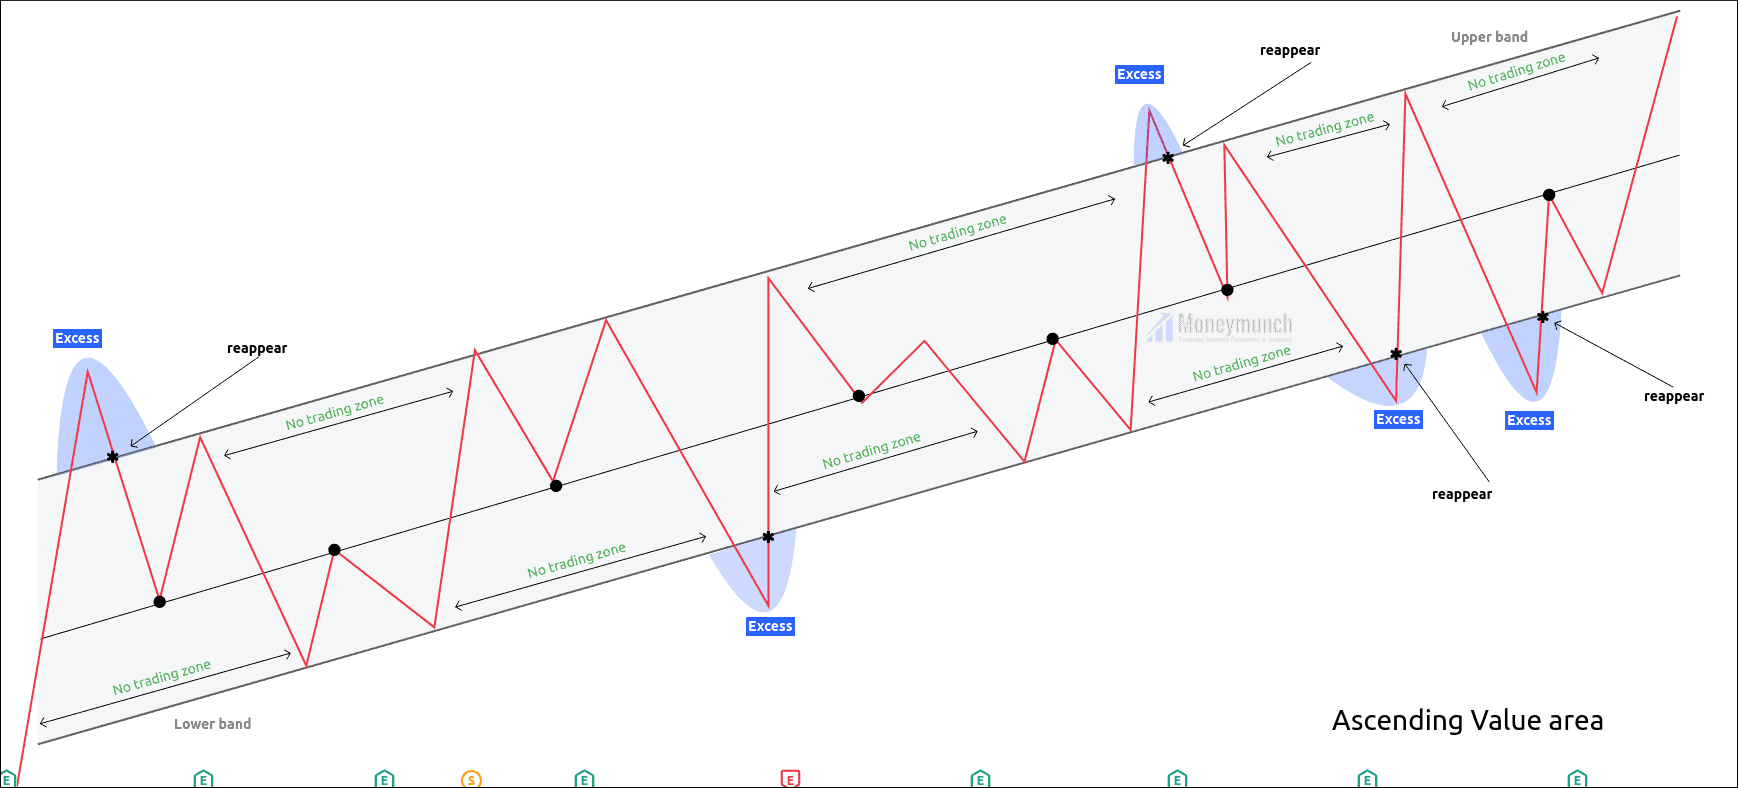
Ascending Value area:
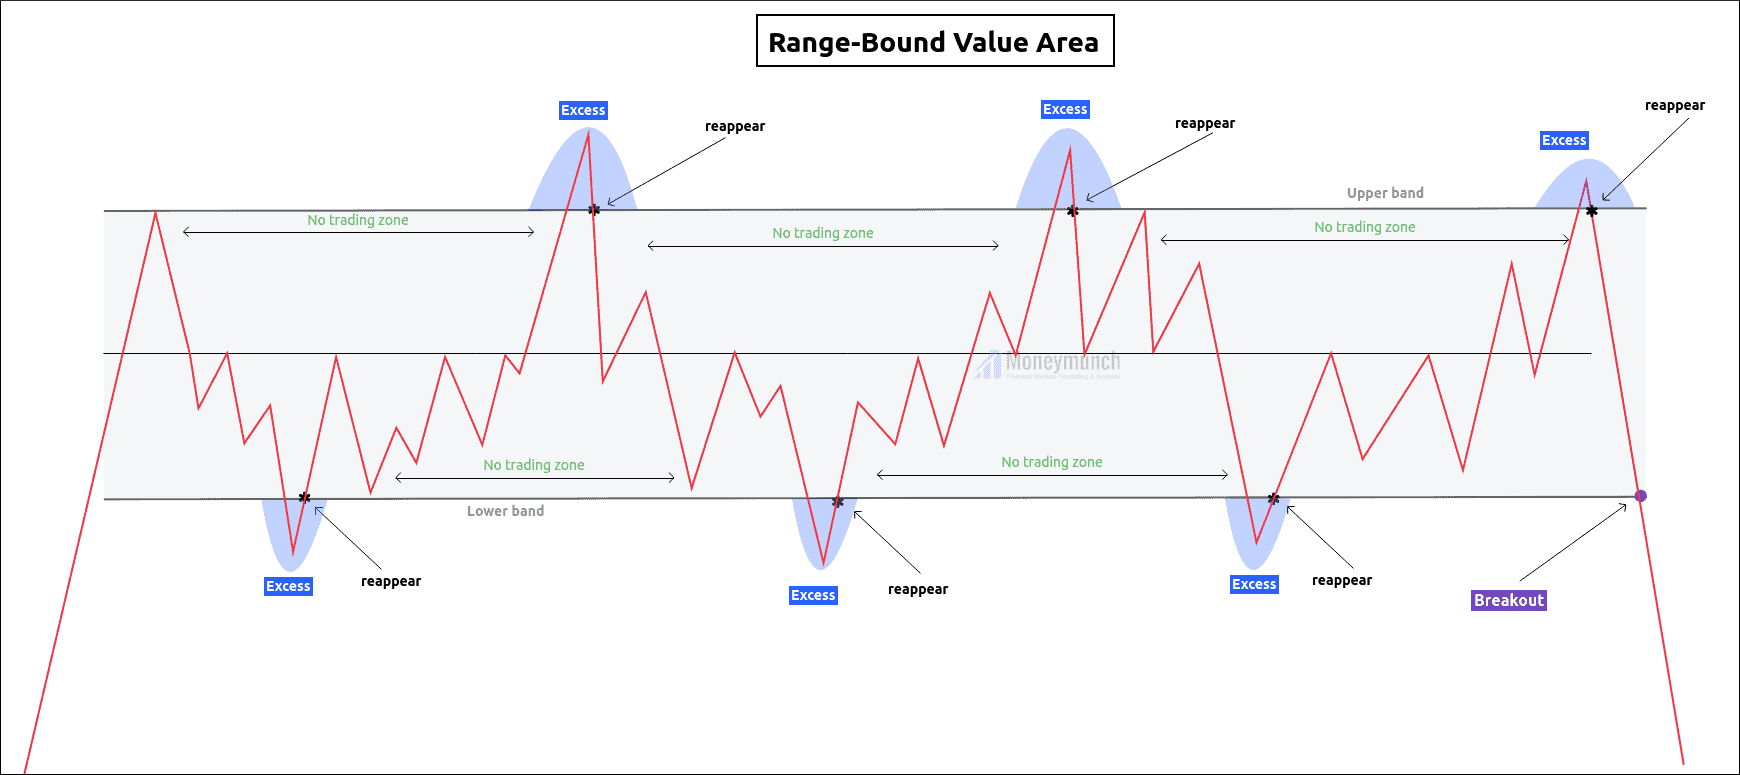
Range-Bound Value area:
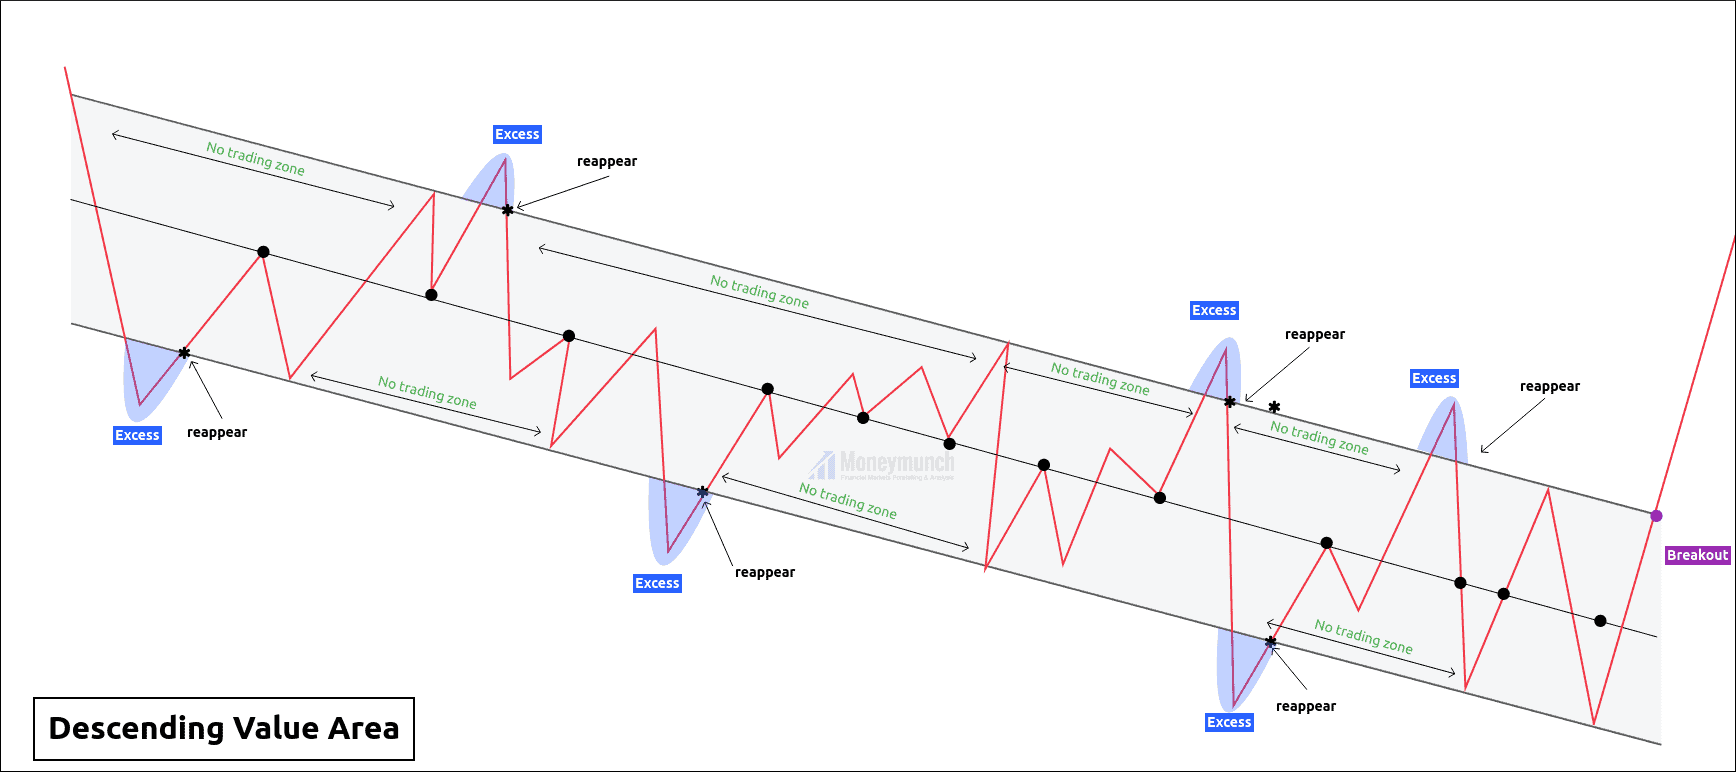
Descending Value Area:
Upper band:
Upper band indicates demand-supply.
In this chart, the price has taken four reversals from the upper band to maintain the equilibrium.
The upper band put a stop to the bull power.
Lower Band:
The lower band indicates demand pressure.
In this chart, the price has taken three reversals from the lower-band to maintain the equilibrium.
The lower band put a stop to bear power.
No trading zone:
In order to respond to either bull or bear’s initiative, the price creates an area. In which no trading activities have taken.
It helps to find the weakness of any particular move.
H Line.
After completing the last share move, the price creates the bulk trading activities, where bulls’ power becomes dull.
Breakout of the H-line indicates the cease of the particular move.
Excess:
Excess is regret and fake-out.
In simple words, price breaks the upper band and again re-enter into the parallel channel. Buying or selling at the excess is the perfect deal.
An excess is a signal of reversal.
The psychology behind the control line:
Price is forming in the parallel channel, but bulls are not satisfied with the current trend. That’s why bulls increase demand pressure to break the upper band of the value area. After breaking the upper band, bulls face some problems with profit booking. Now, bulls realize that the price is not going up.
Bulls give up on the thought of trend change.
Bears were watching this patiently. And after they realize that prices are too high, they increase supply pressure above the upper band of the channel. Now bulls are out of the market, and the seller has maintained the equilibrium & Vice versa.
Control line:
The Control line is the gravitation point of any value area. We can draw by connecting the reversal points in the middle.
The more the points are available, the higher the effectiveness.
Please note that the price can not stay away from the control line of the value area. We can use it as a price target or breakout trade.
Here, the price has given eleven touches on the control line.
Breakout or breakdown of the channel:
Bulls and bears both disagree with the current price trend.
Either bulls or breaks out the value area by giving consistent closing.
It often happens after a complex correction or trend change.
 Unlock This Article
To become a subscriber, subscribe to our free newsletter services. Our service is free for all.
Get free important share market ideas on stocks & nifty tips chart setups, analysis for the upcoming session, and more by joining the below link: Stock Tips
Have you any questions/feedback about this article? Please leave your queries in the comment box for answers.
Beautiful job
It works, it just needs to finish the candle to print.
thanks for your great work. good luck