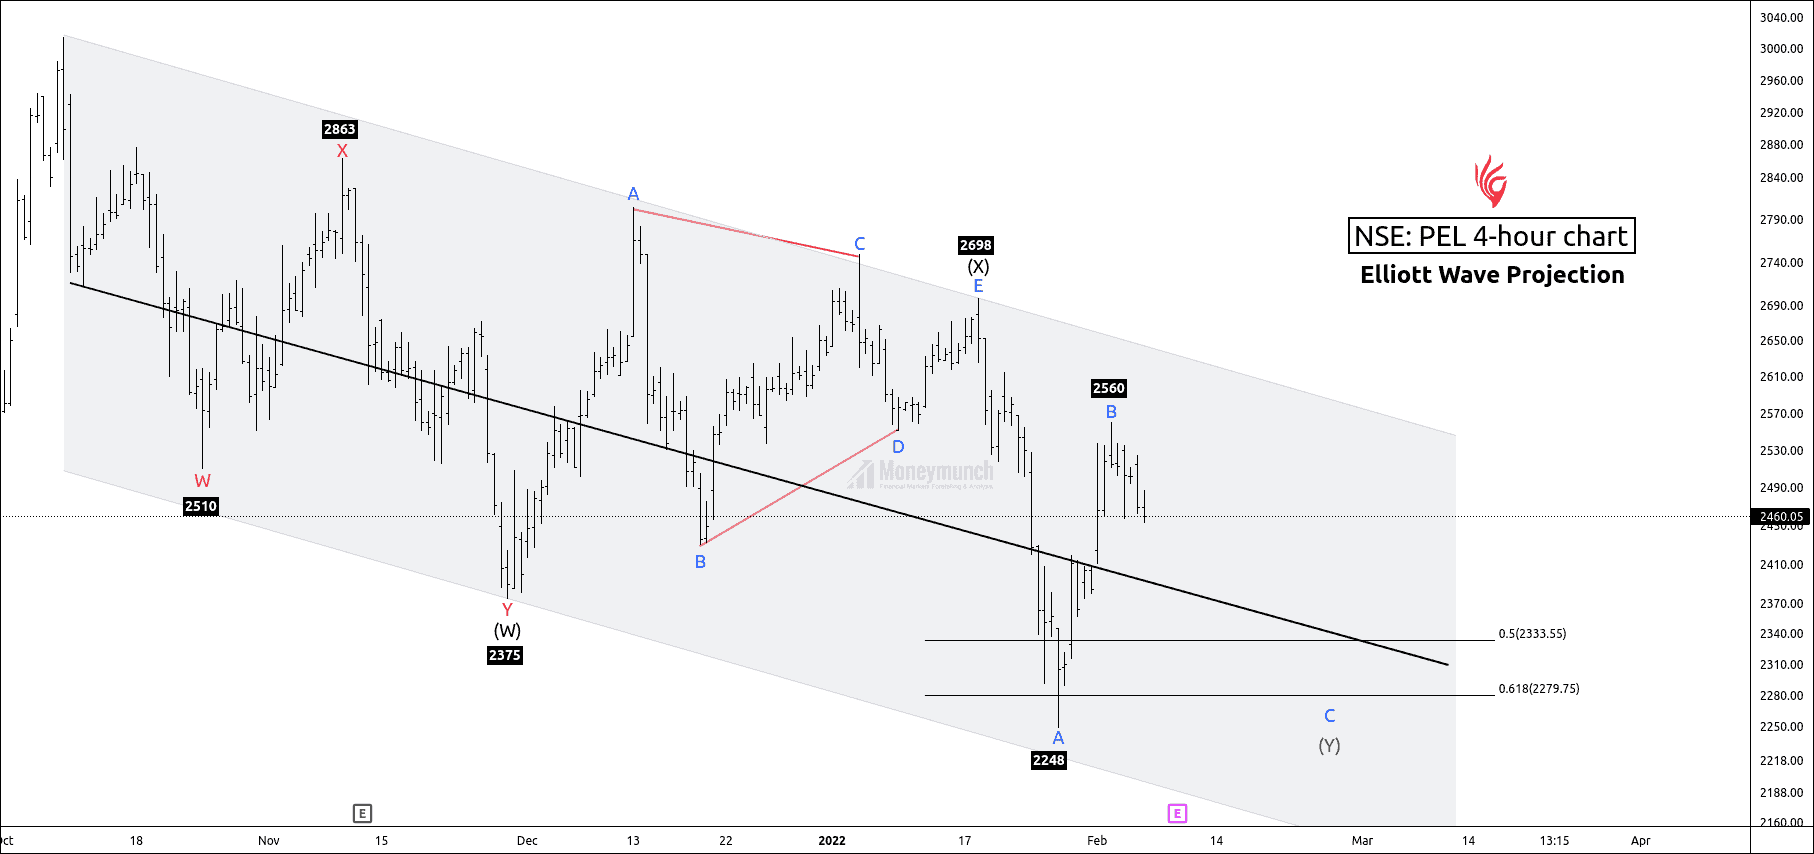
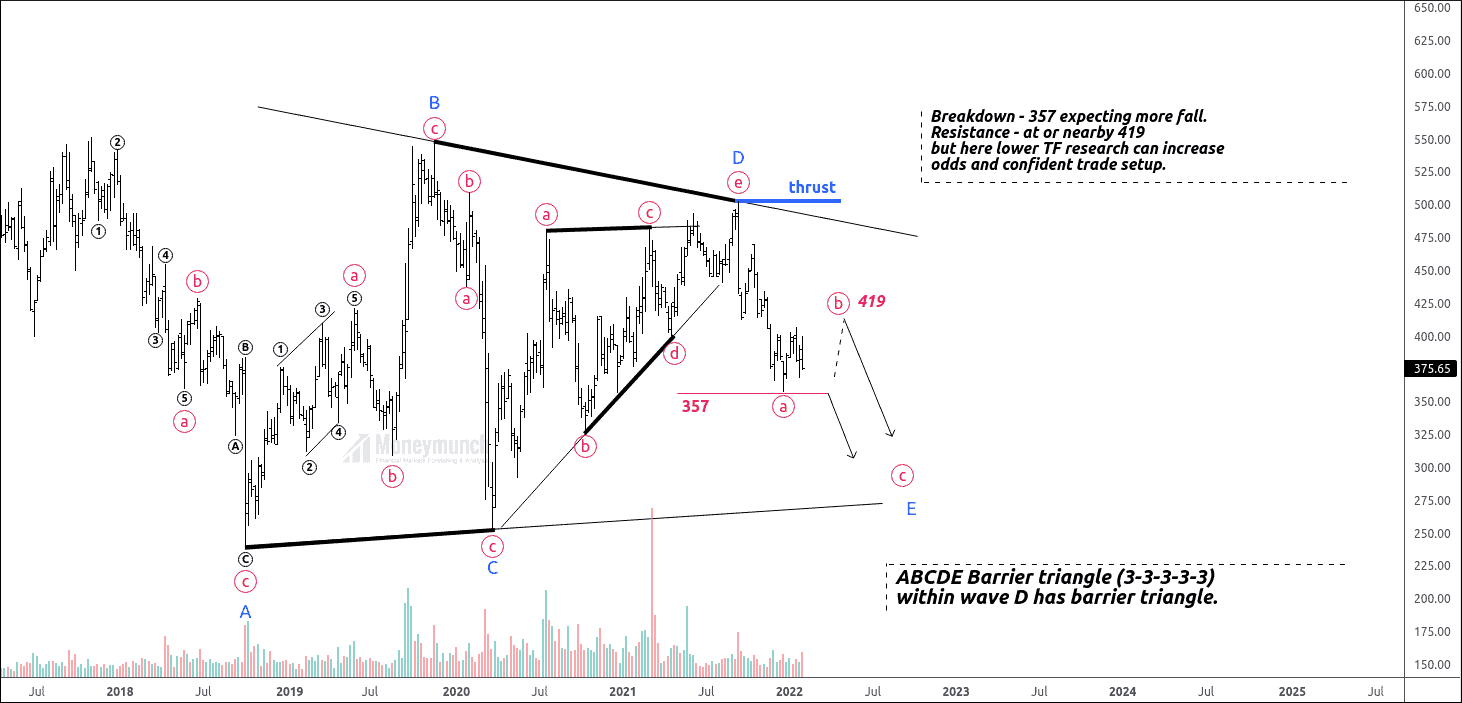
NSE – Nifty Tips & Update

Before:

Free nse nifty chart calls

Price was out of the value area, and It has given 78.6% retracement of the previous move.

To maintain equilibrium, However, price should enter into the value area.

The lower band indicates a crucial demand zone. But if the price fails to break the lower band, supply will exceed the demand.

Click here to read previous research report.

After:

Free nse index nifty 50 chart analysis and tips

Price has entered into the value area, and price surged to the control line, which is the controller of any particular trend move.

I have mentioned it in bold words,” At this juncture, the price has entered the value area. The lower band indicates the demand pressure. The price will surge towards 17369- 17487-17612.

28th January 2022: 

12:15 PM – Price entered into the value area. The first target of 17369 has reached, and the price has made a high of 17373.

1st February 2022: 

9:15 AM – Price has reached the second target of 17487.

12:00 PM – Price reached the final target of 17612.

To become a subscriber, subscribe to our free newsletter services. Our service is free for all.

Continue reading

EWT: Will Crude Oil Reach 7000?

Free mcx crude oil chart tips

Crude oil is forming impulsive waves ((5)).

After the completion of wave ((3)), the price had started complex running flat of the corrective wave ((4)).
Wave B has crossed the high of wave ((3)), but wave B couldn’t break the low of wave A.

Price has made a failure of swing low, which was a rejection of a downtrend, and crude oil gained momentum.
Price has exceeded the sub-wave B of wave ((4)).

Sub-wave 4 of wave ((5)) is in progress.

If their price breaks out the high of wave 3, we can expect the following target for final sub-wave 6697-6785-6865+. It means the price has bullish sentiments above wave three and vice versa.
Breakout of the parallel channel shows the weakness of the impulsive wave. Note that wave four can never overlap the starting point of wave 1.

To become a subscriber, subscribe to our free newsletter services. Our service is free for all.

Get free MCX ideas, chart setups, and analysis for the upcoming session: Commodity Tips

Have you any questions/feedback about this article? Please leave your queries in the comment box for answers.

Disclaimer: The information provided on this website, including but not limited to stock, commodity, and forex trading tips, technical analysis, and research reports, is solely for educational and informational purposes. It should not be considered as financial advice or a recommendation to engage in any trading activity. Trading in stocks, commodities, and forex involves substantial risks, and you should carefully consider your financial situation and consult with a professional advisor before making any trading decisions. Moneymunch.com and its authors do not guarantee the accuracy, completeness, or reliability of the information provided, and shall not be held responsible for any losses or damages incurred as a result of using or relying on such information. Trading in the financial markets is subject to market risks, and past performance is not indicative of future results. By accessing and using this website, you acknowledge and agree to the terms of this disclaimer.

Nifty Outlook: Is This The End Of The Bull Market?

Free nse nifty chart calls

After breaking the parallel channel, the price entered the value area.

Price has started a seller initiative by going out of the price zone.
Buyers responded more to sellers’ initiatives with an excess.

At this juncture, the price has entered the value area.
The lower band indicates the demand pressure.

If the price does not stay above the lower band at 17250, it could move downwards to the lower levels – 16628-16410, because the price didn’t break the 78.6% level.
Otherwise, the price will surge towards 17369- 17487-17612.

Note that if the price does not break the control line, it can not reach the upper band.

To become a subscriber, subscribe to our free newsletter services. Our service is free for all.

Continue reading

Nifty Outlook: Will the seller crash the remaining bull?

Free nse nifty chart calls

Nifty is occurring a corrective wave ((iv)) on the hourly timeframe chart.
It has broken the previous corrective (iv) of a lower degree and price fall to 17377.

The bullish scenario is valid till the price is above 17150.
According to the Elliott wave principle, wave ((iv)) can never enter the price territory of wave ((i)).

Wave ((iv)) has retraced 78.6%, and it can’t retrace more than 78.6% if there is a bull power on the other hand. If the nifty breaks 78.6% at 17156, it will also break the invalidation level point of 17150.

Nifty is creating a downtrend channel, where bull power has controlled by sellers.
If the price breaks out of the channel downtrend, we can see a sharp upward move soon.
However, nifty has to confirm its bull run by breaking the breaking supply zones.

No bullish scenario without breakout of the parallel channel.

If the price breaks the downtrend channel, trader can buy for the following targets of 17435-17618-18125

To become a subscriber, subscribe to our free newsletter services. Our service is free for all.

Continue reading

Nifty Outlook – Will the bulls cease the falling knife of Nifty?

Free nse nifty chart tips

Price Action Perspective:
Price is creating a value area where supply and demand are equal.
The control line of the value area has provided eight price touches to confirm the price move, and it has provided five reversals.

In this view, Nifty is on the control line of the value area at 17615. Price has drawn a doji candle on the control line.
There are seven pieces of evidence of a reversal on the control, so the level of 17615 becomes a key level for traders.

In addition, nifty often gives a gap-up after every powerful doji candle. If it has the potential to reverse the price, nifty can reverse with gap-up. (You can see green circles in the chart)

Conclusion:
If Nifty could not sustain above the control line, it would start a downward movement till the lower band of the price area. Price seems strong above the control line, and if the price sustains above 17614, we may see a low 17760-17914-18123+.

Important scenario to look at:

Global Scenario:
– Interest rate hike on the card;
– QE is ending;
– Tapper is in plan;
– Earnings are not as expected;
– Demand getting slow;
– Uncertainty in Russia to US over Ukraine;
– KSA and Yemen issue; and
– Many of growth stocks in US are at 52W low; and
– (Minus) 4.1 World GDP

Indian Scenario:
– Reliance shows exception results;
– IT disappointed;- Banking Insurance Realty doing fine;
– Budget is on the cards. Further, it is expected great expending by the GOI in projects to boost economy.
– GOI to push Make in India;
– FII selling DII buying (SIP and Retail participants investing)

To become a subscriber, subscribe to our free newsletter services. Our service is free for all.

Continue reading

EWT: Bigger Picture Analysis Of JK Laxmi Cement

free nse stock jklaxmi chart calls

JK Laxmi cement has accomplished impulsive wave ((3)) and has a complex correction of wave ((4)).
After making a high of 816, the price started forming a corrective channel for wave ((4)).
It has made a low of 529.10, and we can see a price surge to 630.

However, the price reached the upper band of the channel, but it is facing dynamic resistance of the parallel channel.
If the price does not break the parallel channel, we will consider it a lower high(LH).

Wave (4) retraced 38.2%, which is the common retracement.
Before starting a bull trend, the price will create public participants, which can be possible after a retracement. Retracement is nothing but a pullback for bull traders.

If the price rejects from the upper band of the channel, it can come down to 61.8- 78.6%.
After the rejection, if the price reverses from the control line, trader can initiate a buy position for 580-635-678-700+

Note, Safe traders should buy after the clear breakout of the parallel channel. We are not interested in buying before a new lower high, which gives a signal of demand zone.
Breaking down the control line will create a new lower low, which can go up to the upper band or 50%- 61.8%.

To become a subscriber, subscribe to our free newsletter services. Our service is free for all.

Continue reading