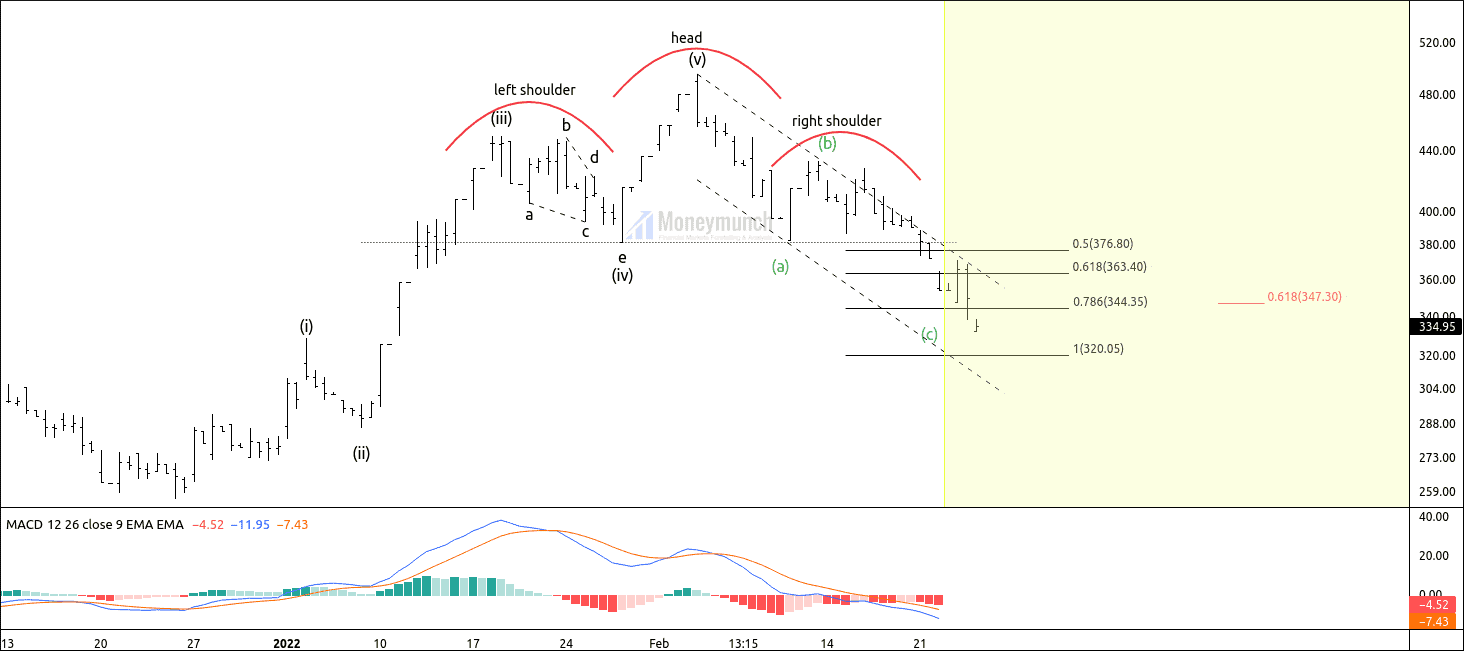
NSE Apollo Hospital Is Preparing The Last Leg Of Correction

Price Action Analysis

Free nse stcok apollohos price action tips

Apollo hospital is currently forming on the downward channel.

After creating the highest high of 5993, Apollo hospital couldn’t break this level, and supply exceeded the demand.

Price has begun creating lower highs and lower lows to confirm its bearish run.

Excess:

In this channel, we have four price excess. Excess is a signal of a sharp reversal. It indicates that the price can go more in current. Either bulls or bears have to step back to maintain equilibrium.

Excess 1: 5993

Excess 2: 4643

Excess 3: 4150

Excess 4: 4722

H-Lines:

Price has created two h – lines. H-top line holds the bulk of trading activities. After breaking H-lines, it can give a sharp move. It also works as dynamic support and resistance.

No trading zone:

No trading zone indicates negligible trading activities.

Here, traders are not interested in trading decisions.

Price has created five no trading zones.

Upper band & Lower band:

The upper band is the dynamic area where supply exceeds demand. The upper band provides resistance to the price. But, If the price breaks the upper band, the price will likely continue the current trend.

The Lower band is the dynamic area where demand exceeds supply. The upper band provides support to the price. But, If the price breaks the lower band, the price will likely continue the current trend.

Perspective:

Currently, the price is on the upper band of the parallel channel.

The price has created an excess (4724) on the upper band of the channel, which indicates.

If the price sustains under the upper band of the channel, Traders can trade for the following targets: 4401-4345- 4208 and more.


If the price breaks the previous lower high, it can change the trend by making a new high.

Elliott Wave Projection:

Free nse stock apollohos wave tips

Apollo hospital has formed a triple zigzag, and wave (X) of complex correction has completed at 4794.

Wave (W): 4643

Wave (X): 5141

Wave (X): 4150

Wave (Y): 4794

Wave (Z): –

We are riding the sub-wave C of wave (Z) of a complex correction.

Traders can enter a short position after a pullback for the mentioned target of 4401-4345- 4208.

To become a subscriber, subscribe to our free newsletter services. Our service is free for all.

Alternative Count

If the supply fails to break the lower low of the Wave(Y), We can follow the alternative Count.

Continue reading

NSE 3MINDIA Bearish Mode Activated

Free nse stock 3mindia daily chart calls

Basic Tenets:
Elliott waves are famous for finding crowd behavior trends and reverses in recognizable patterns. Elliott’s wave principle is inspired and made from the Dow theory, which is the foundation of the technical analysis.

Elliott’s wave principle consists of eight waves.
In this eight wave, price forms two types of wave structure,

1. Motive structure:
– Five Wave Pattern.
– Moves with the primary/main trend.
– Labeled in Numerical method (1,2,3,4,5).

2. Corrective structure
– Three Wave Pattern.
– Moves against the primary/main trend.
– Denoted in alphabetical method (A, B, C).

Now, let’s look at the 2-day chart of 3MINDIA.

Timeframe: 2 day
Price has accomplished the impulsive wave (3) and started forming corrective wave (4) by breaking sub-wave iv of wave 5 of wave (3).
Currently, the price is in corrective mode.

Sub-wave 5 of wave (3) has ceased, the terminating wave v of ending diagonal. Price has broken down the corrective wave iv at, 22590, which signals bearish sentiments. After breaking the main channel, the price started falling sharply.

Calculation of wave (4):
The common retracement of wave 4 is 38.2% of wave 3.
Wave 4 can never retrace more than 61.8% of wave 3.
Wave 4 occurred near sub-wave 4 of lower degree.

Timeframe chart: 4-hour

Price has broken down the sub-wave iv of the ending diagonal of wave 5.
After the pullback, if the price sustains below, 22590, it is likely to give a big move below the parallel channel.

Traders can initiate a short position for the following targets of 21010-20557.

To become a subscriber, subscribe to our free newsletter services. Our service is free for all.


Continue reading

NSE GPIL & PEL Sellers Crushed Buyers

PEL: PIRIMAL ENTERPRISE

Before:

free stock market nse pel chart calls

PEL has formed a double three corrective structure. Price had completed wave B of complex correction W-X-Y.

As the price formed in the downward channel and the Y wave was to cease, the price had bearish sentiments.

I had mentioned in clear words,” Traders can initiate short positions for the following targets: 2400 – 2376 – 2301 – 2279.”

After:

Free nse stock pel tips

8 February:

Price reached the first target of 2400 and made a low of 2996.

14 February:

Price reached the 2nd target at 2376.

Price reached the 3rd target at 2301.

Price reached the 4th target at 2279.

GPIL: Godawari Power

Before:

Free nse gpil chart tips

PEL has formed a downward corrective structure. Price was at the upper band of the parallel channel.

The upper-band indicates supply pressure where sellers exceed buyers.

The price has provided two successful rejections from the upper band.

GPIL had bearish the sentiments.

I had mentioned in clear words,” The trader can initiate a short position for the following targets: 313 – 304 – 290.”

After:

Free nse stock gpil chart tips

At the upper band, the price couldn’t break the upper band of the parallel channel.

14 February: GPIL reached the First target of 313.

15 February: GPIL reached the second target of 304.

What’s next?

Price is at the lower band of the parallel channel. And if the price breaks down the minor parallel channel, it can travel up to the control line of the downward channel.

To become a subscriber, subscribe to our free newsletter services. Our service is free for all.

Continue reading

NIFTY FUT Trade Setup For Subscribers

To become a subscriber, subscribe to our free newsletter services. Our service is free for all.

Continue reading

UBL FUT Trade Setup For Members

To become a subscriber, subscribe to our free newsletter services. Our service is free for all.

Continue reading

The Ultimate Price Action Breakdown Strategy

Free nse stock industower chart calls

Preface:

Alright, the operation started after creating an extreme low at 120.20. Price has created an upward channel from the extreme low, where the equilibrium has occurred between bull and bear traders. Control line has given eleven touches, which shows the strong gravitation at the middle.

Here, we can see four reversals on the upper band, and three reversal points occurred on the lower band.

We have two opportunities:

1. Now, the price is on the H-line, and the breakout of the h line indicates the lower band touch.

2. Bull can buy at excess, or they can enter at reappearing in the value area for the target of the control line.

Every beginner who wants to start trading with naked strategy (without indicator) can use this method because the price is the thing that will pay you.
Let me explain to you important aspects of the breakdown strategy.

Value area:

A zone in which bulls and bears both are satisfied to stay within it.
In this zone, supply and demand equally exist.

Value area has two bands:

1. Upper band

2. Lower band

Ascending Value area:

Free nse stock industower A chart calls

Range-Bound Value area:

Free nse stock industower RB

Descending Value Area:

Free nse stock industower D chart calls

Upper band:

Upper band indicates demand-supply.
In this chart, the price has taken four reversals from the upper band to maintain the equilibrium.
The upper band put a stop to the bull power.

Lower Band:
The lower band indicates demand pressure.
In this chart, the price has taken three reversals from the lower-band to maintain the equilibrium.
The lower band put a stop to bear power.

No trading zone:
In order to respond to either bull or bear’s initiative, the price creates an area. In which no trading activities have taken.
It helps to find the weakness of any particular move.

H Line.
After completing the last share move, the price creates the bulk trading activities, where bulls’ power becomes dull.
Breakout of the H-line indicates the cease of the particular move.

Excess:

Excess is regret and fake-out.

In simple words, price breaks the upper band and again re-enter into the parallel channel. Buying or selling at the excess is the perfect deal.

An excess is a signal of reversal.

The psychology behind the control line:
Price is forming in the parallel channel, but bulls are not satisfied with the current trend. That’s why bulls increase demand pressure to break the upper band of the value area. After breaking the upper band, bulls face some problems with profit booking. Now, bulls realize that the price is not going up.
Bulls give up on the thought of trend change.
Bears were watching this patiently. And after they realize that prices are too high, they increase supply pressure above the upper band of the channel. Now bulls are out of the market, and the seller has maintained the equilibrium & Vice versa.

Control line:

The Control line is the gravitation point of any value area. We can draw by connecting the reversal points in the middle.
The more the points are available, the higher the effectiveness.

Please note that the price can not stay away from the control line of the value area. We can use it as a price target or breakout trade.

Here, the price has given eleven touches on the control line.

Breakout or breakdown of the channel:
Bulls and bears both disagree with the current price trend.
Either bulls or breaks out the value area by giving consistent closing.
It often happens after a complex correction or trend change.

To become a subscriber, subscribe to our free newsletter services. Our service is free for all.

Continue reading