 Unlock This Article
Only subscribers can read the full article. Please login to read the entire article.
To become a subscriber, subscribe to our free newsletter services. Our service is free for all.
Continue reading
To become a subscriber, subscribe to our free newsletter services. Our service is free for all.
To become a subscriber, subscribe to our free newsletter services. Our service is free for all.
Before:
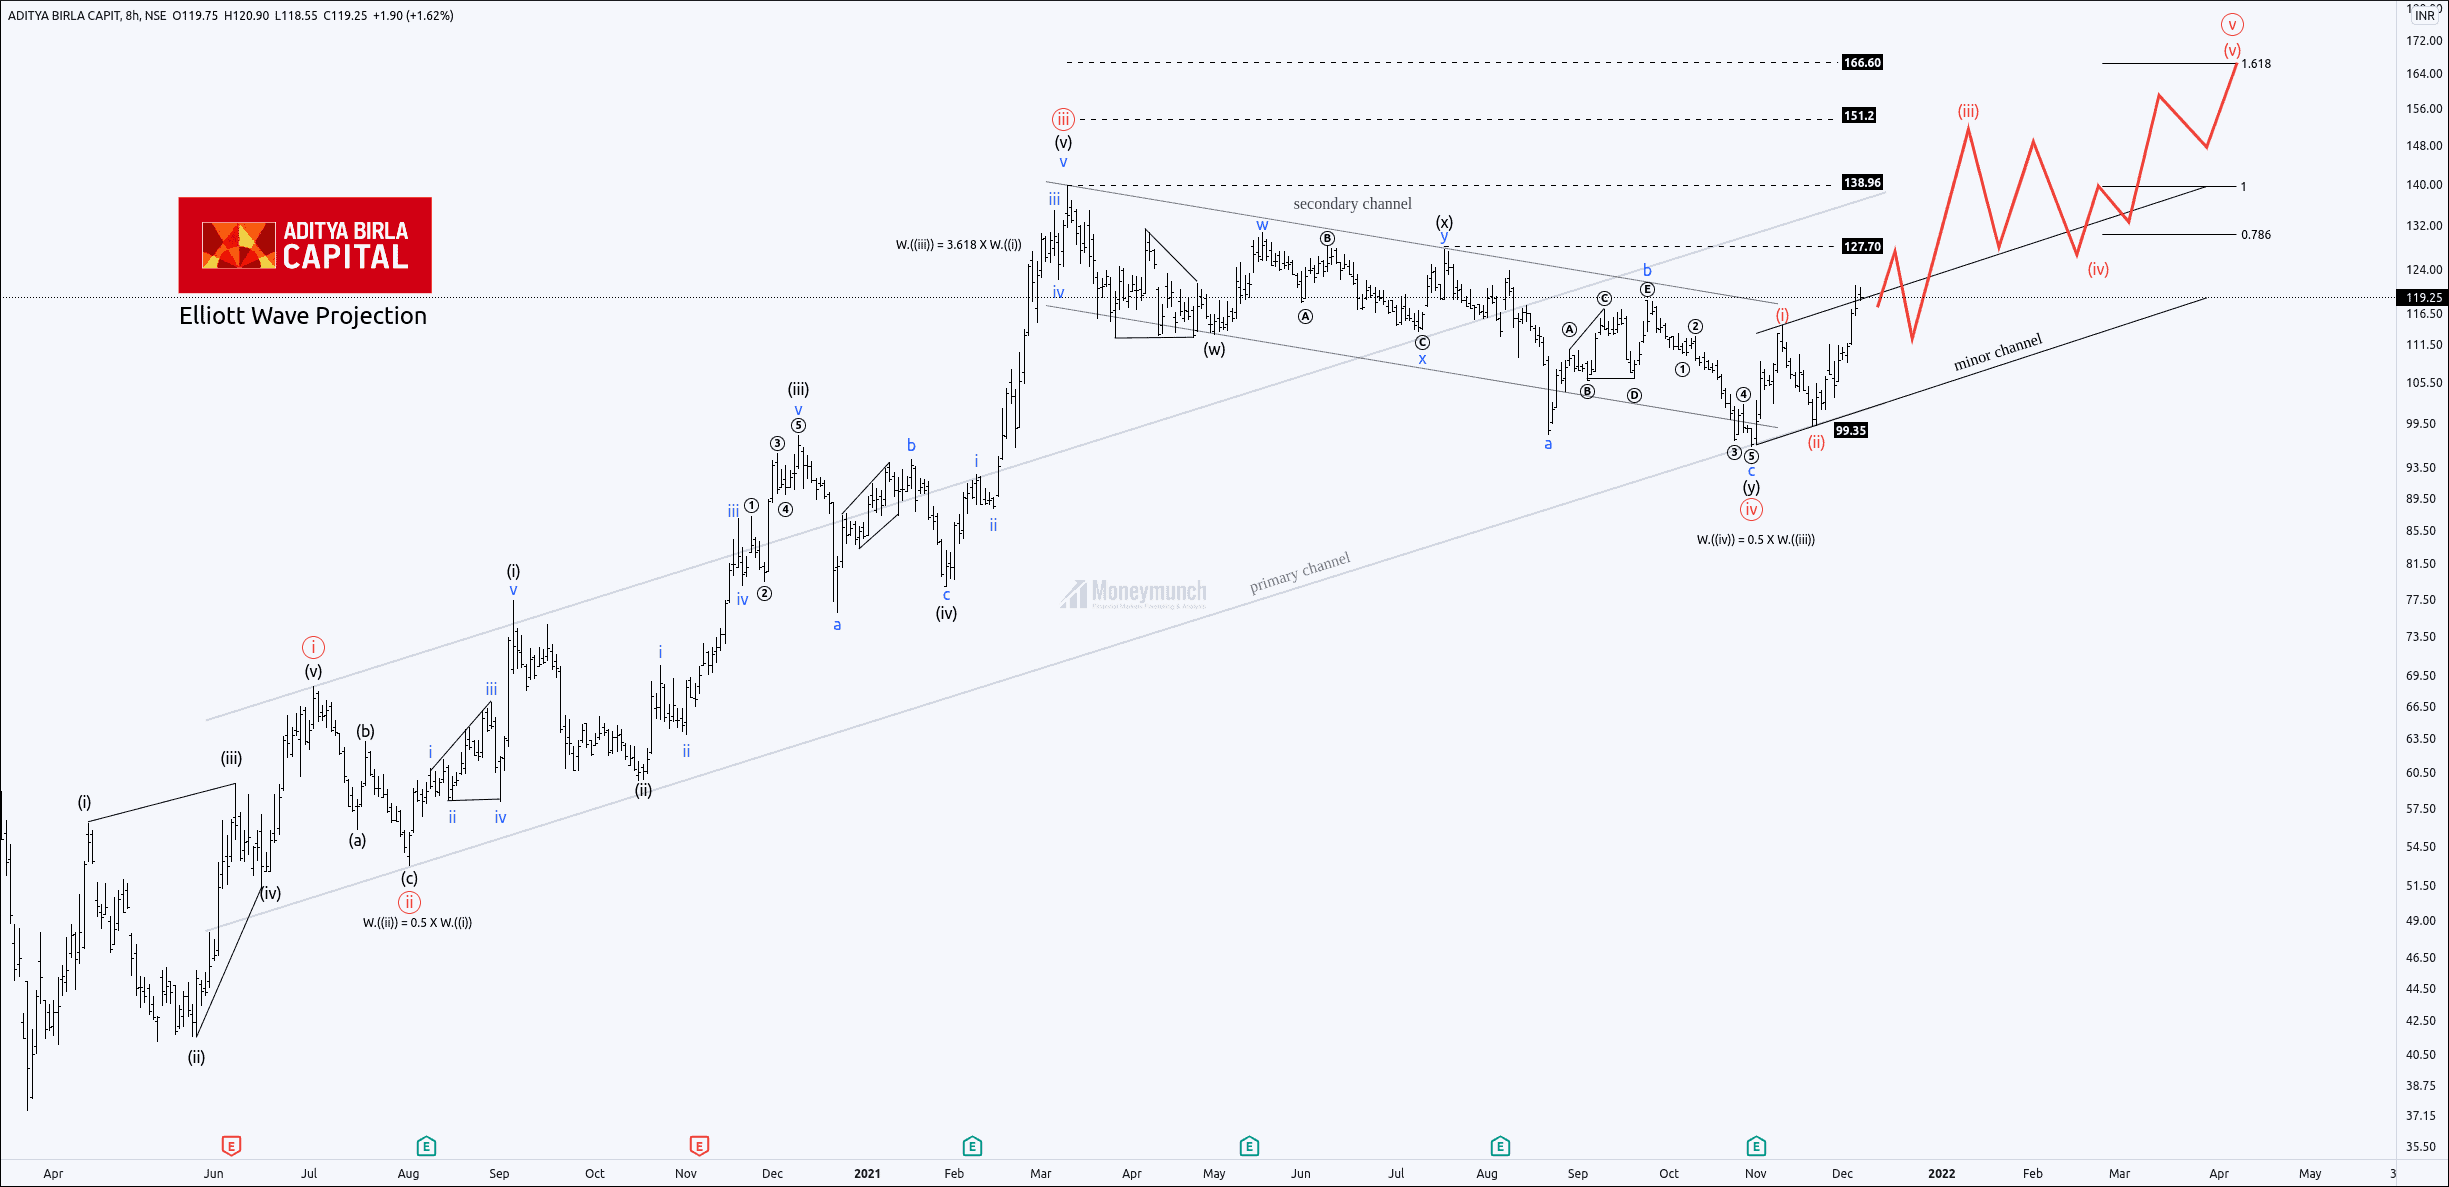
AB capital had completed the double correction w-x-y of wave ((iv)).
Wave ((iv)) retraced 50% of wave ((iii)), which signals that wave ((iv) can be ended anytime.
Successive highs and lows indicate the starting of an uptrend.
In my previous article, I had written in bold words,” We can see the following targets: 127.70 – 138.96 – 151.2 – 165.9+“.
Click here to read previous research report.
After:
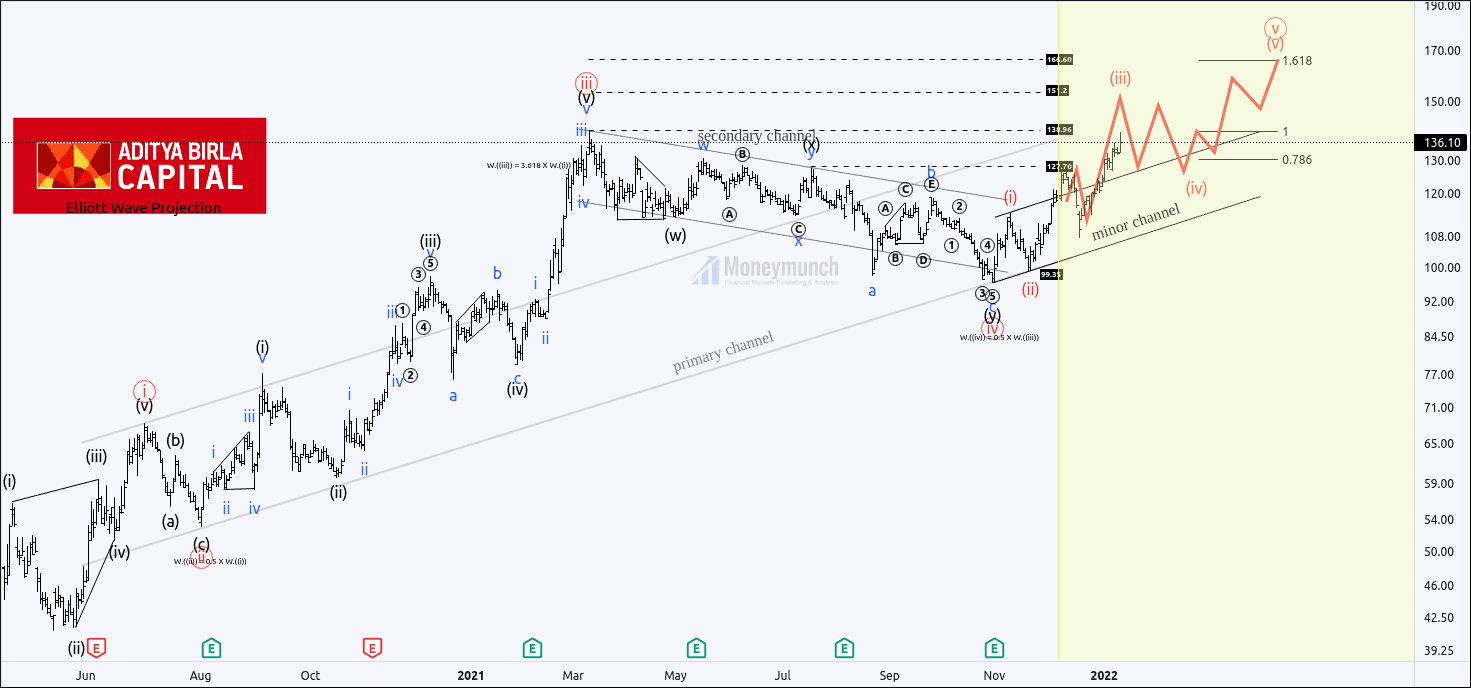
1:20 PM, 3 January 2022, price broke the high of wave (i) and moved out of the minor parallel channel.
AB capital reached the first target of 127.70 and made a high of 132.55. If the price gives a strong close above wave X, it’s a good signal for bulls.
12:35 PM, 11 January 2022, AB capital reached the second target of 138.96, and made a high of 139.20.
To become a subscriber, subscribe to our free newsletter services. Our service is free for all.
Before:
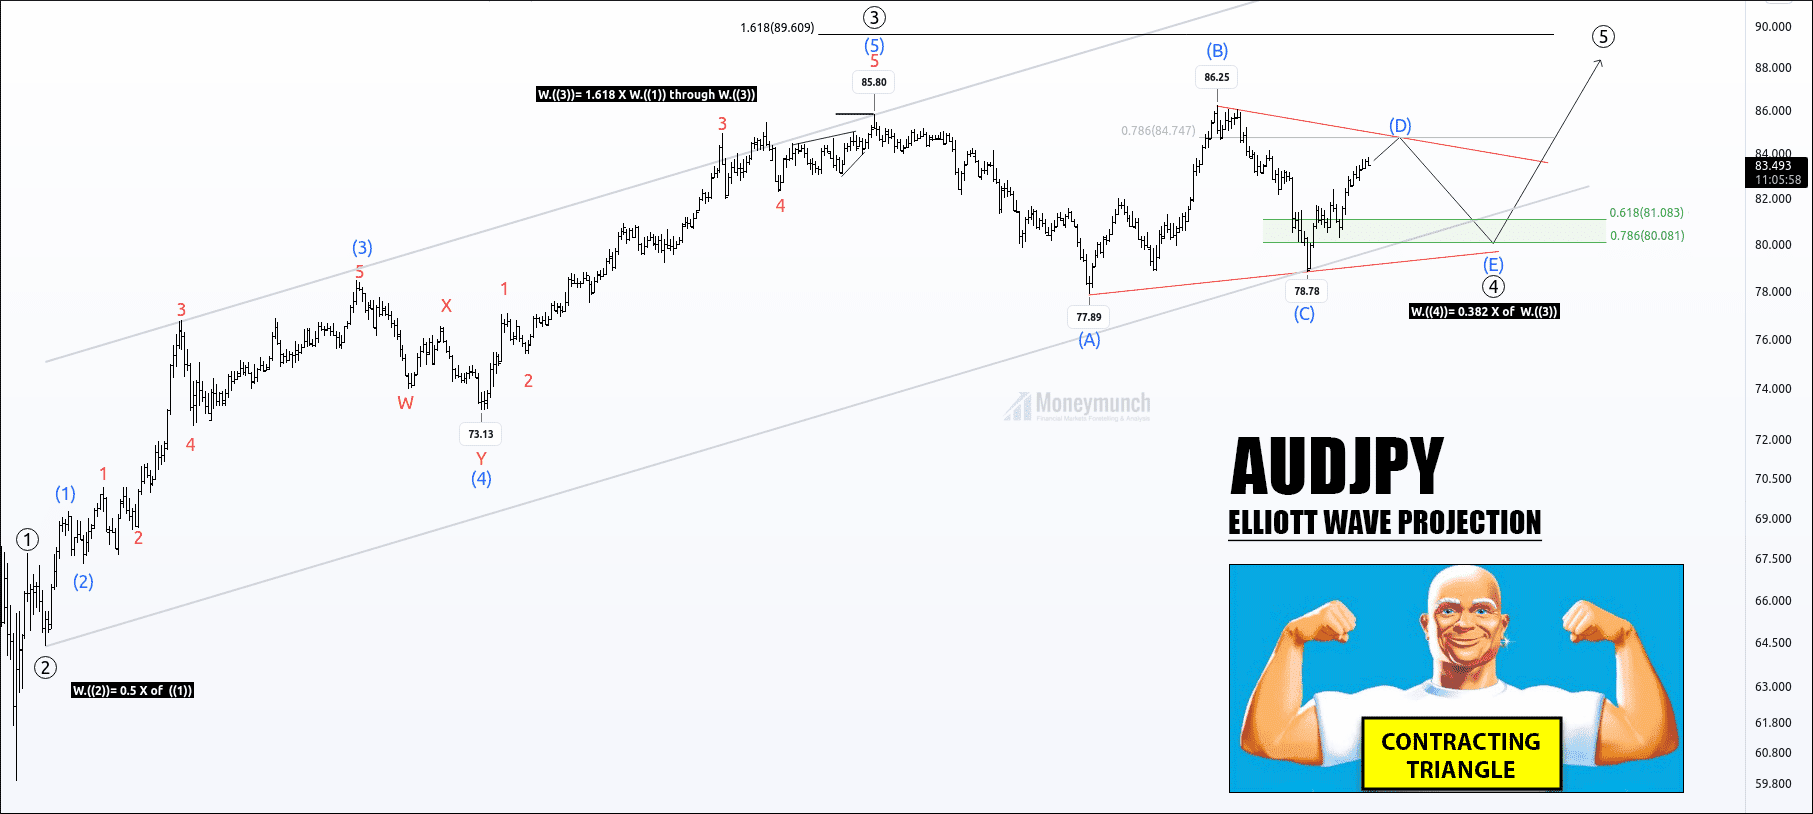
AUDJPY is forming a contracting triangle of corrective wave E.
Wave D was near to accomplish, and the price had bearish sentiments, where it was a beginning phase of wave E.
I had written in clear words, “Wave (E) can complete between 0.618 to .786 Fibonacci levels. That’s why a trader can expect the following targets for wave (E) 83.44-82.50-81.03 as targets of wave E. If you want to trade wave (E), then you should have a trailing stop due to the high volatility of wave (E)”.
Click here to read previous research report.
After:
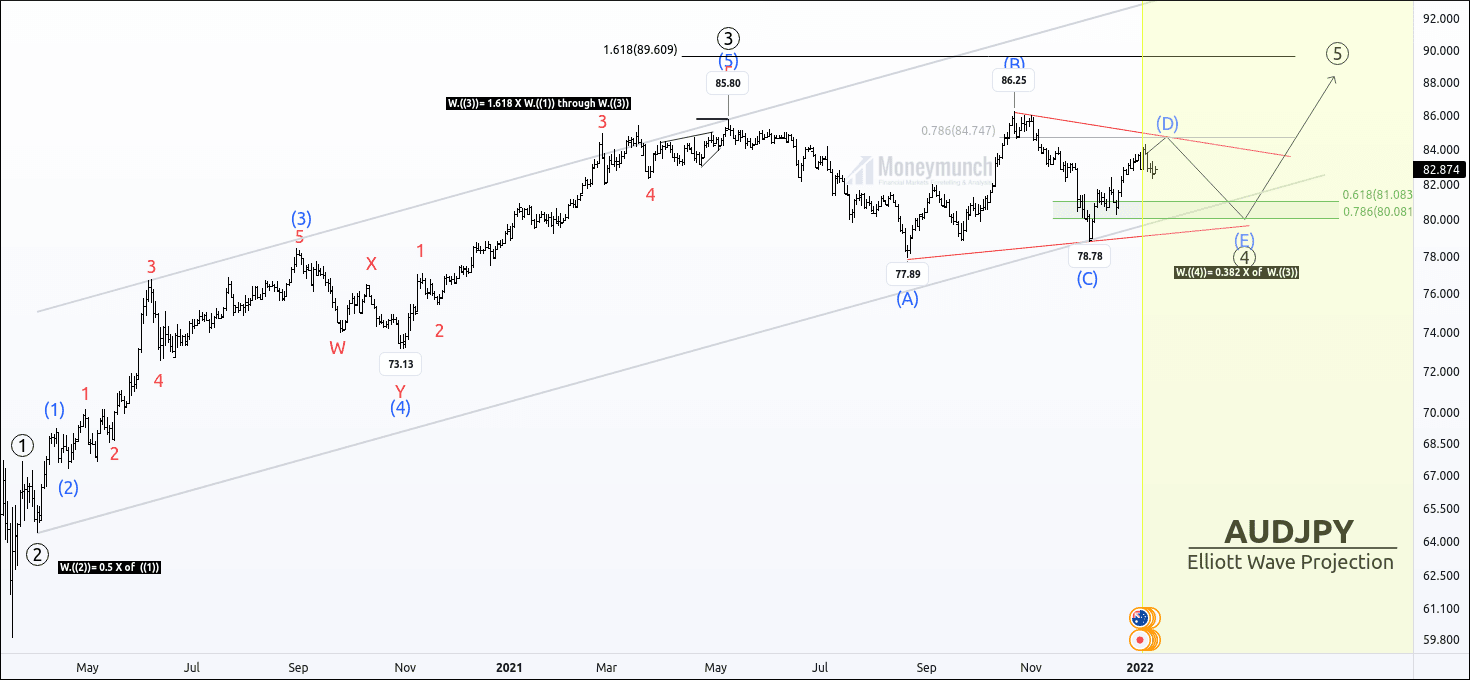
Price has made a high at 84.302.
5 January 2022, the price made reached the first target of 83.44
10 January 2022, the price reached the second target of 82.50. Price had made a recent low of 82.32.
Get free important share market ideas on stocks & nifty tips chart setups, analysis for the upcoming session, and more by joining the below link: Stock Tips
Have you any questions/feedback about this article? Please leave your queries in the comment box for answers.
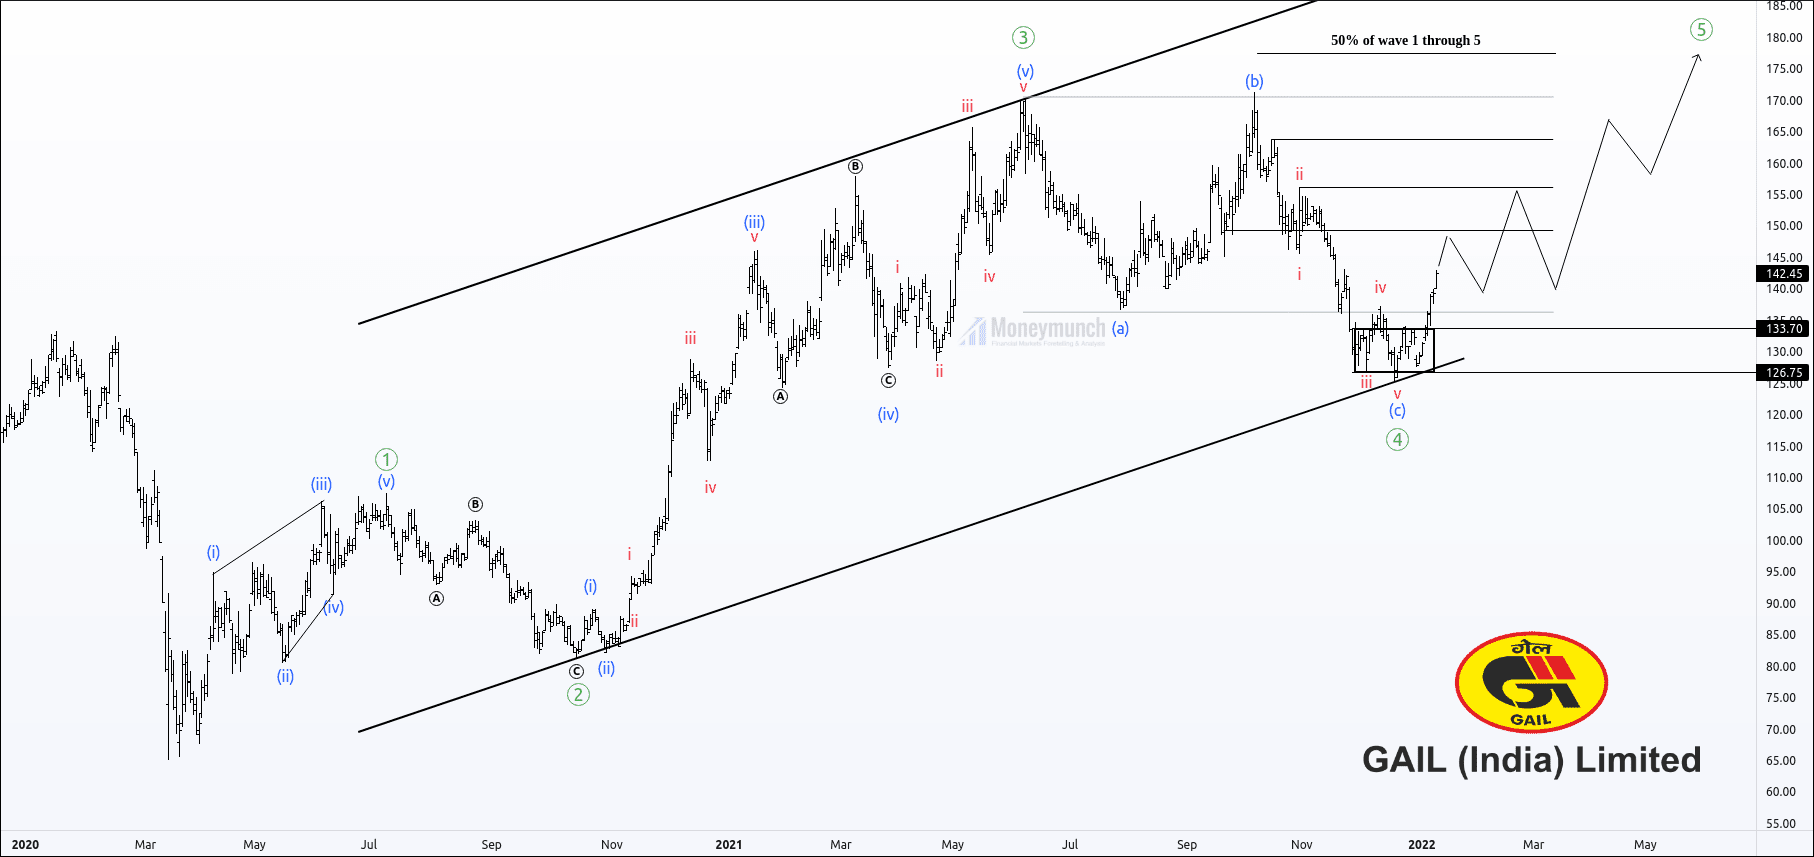
Gail India has completed its 4th corrective wave, where wave C is the last leg of correction.
Price took 27 weeks to complete the corrective wave ((4)).
After completing the wave ((4)), the price has broken the sub-wave iv and signaled a rally. It also has entered into the corrective channel, and this rally can make a new higher high.
The traders can expect the following targets 149-156-170+ for impulsive wave ((5)).
To become a subscriber, subscribe to our free newsletter services. Our service is free for all.
Wave Formations:
Wave ((1)) started to form an extreme low at 65.
– Leading diagonal
Wave ((2)) has retraced 0.618% of wave ((1)).
– Zigzag correction
Wave ((3)) has extended 2.618% of wave ((1)).
– Five wave impulse
Wave ((4)) has retraced 0.5% of wave ((3))
– Extended wave 5
To become a subscriber, subscribe to our free newsletter services. Our service is free for all.