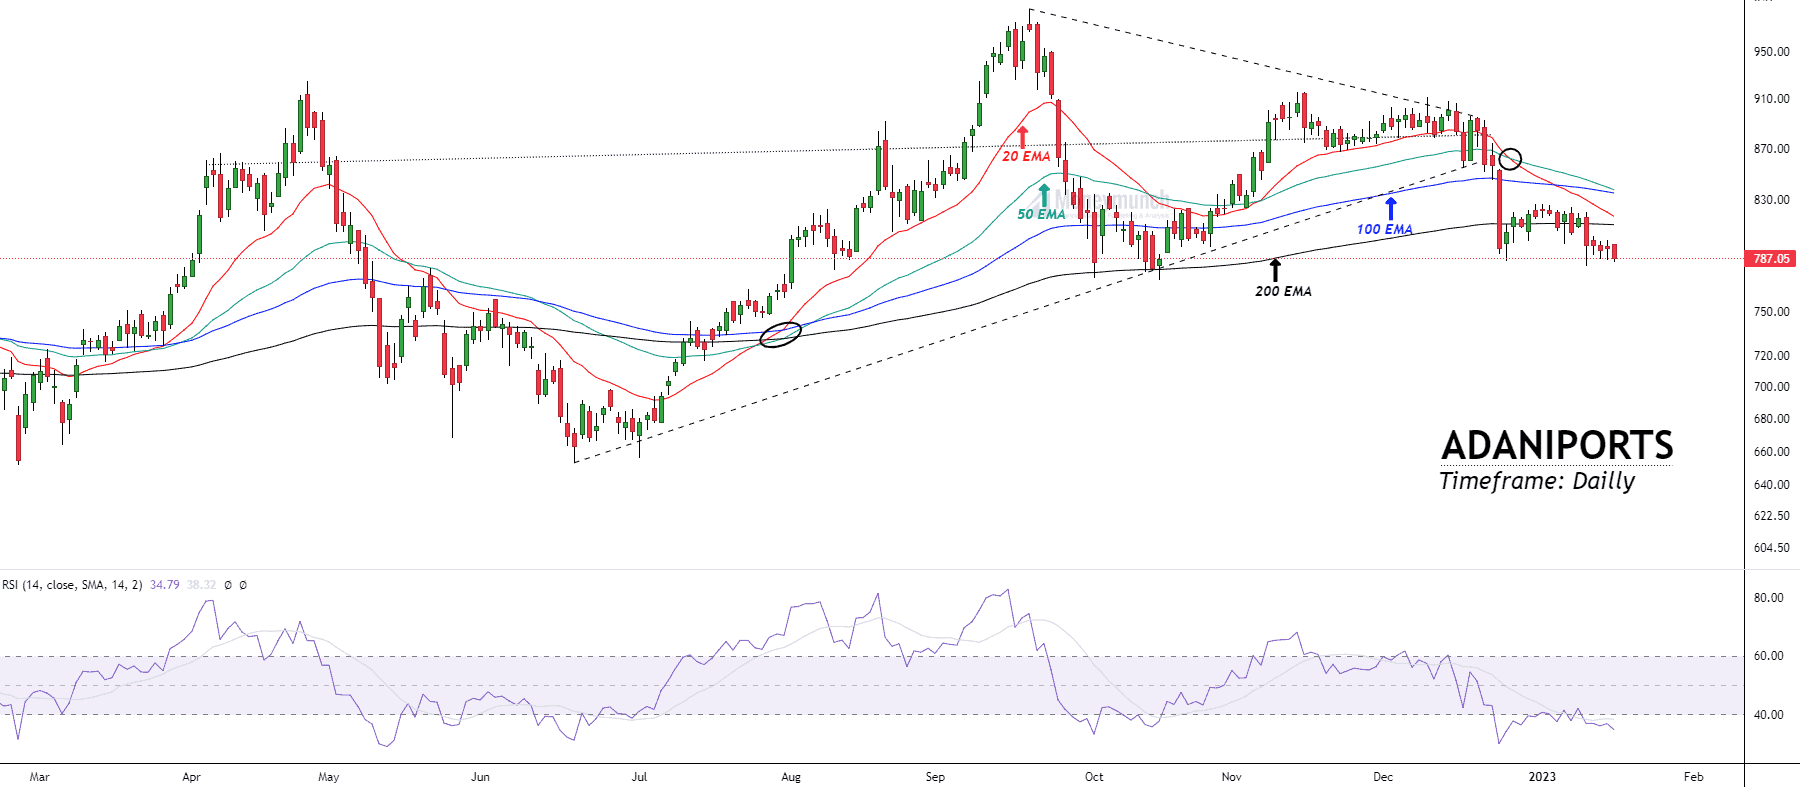
NSE ADANIPORTS – Price Action Analysis
Timeframe: Daily
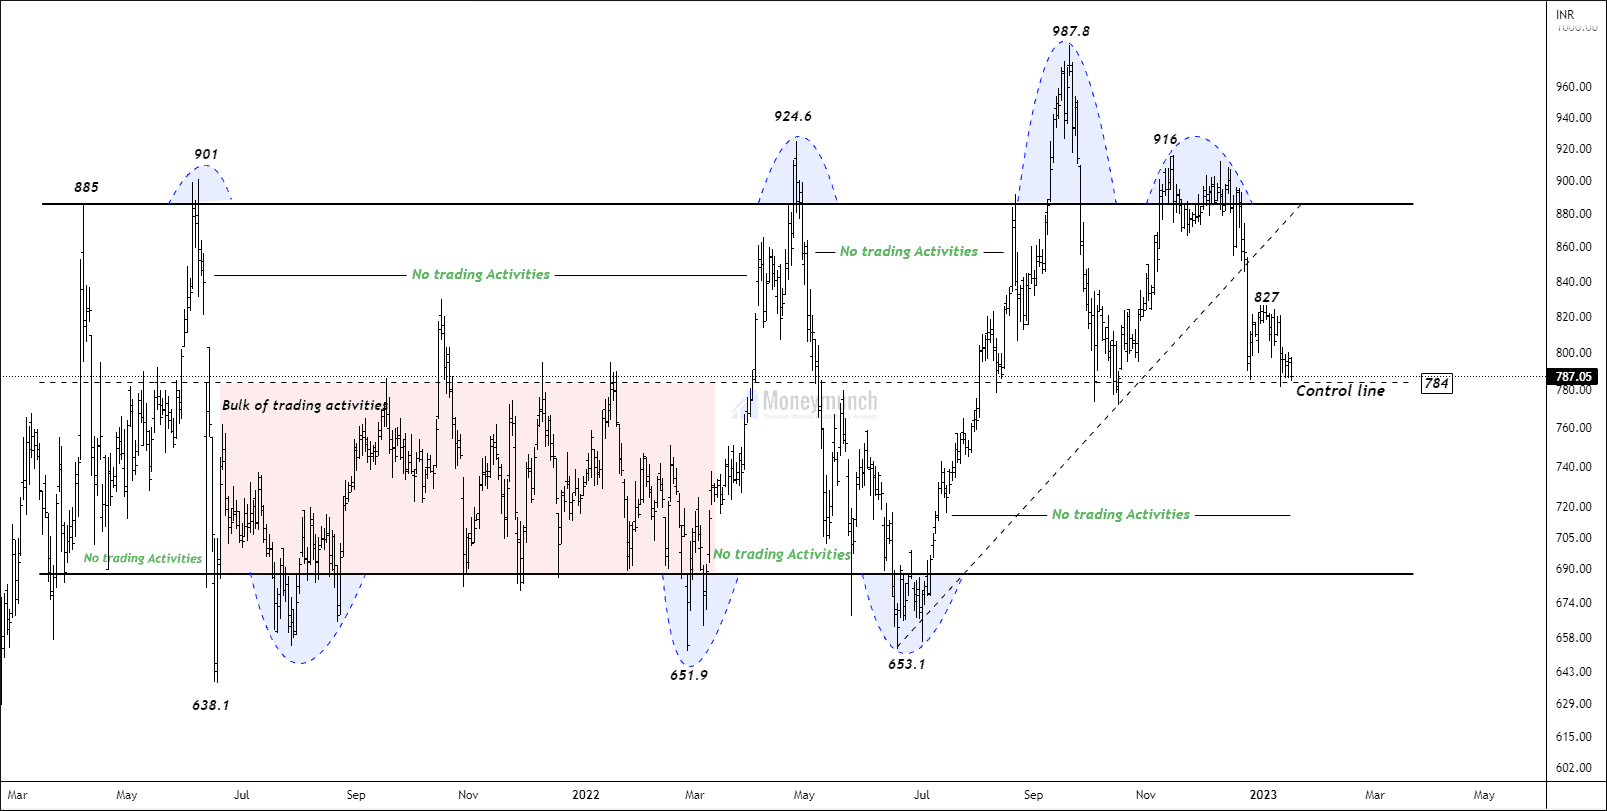
Support range – 187 – 770
The price has been consolidating into sideways the value area for more than 95 weeks. Currently, prices are trading near the control line of the parallel channel.
As you can see, prices have touched the control line more than 15 times, but they couldn’t stay away from it. Because of this, it is called a “gravitational line.” there are two pieces of evidence at the upper band and three pieces of evidence of the lower band of no trading activities.
If the price breaks down the control line of the channel, traders can sell for the following targets: 762 – 748 – 727. In order to identify bullish moves, 827 must be broken.