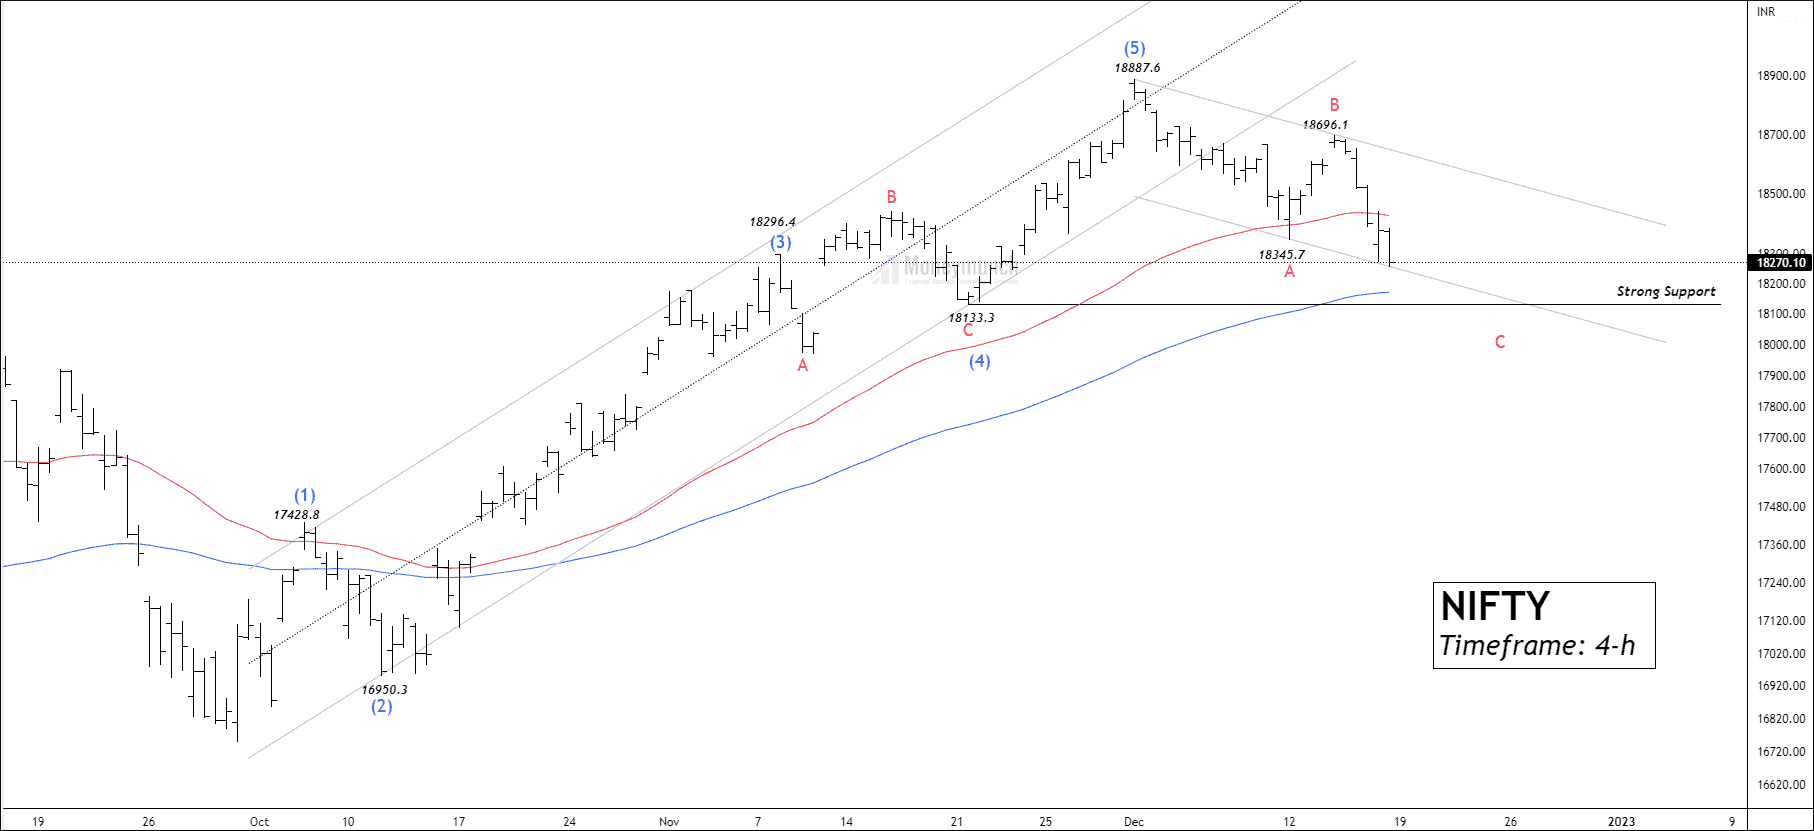
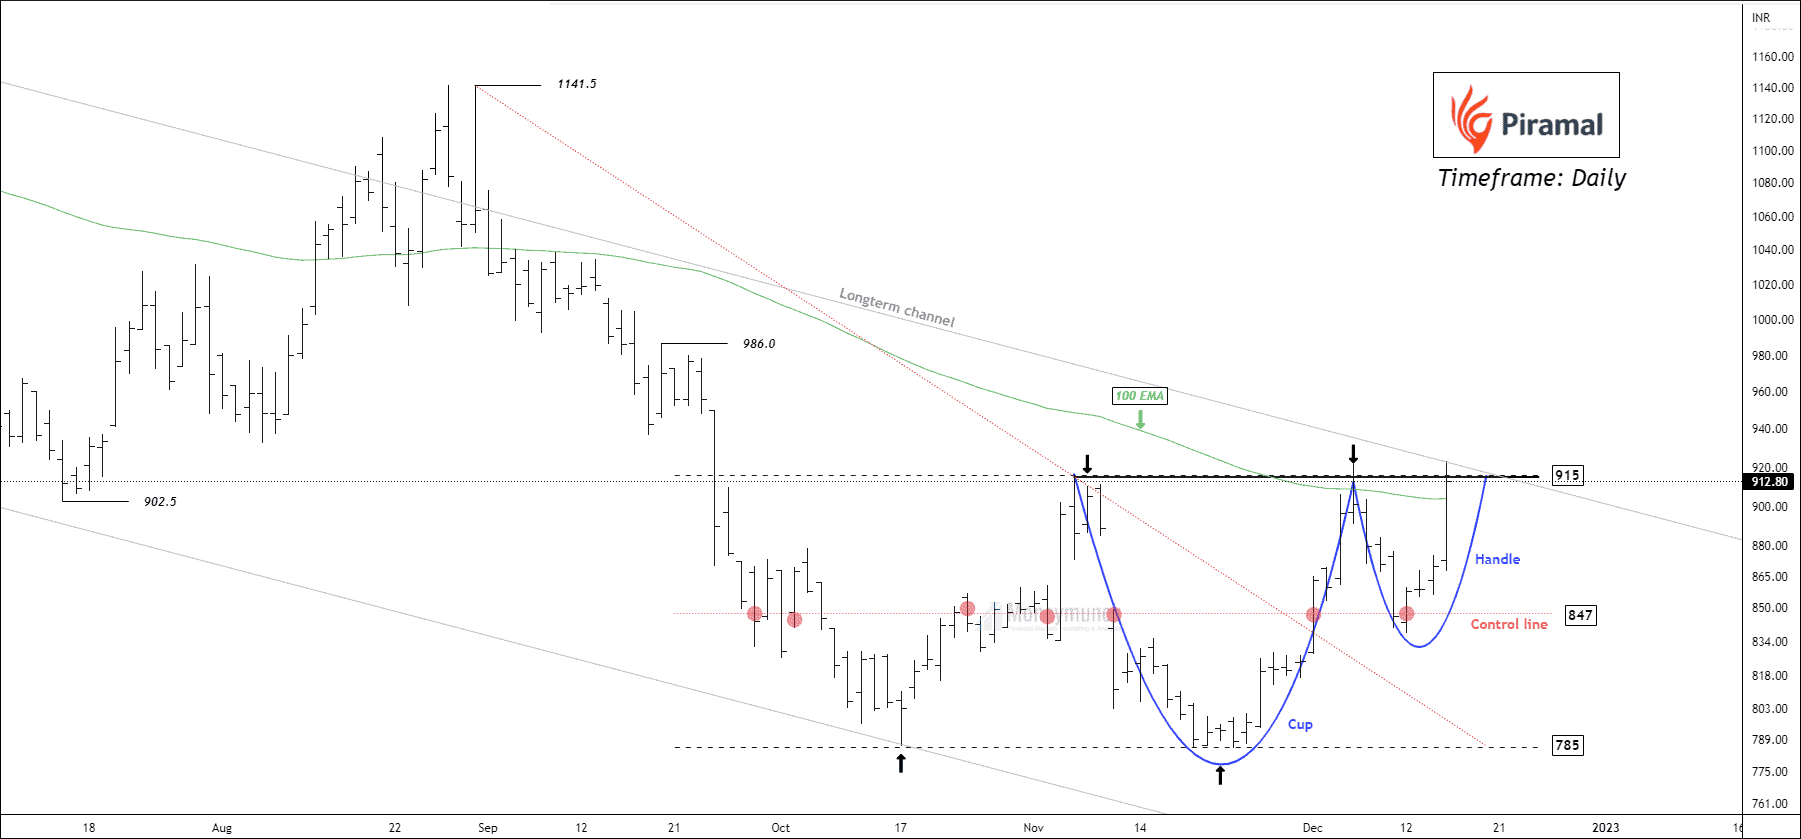
NSE PEL: Watch-Out For Cup And Handle Breakout
NSE INDUSINDBK – Tips & Update
Have you read my previous analysis on NSE INDUSINDBK?
Click here: NSE INDUSINDBK Is Preparing For A New High
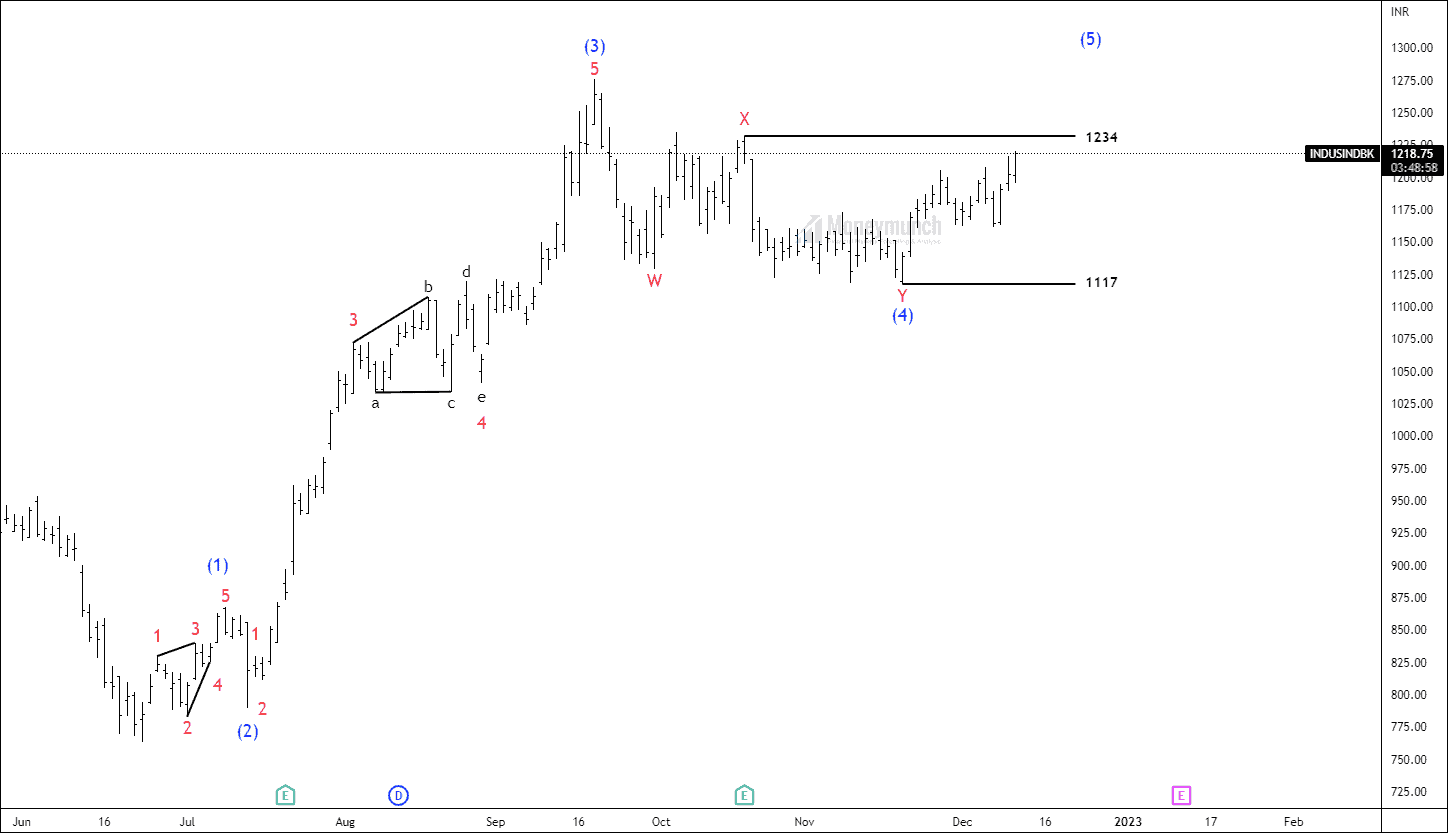 BEFORE
I have mentioned clearly, “If the price sustains above 1234, traders can trade for the following targets: 1254 – 1278 – 1293+.”
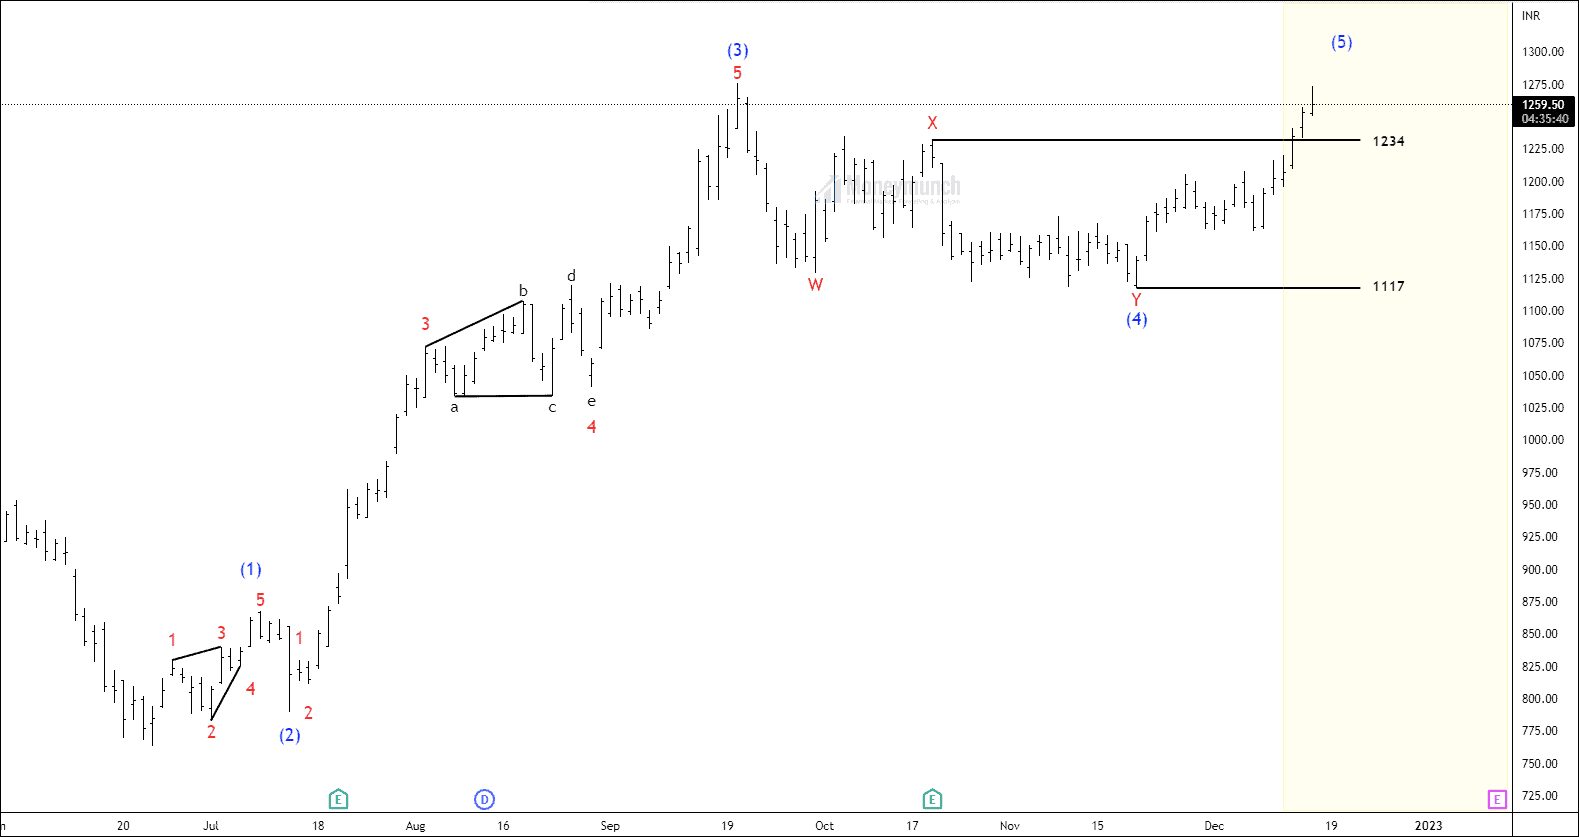 AFTER
AFTER
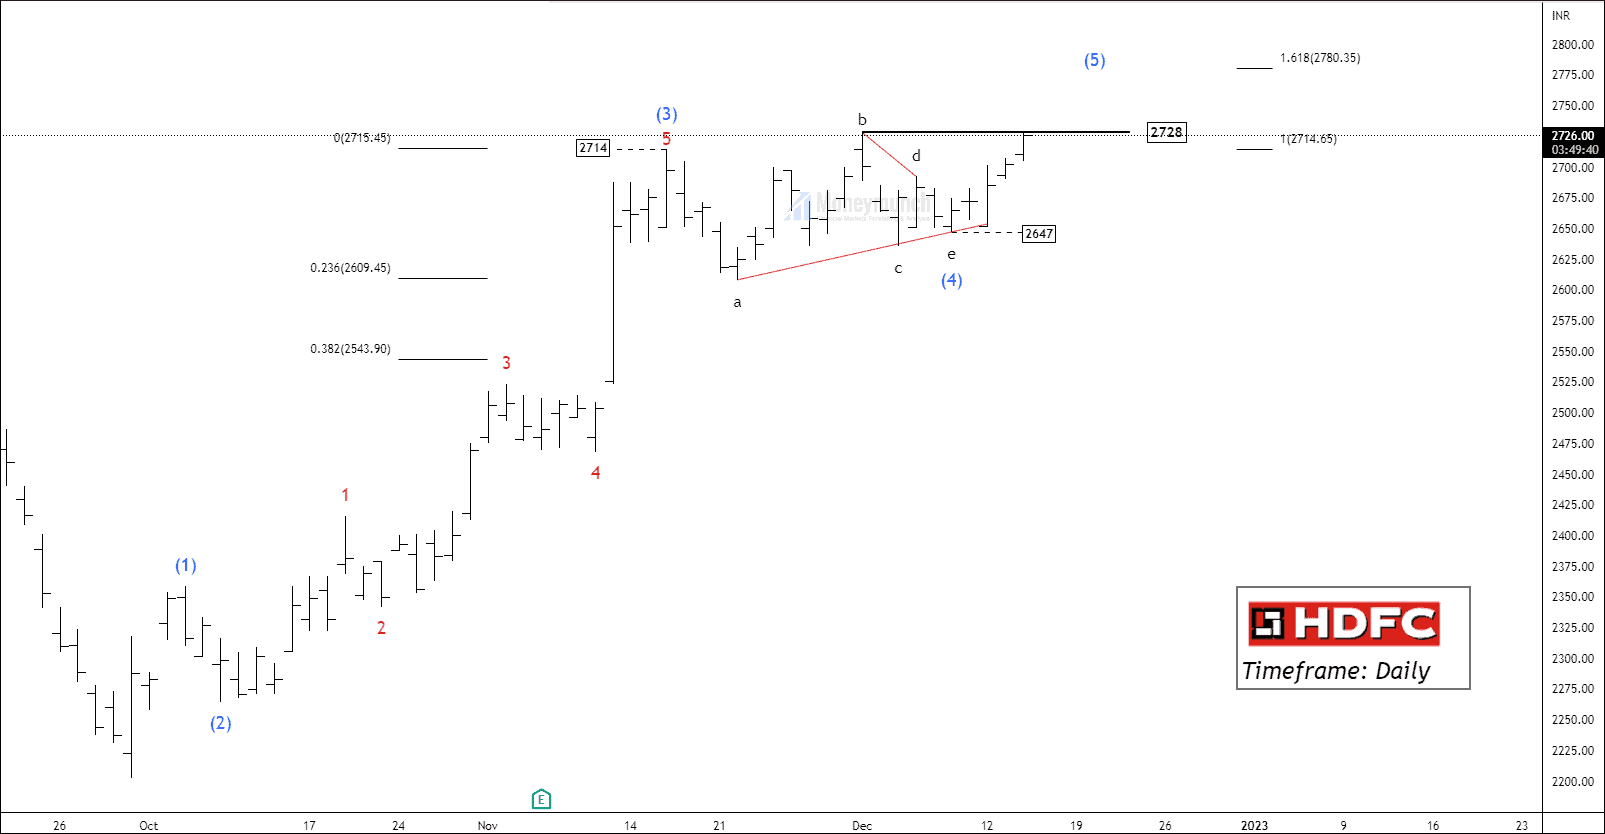
NSE HDFC – Trend Continuation Or Peculiar Reversal?
Is NSE POLYCAB Preparing For Impending Advance?
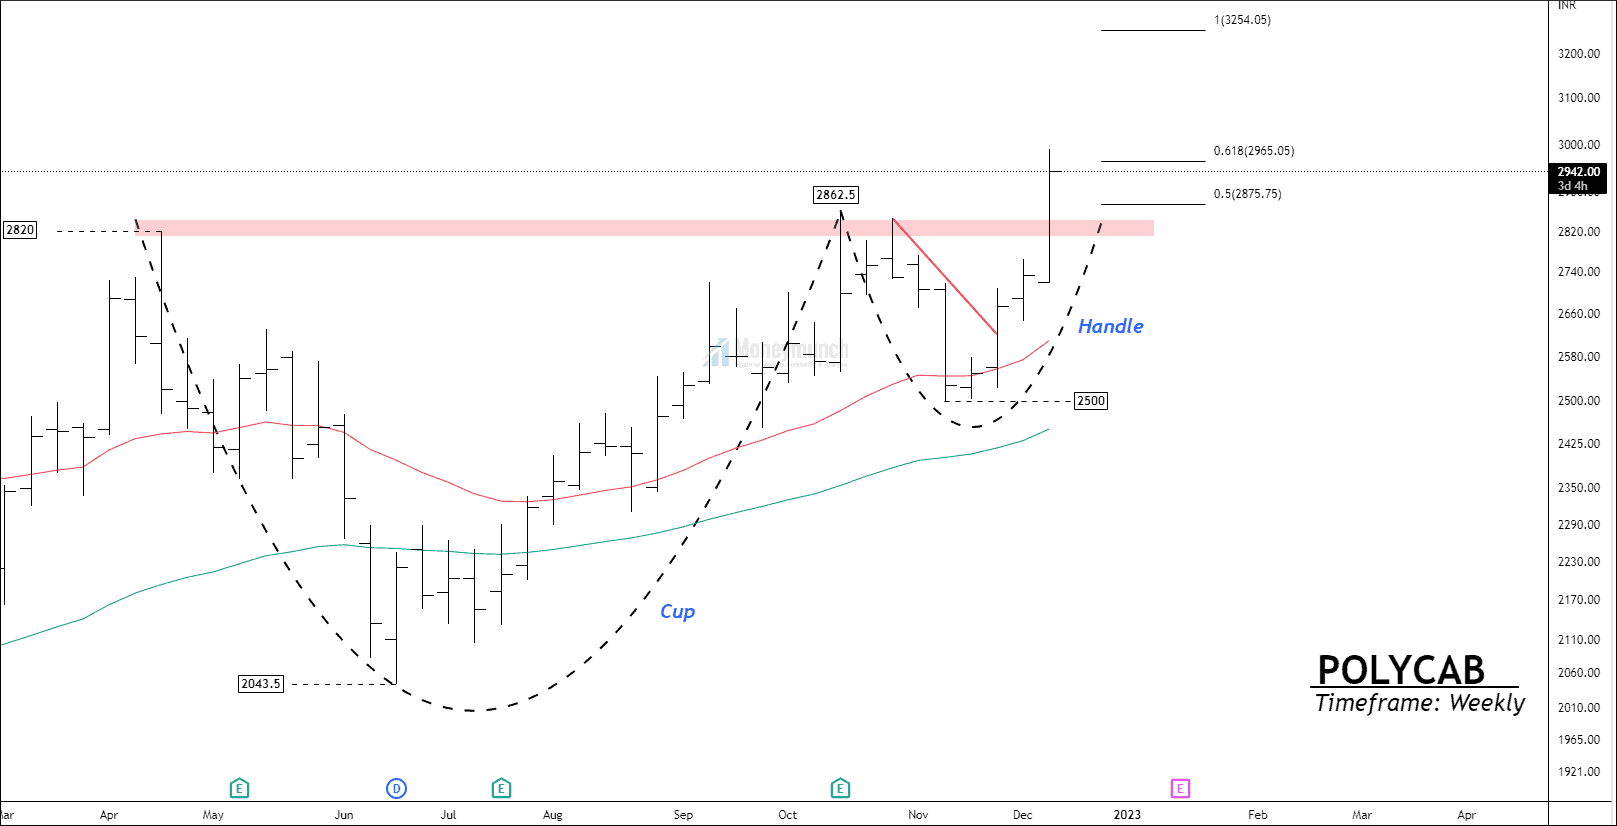
NSE POLYCAB has broken out a cup and handles pattern at the weekly timeframe chart. The handle has given 50% Fibonacci retracement of the cup.
The neckline at 2862 has provided resistance to the price until it broke out. Along with the relative strength index, the 20 and 50 moving averages are indicating bullish momentum.
If the price sustains the above swing high at 2862, traders can trade for the following targets: 3032 – 3185 – 3246. The trade will be invalid in case of spring or close below the neckline.
I will update further information for subscribers. To become a subscriber, subscribe to our free newsletter services. Our service is free for all.
 Unlock This Article
Only subscribers can read the full article. Please login to read the entire article.
Get free important share market ideas on stocks & nifty tips chart setups, analysis for the upcoming session, and more by joining the below link: Stock Tips
Have you any questions/feedback about this article? Please leave your queries in the comment box for answers.
Disclaimer: The information provided on this website, including but not limited to stock, commodity, and forex trading tips, technical analysis, and research reports, is solely for educational and informational purposes. It should not be considered as financial advice or a recommendation to engage in any trading activity. Trading in stocks, commodities, and forex involves substantial risks, and you should carefully consider your financial situation and consult with a professional advisor before making any trading decisions. Moneymunch.com and its authors do not guarantee the accuracy, completeness, or reliability of the information provided, and shall not be held responsible for any losses or damages incurred as a result of using or relying on such information. Trading in the financial markets is subject to market risks, and past performance is not indicative of future results. By accessing and using this website, you acknowledge and agree to the terms of this disclaimer.
NSE INDUSINDBK Is Preparing For A New High
Have you read my previous analysis on NSE INDUSINDBK?
Click here: NSE Indusind Bank has started forming wave 5
Continue reading