
NSE ADANIPORTS – Price Action Analysis
Timeframe: Daily
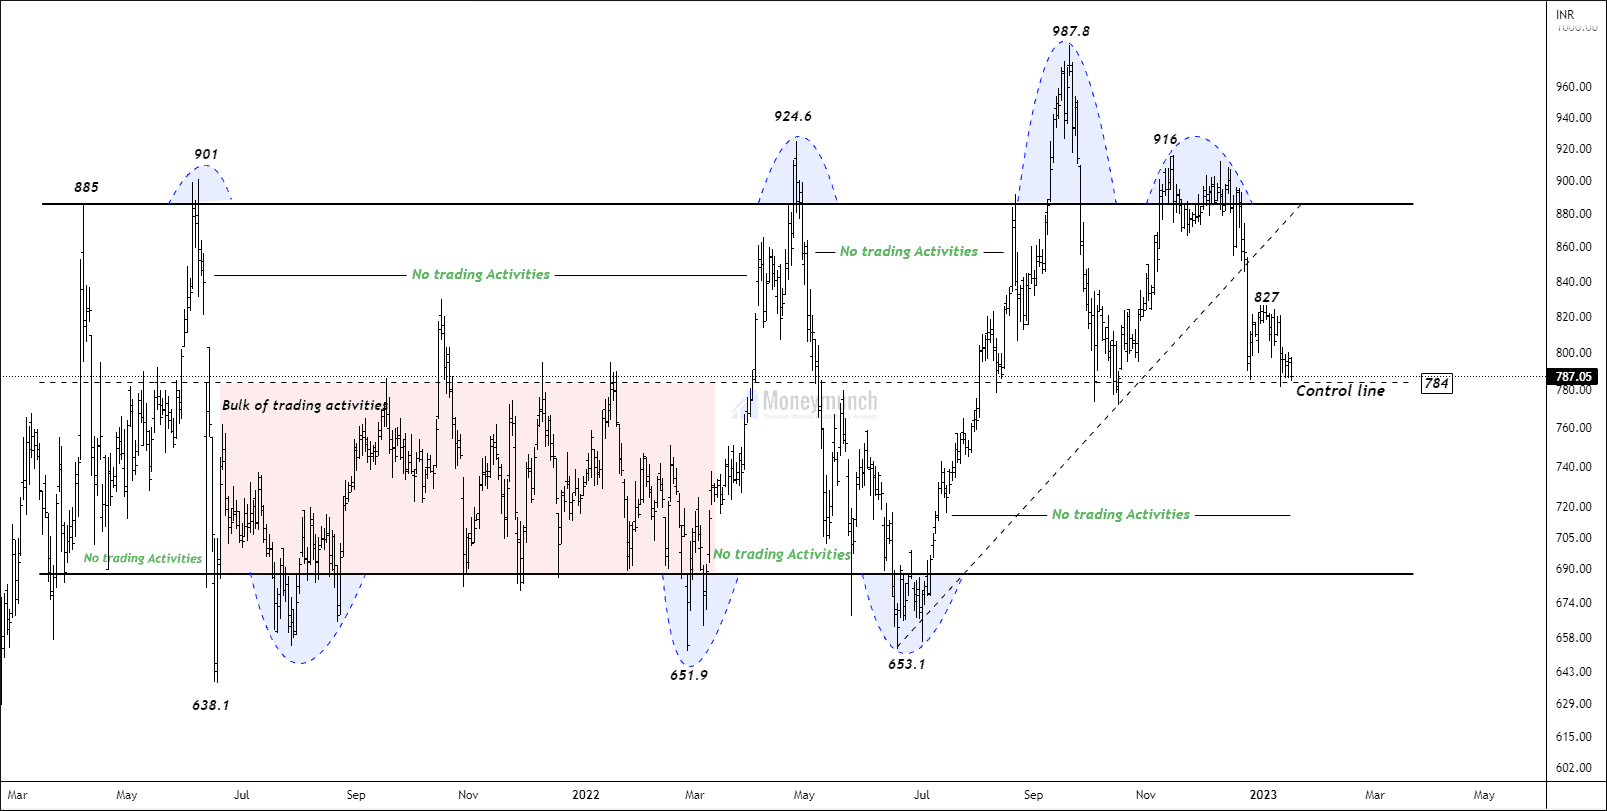
Support range – 187 – 770
The price has been consolidating into sideways the value area for more than 95 weeks. Currently, prices are trading near the control line of the parallel channel.
As you can see, prices have touched the control line more than 15 times, but they couldn’t stay away from it. Because of this, it is called a “gravitational line.” there are two pieces of evidence at the upper band and three pieces of evidence of the lower band of no trading activities.
If the price breaks down the control line of the channel, traders can sell for the following targets: 762 – 748 – 727. In order to identify bullish moves, 827 must be broken.
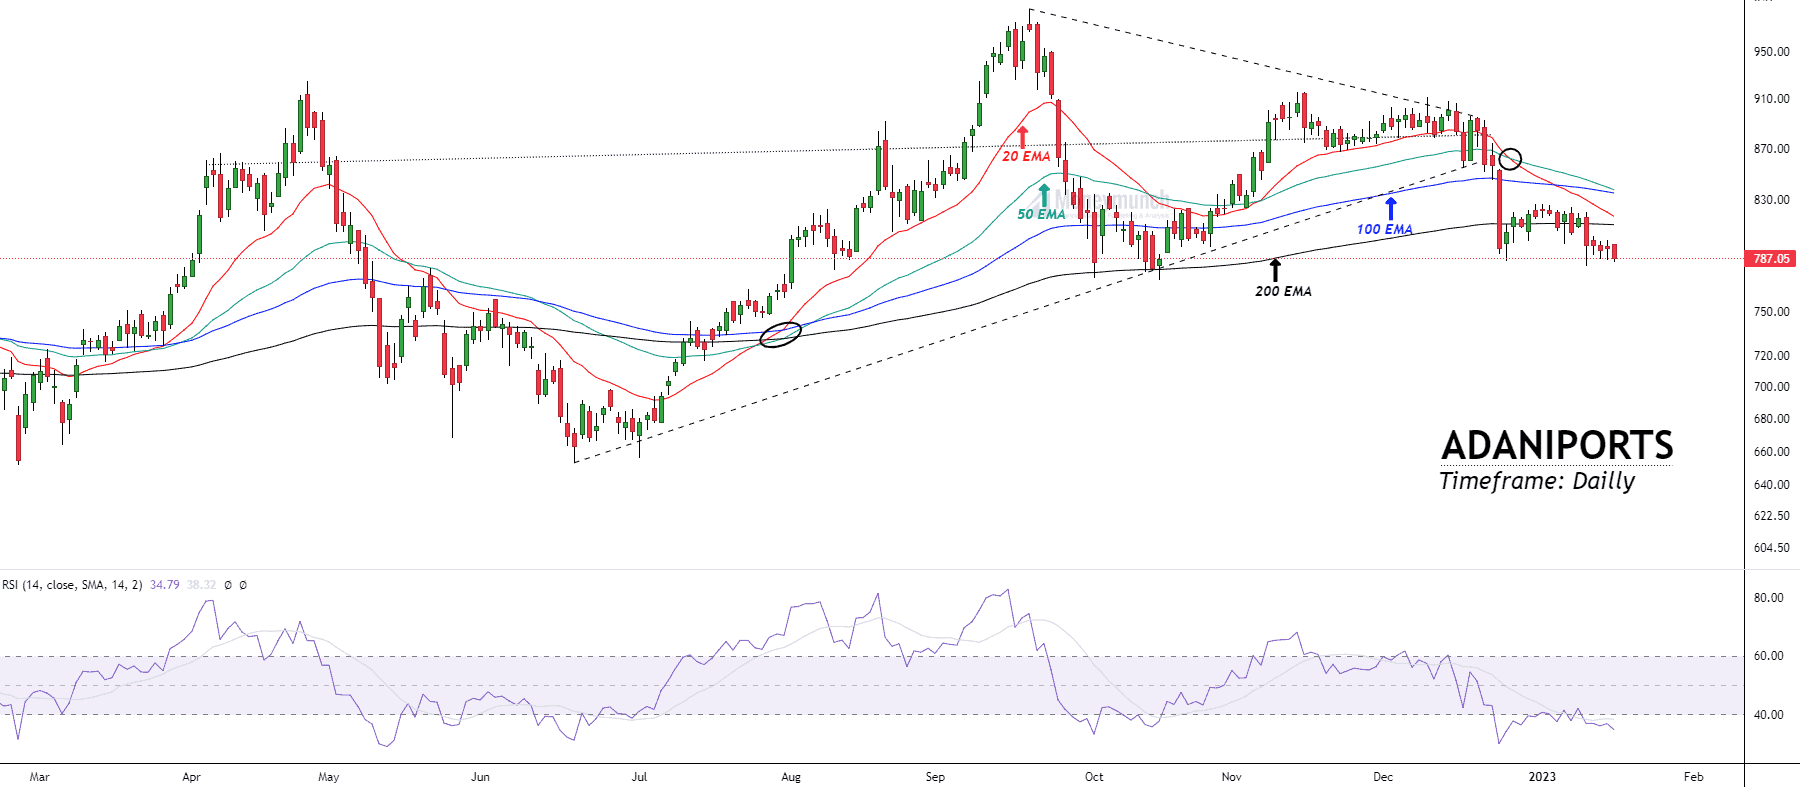
Indicator Analysis:
- EMA:
Prices are trading below 20/50/100/200 EMA, which signals bearish momentum in the stock. After a big bearish candle on 23rd December 2022, the price couldn’t sustain above 200 EMA. It ends up losing bullish probabilities. When the 20 EMA crosses below the 200 EMA, it signals more bearish movements. - RSI:
RSI on the daily chart is 34. As per the historical data, the price has never gone below 25 in the last 33 months. I follow RSI with 40-60 bands for more accuracy.
I will update further information soon.
NSE AXIS BANK – An ending diagonal
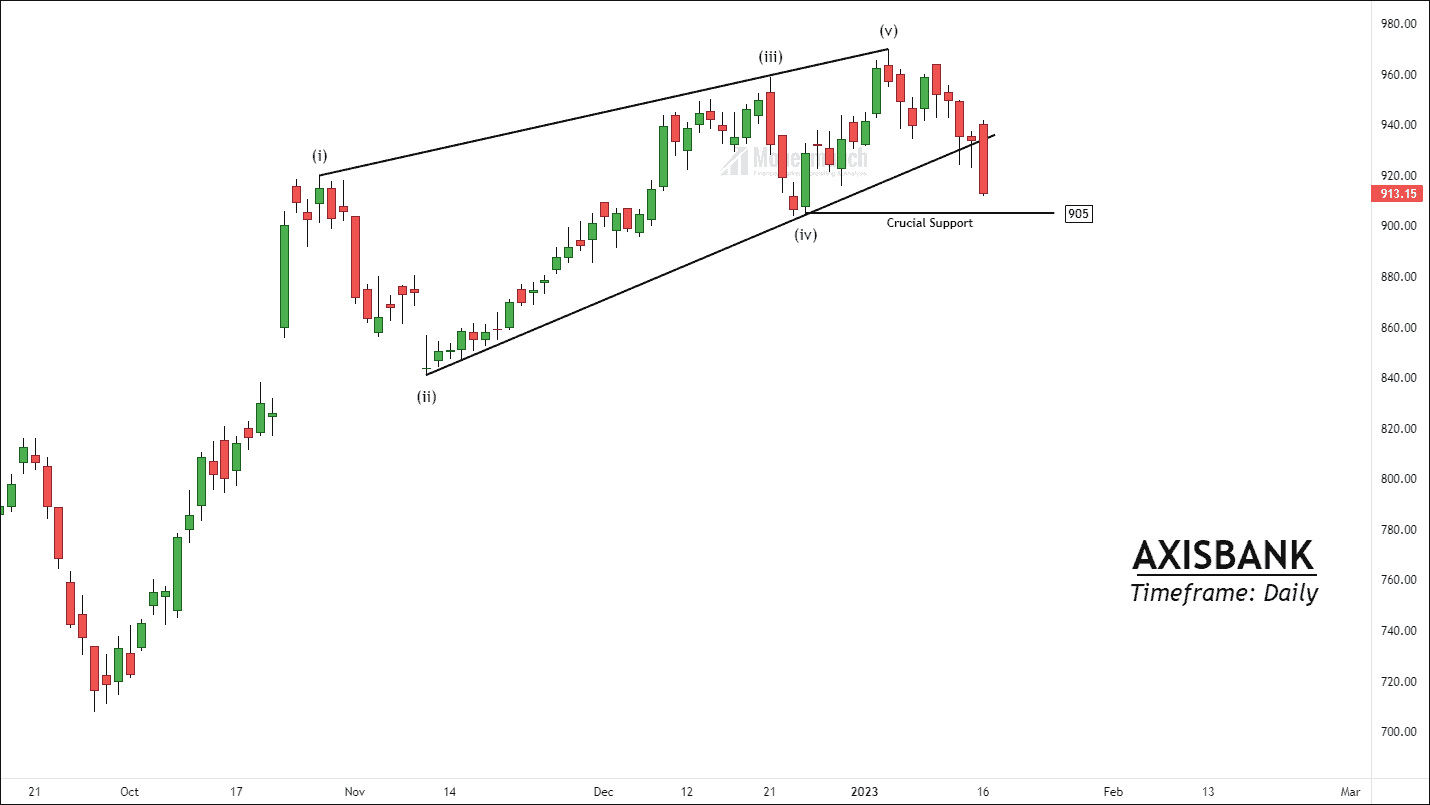
Crucial support – 905
NSE AXISBANK has formed an ending diagonal on the daily timeframe chart. According to Elliott wave principle, the triangle can only be traded successfully if the price breaks down in the 4th wave.
Wave 4 is a crucial support level for the prices. If the price breaks down 4th wave at 905, traders can sell for the following targets: 880 – 857 – 832+. Safe traders can wait for a pullback to minimize their risks.
NSE BEL – Breakout of The Consolidation Zone
NSE BEL was trading in the range of 100 – 98 for more than two weeks. Price has given a breakout of this range with substantial volume. BEL has broken out 20 EMA and is trading near 50 EMA.
If the price sustains above 101.2, traders can trade for the following targets: 103.4 – 104.8 – 105.9.
NSE TECHM – Buy from the Bottom
TECHM has broken out its lower high of 1028, rising to a new high of 1036. There was a huge volume at the time of the breakout, which increased the strength of the move.
Traders can initiate a long position if the price sustains above 1025 for the following targets: 1042 – 1060 – 1088. Because we are going to buy at the bottom, this setup can be risky for some traders.
NSE HEROMOTOCO – Breakout setup
NSE HEROMOTOCO is looking strong on the daily timeframe. Over the past few days, prices have moved above 200 EMA, where 20 and 50 EMAs have been broken out.
If the price sustains above 2744, traders can buy for the following targets: 2765 – 2782 – 2800. Traders can use yesterday’s low as a stop-loss. 2775 is the swing high, and the breakout of this level will lead to a massive impulsive wave.
To become a subscriber, subscribe to our free newsletter services. Our service is free for all.
Get free important share market ideas on stocks & nifty tips chart setups, analysis for the upcoming session, and more by joining the below link: Stock Tips
Have you any questions/feedback about this article? Please leave your queries in the comment box for answers.
Thank you for sharing these setups.
Sir techm touched ur first tp. I book profit
Intraday setups are working well and going toward targets. I am a swing traders and I am waiting for axis bank and adani port.