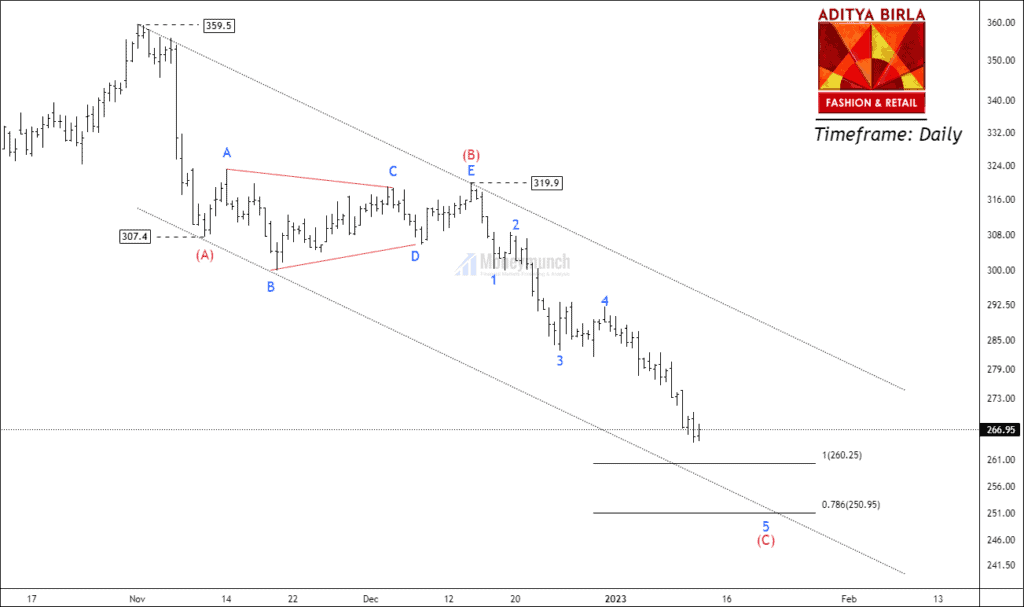
Timeframe: Daily
NSE ABFRL has made a high of 359.5 and started falling for corrective structure. Price has accomplished the triangle of the corrective wave (B) and started forming sub-wave 5 of the impulsive wave (C).
Price has been forming in the corrective formation for more than eight weeks. Price fell sharply after breaking 50 EMA from the upper band. If the price sustains above the lower band after penetration, traders can buy for the following targets: 270 – 296 – 320. Sellers should exit in case of retreat from the lower band because it generates demand pressure.
I will update this article once the price reaches the lower band of the channel. To become a subscriber, subscribe to our free newsletter services. Our service is free for all.
Get free important share market ideas on stocks & nifty tips chart setups, analysis for the upcoming session, and more by joining the below link: Stock Tips
Have you any questions/feedback about this article? Please leave your queries in the comment box for answers.


Very good analysis SIR!
👌👌👌
Outstanding, let’s see what happens
Agree with you