Basic Tenets:
Elliott waves are famous for finding crowd behavior trends and reverses in recognizable patterns. Elliott’s wave principle is inspired and made from the Dow theory, which is the foundation of the technical analysis.
Elliott’s wave principle consists of eight waves.
In this eight wave, price forms two types of wave structure,
1. Motive structure:
– Five Wave Pattern.
– Moves with the primary/main trend.
– Labeled in Numerical method (1,2,3,4,5).
2. Corrective structure
– Three Wave Pattern.
– Moves against the primary/main trend.
– Denoted in alphabetical method (A, B, C).
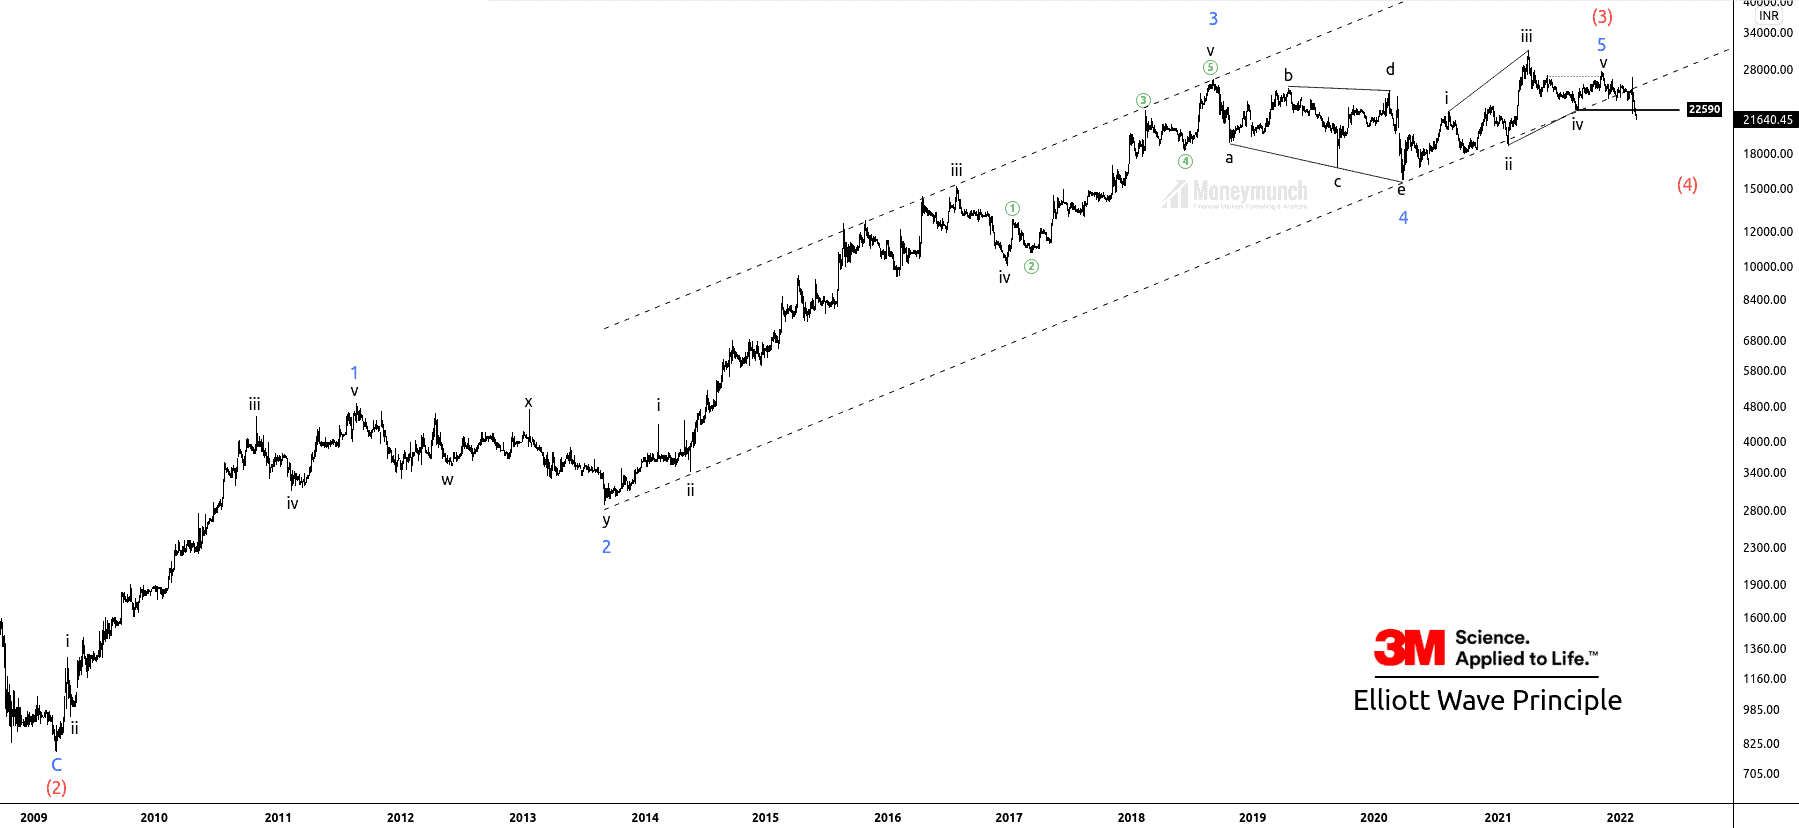
Now, let’s look at the 2-day chart of 3MINDIA.
Timeframe: 2 day
Price has accomplished the impulsive wave (3) and started forming corrective wave (4) by breaking sub-wave iv of wave 5 of wave (3).
Currently, the price is in corrective mode.
Sub-wave 5 of wave (3) has ceased, the terminating wave v of ending diagonal. Price has broken down the corrective wave iv at, 22590, which signals bearish sentiments. After breaking the main channel, the price started falling sharply.
Calculation of wave (4):
The common retracement of wave 4 is 38.2% of wave 3.
Wave 4 can never retrace more than 61.8% of wave 3.
Wave 4 occurred near sub-wave 4 of lower degree.

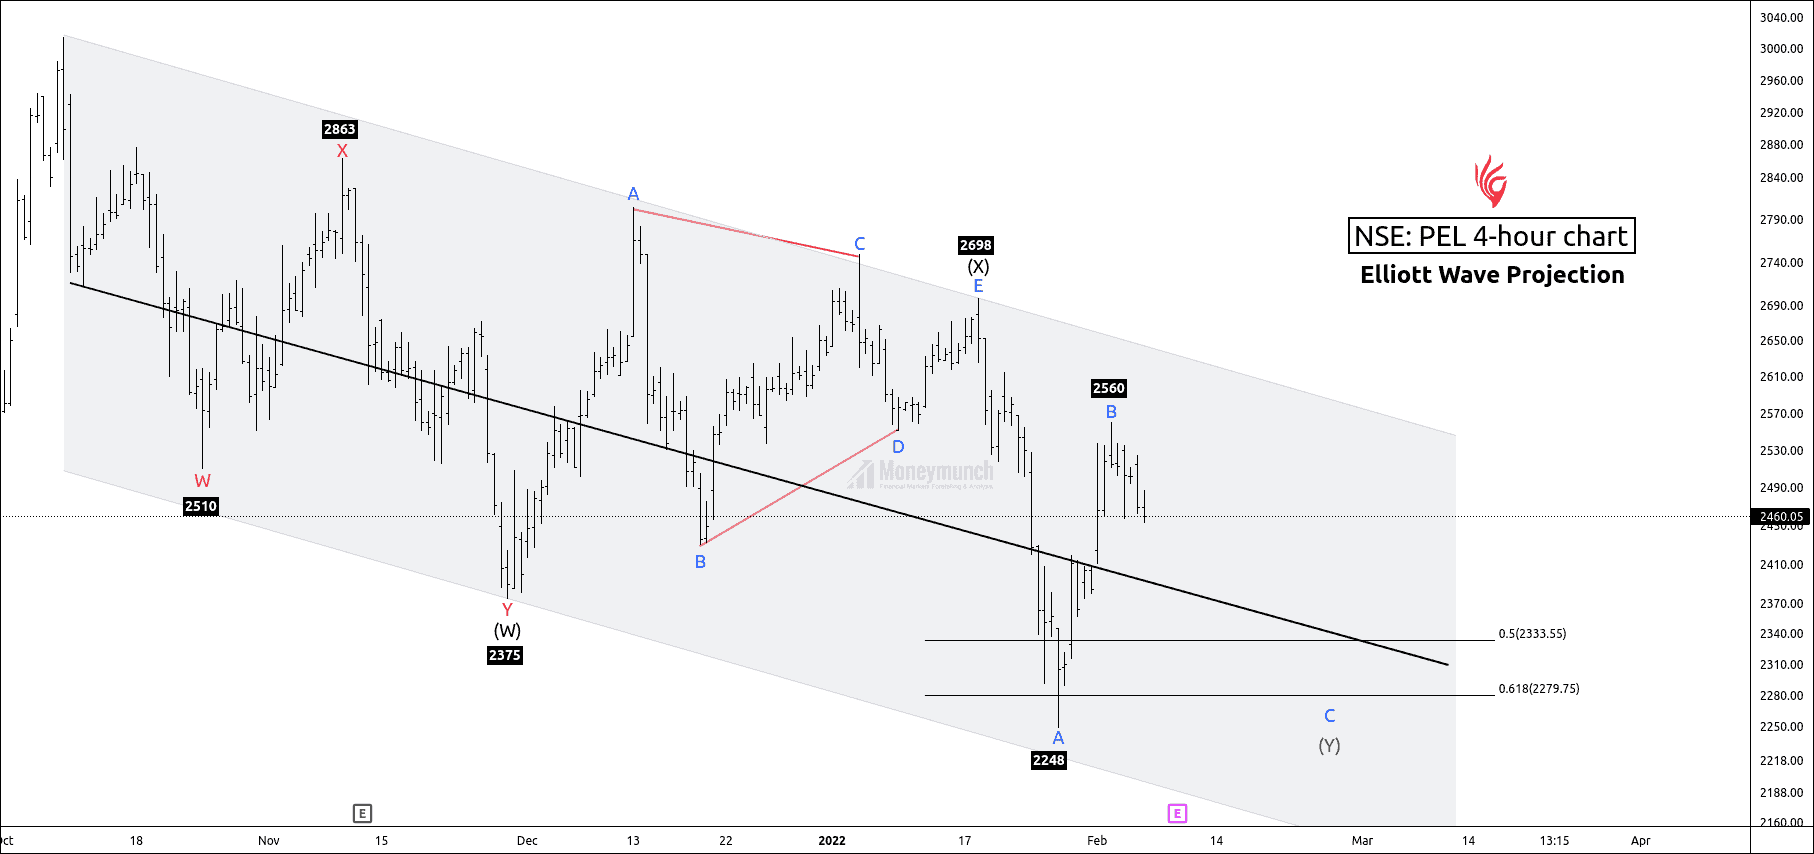
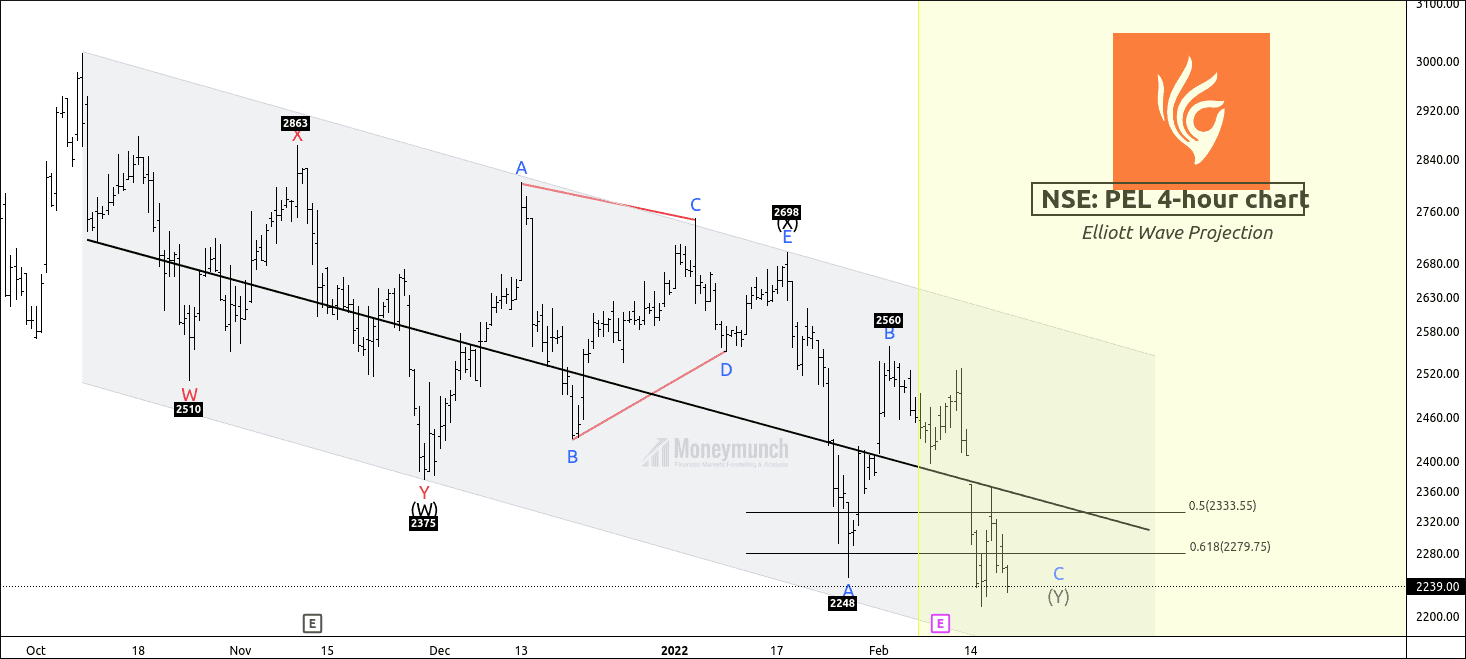
Timeframe chart: 4-hour
Price has broken down the sub-wave iv of the ending diagonal of wave 5.
After the pullback, if the price sustains below, 22590, it is likely to give a big move below the parallel channel.
Traders can initiate a short position for the following targets of 21010-20557.
To become a subscriber, subscribe to our free newsletter services. Our service is free for all.
 Unlock This Article