NSE Nifty & Bank Nifty Is Preparing For Pullback

In the previous article, I have mentioned the weakness or gap down. Yesterday, nifty opened in a gap-down of 219 points.
Click Here: NIFTY OUTLOOK: IS NIFTY PREPARING FOR 16800?

NIFTY
Free nse nifty chart calls

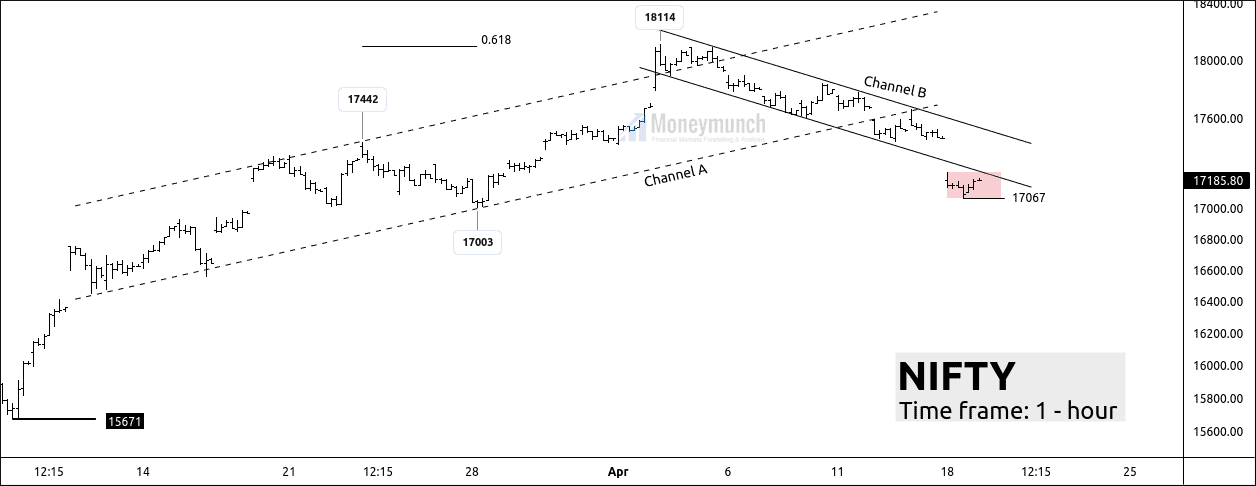
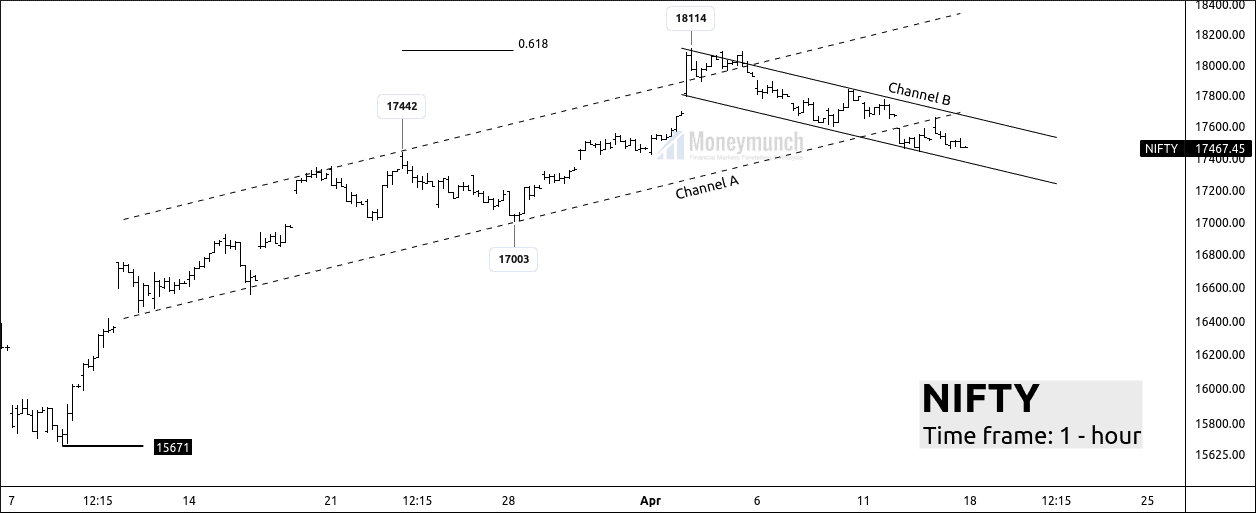
Today, we can expect a pullback to the current move, which will go up to the upper band of the B channel.
Nifty has broken down the lower band of channel B.

If the price beaks face resistance at the lower band, the price may fall for the support level 17000 – 16912 – 16800.

The key level for the up move is 17250. If the price sustains above the 17250, traders can expect resistance levels: 17300 – 17425 – 17466.

Don’t forget trend never moves in a straight line. It creates lows and highs. The bull trend can only be possible during the breakout of 18121.

BANK NIFTY
Free nse banknifty chart calls

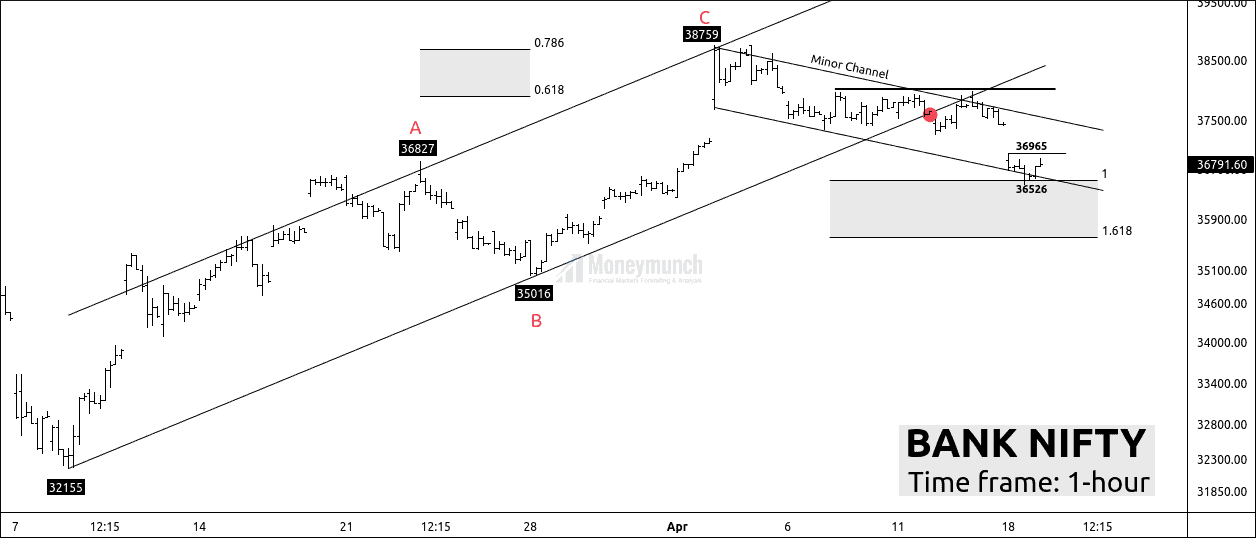
Bank Nifty has completed the zigzag pattern at 38759 with 0.786% Fibonacci extension. This down move has also broken down the ABC channel.

The market never stops its cyclical move. Yesterday, Bank nifty touched the lower band of the minor parallel channel. Nifty had made the range between 36965 & 36526
If the price respects the parallel channel, traders can expect a good up move to 37150 – 37251 – 37315

If the price breaks down the parallel channel & sustains below 36500, it will be a bearish signal because 36500 is a pivot level.
However, the assumption of a positive day can be possible as the global market is +ve.

To become a subscriber, subscribe to our free newsletter services. Our service is free for all.
Continue reading

Nifty Outlook: Is Nifty Preparing for 16800?

Thought of The Day

Thought Of The Day
I have two basic rules about winning in trading as well as in life.
(1) If you don’t bet, you can’t win
(2) If you lose all your chips, you can’t bet.
~ Larry Hite

Timeframe: Daily
Free nse nifty daily chart calls

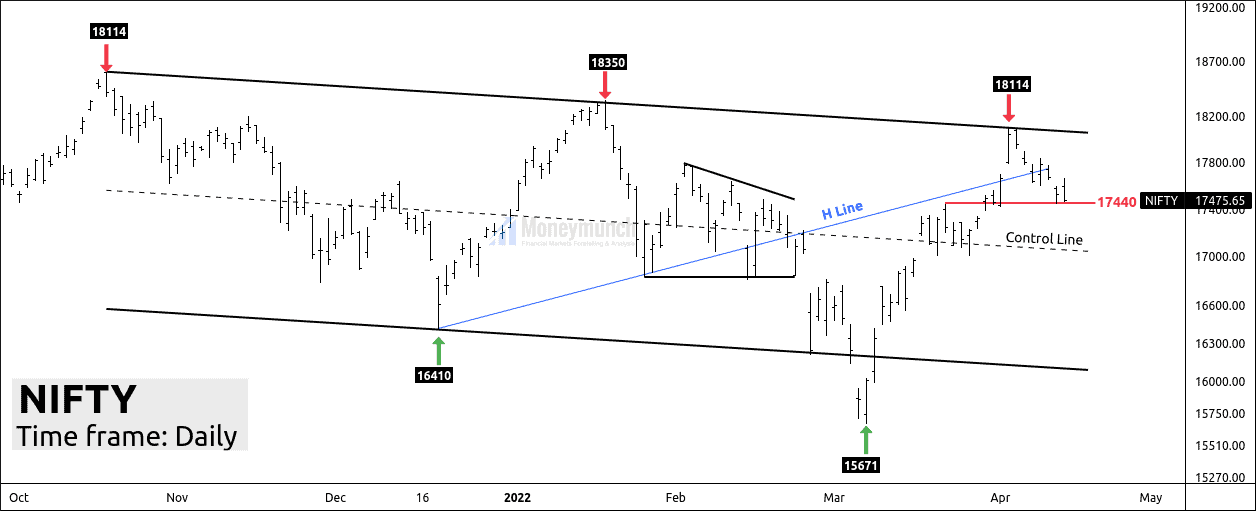
Previous close – 17475

Nifty had made a high of 18114 and started falling as the price was heaving  horizontal resistance. Price couldn’t sustain above previous Lower high and started declining.

Nifty is at the support of 17440. Traders can expect a gap down.

If the price breaks out to 17440, the support level will be 17300 – 17000 – 16800. Nifty is strong only above 16600, and closing below 17230 indicates weakness.

Time frame: 1-hourFree nse nifty 60min chart calls

It looks like nifty has broken down the uptrend channel A and started falling. Price is forming and moving into corrective channel B.

To become a subscriber, subscribe to our free newsletter services. Our service is free for all.

Continue reading

EWT: NSE United Spirits Multiple Time Frame Studies

Time frame: Weekly
Free nse unitedspirit chart calls

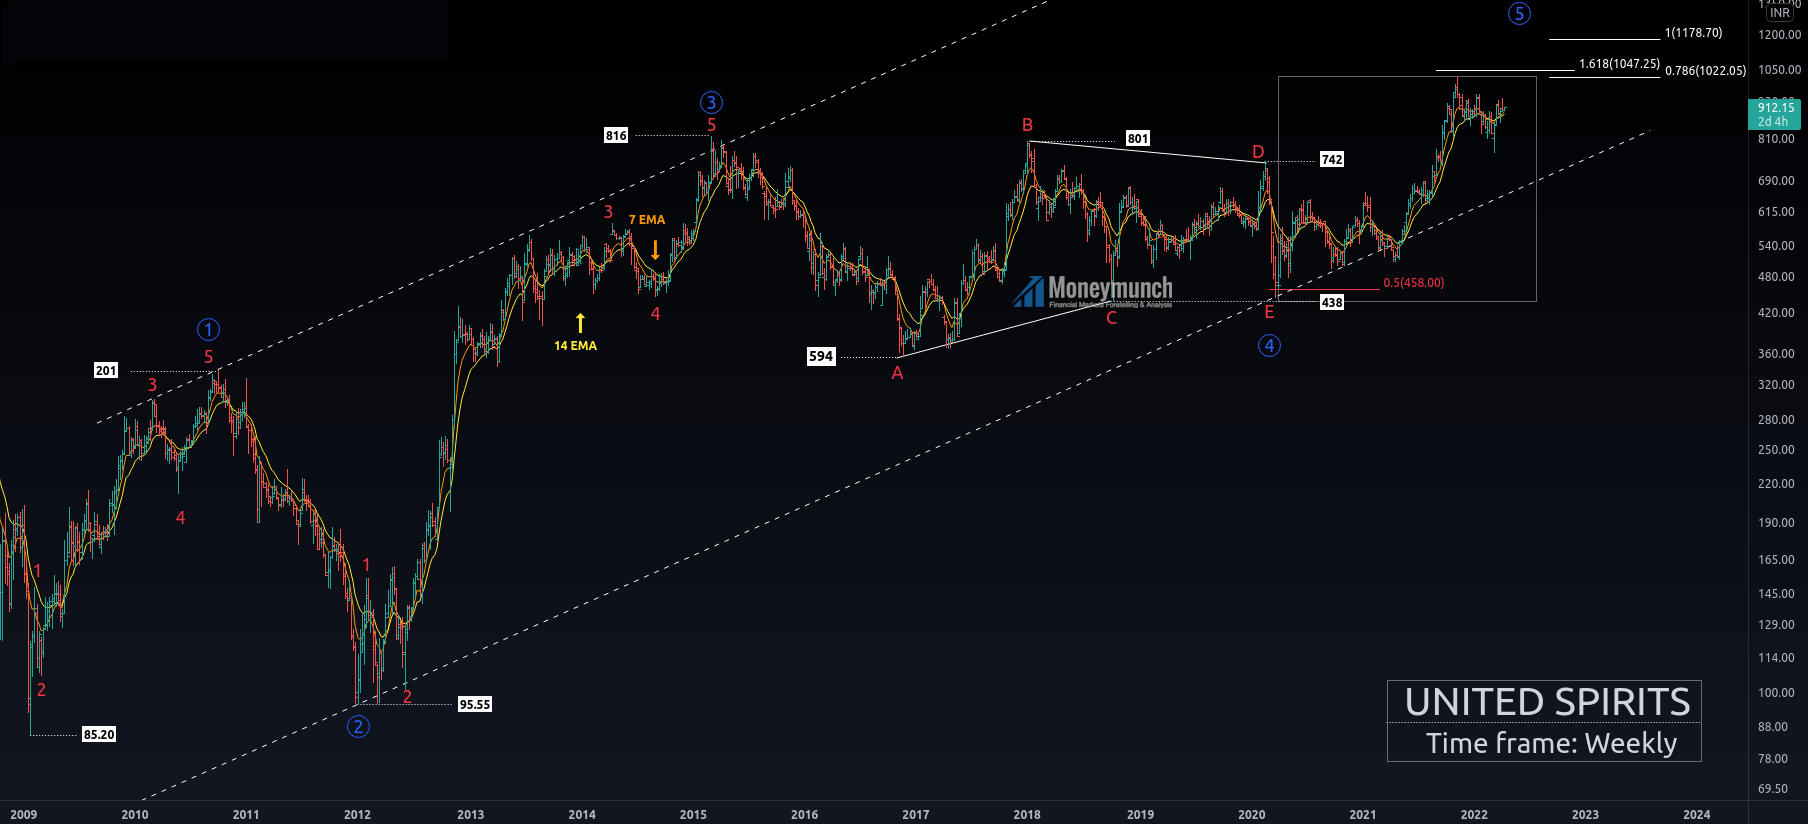
United Spirits has started wave cycle from 85.20.
Wave ((1)):
Wave ((1)) is an impulse pattern that occurred in 201.

Wave ((2)):
Wave ((2)) is a zigzag pattern that occurred at 95.55.
Wave ((2)) retraced 100% of wave ((1)).
Rule 1: Wave ((2)) can never overlap the starting point of wave ((1)).

Wave ((3)):
Wave ((3)) is an impulse with extensive nature, 3.618% of wave ((1)) occurred at 816.
Rule 2: Wave ((3)) can never be the shortest impulse wave.

Wave ((4)):
Wave ((4)) is a triangle pattern with a five-wave structure, retraced 50% of the wave ((3)).
A: 594
B: 801
C: 438
D: 742
E: 442 (terminating wave)
Price surged after the breakout of the B_D trend line.
Rule 3: wave 4 can never enter the price territory of wave 1.

Wave ((5)):
Currently, price is forming an impulsive wave ((5)).
Wave ((5)) has retraced 161.8% reverse Fibonacci of wave ((4)), which is the most acceptable retracement for wave ((5)).

Wave ((4)) extended 78.6% of wave ((1)) through ((3)) at 1020, and the price had made a high of 1019. It is also an ideal level for wave ((5)).

We still have a 100% Fibonacci extension level for wave ((5)). Our next step is to analyze the lower time frame chart and study the sub-wave behavior of waves ((5)).

Time frame: Daily
Fee nse stock unitedspirit chart daily calls

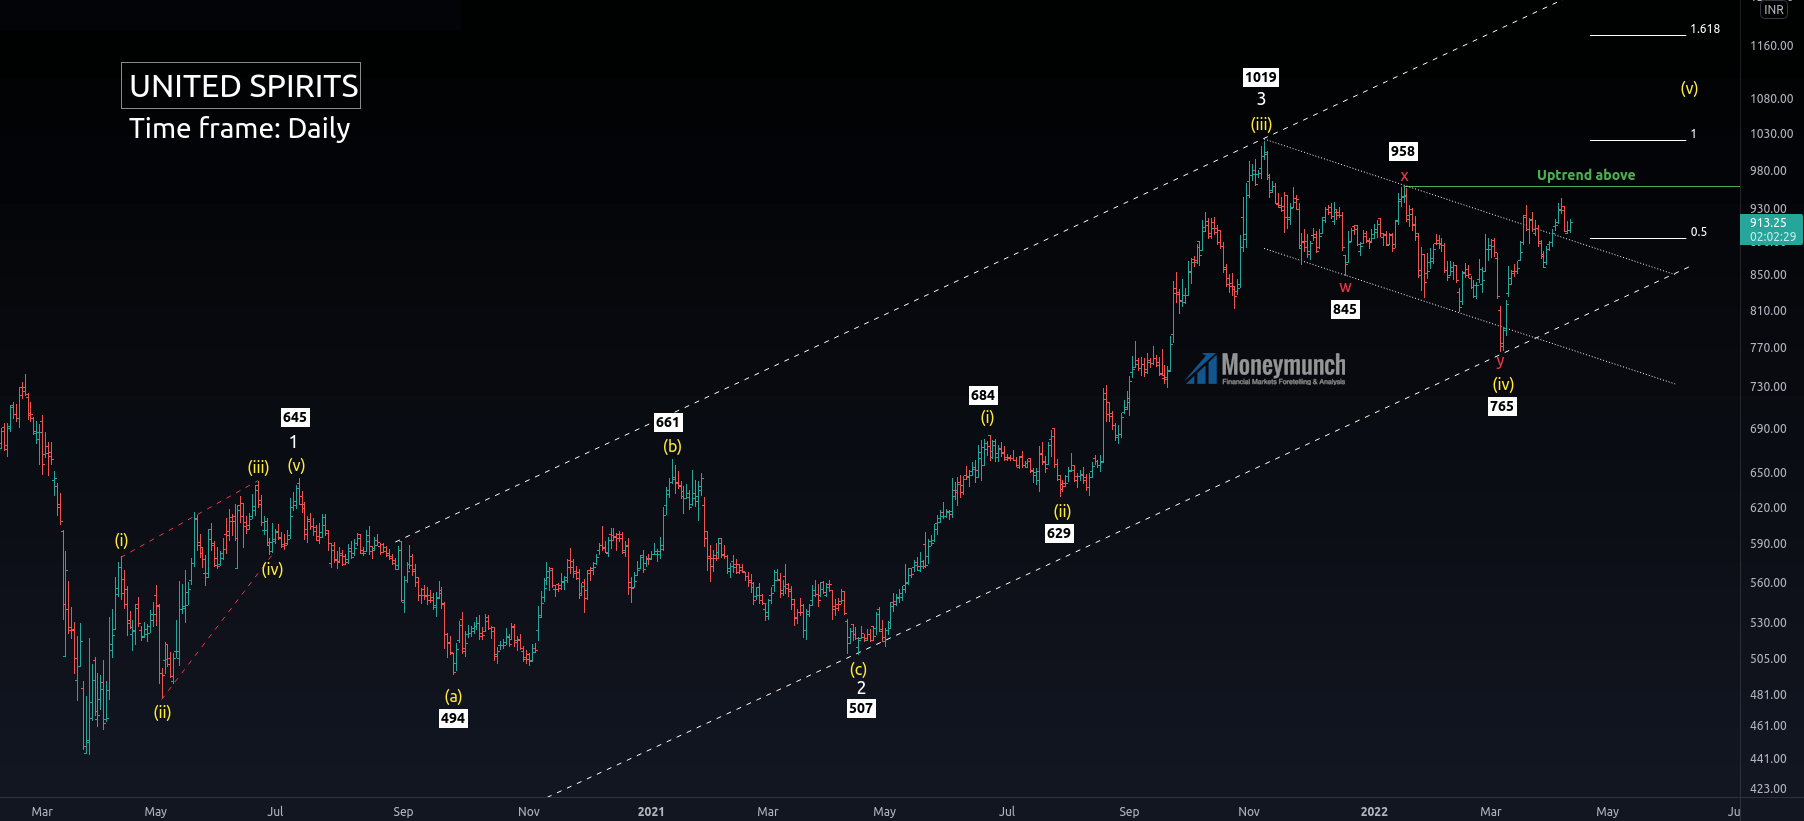
Sub-wave cycle of wave ((5)) starts from 442.65. Price accomplished a corrective wave ((iv)), and price surged rapidly.
Wave ((iv)) is a double zigzag that contains seven waves.

If the price fails to break wave (x), Traders can sell for the following targets: 989 – 864 – 811. (U-turn levels).

Wave X holds most of the power of the impulse. If the price is capable to sustains above wave X, traders can expect the following targets: 974 – 1020- 1178+. Traders can enter at the 50% level of the current price move.
Note: trend never establishes without confirmation from wave (X).
To become a subscriber, subscribe to our free newsletter services. Our service is free for all.

Continue reading

NSE Sail Stock Price Can Hike Rs.50+ From Here

Free nse stock sail chart calls

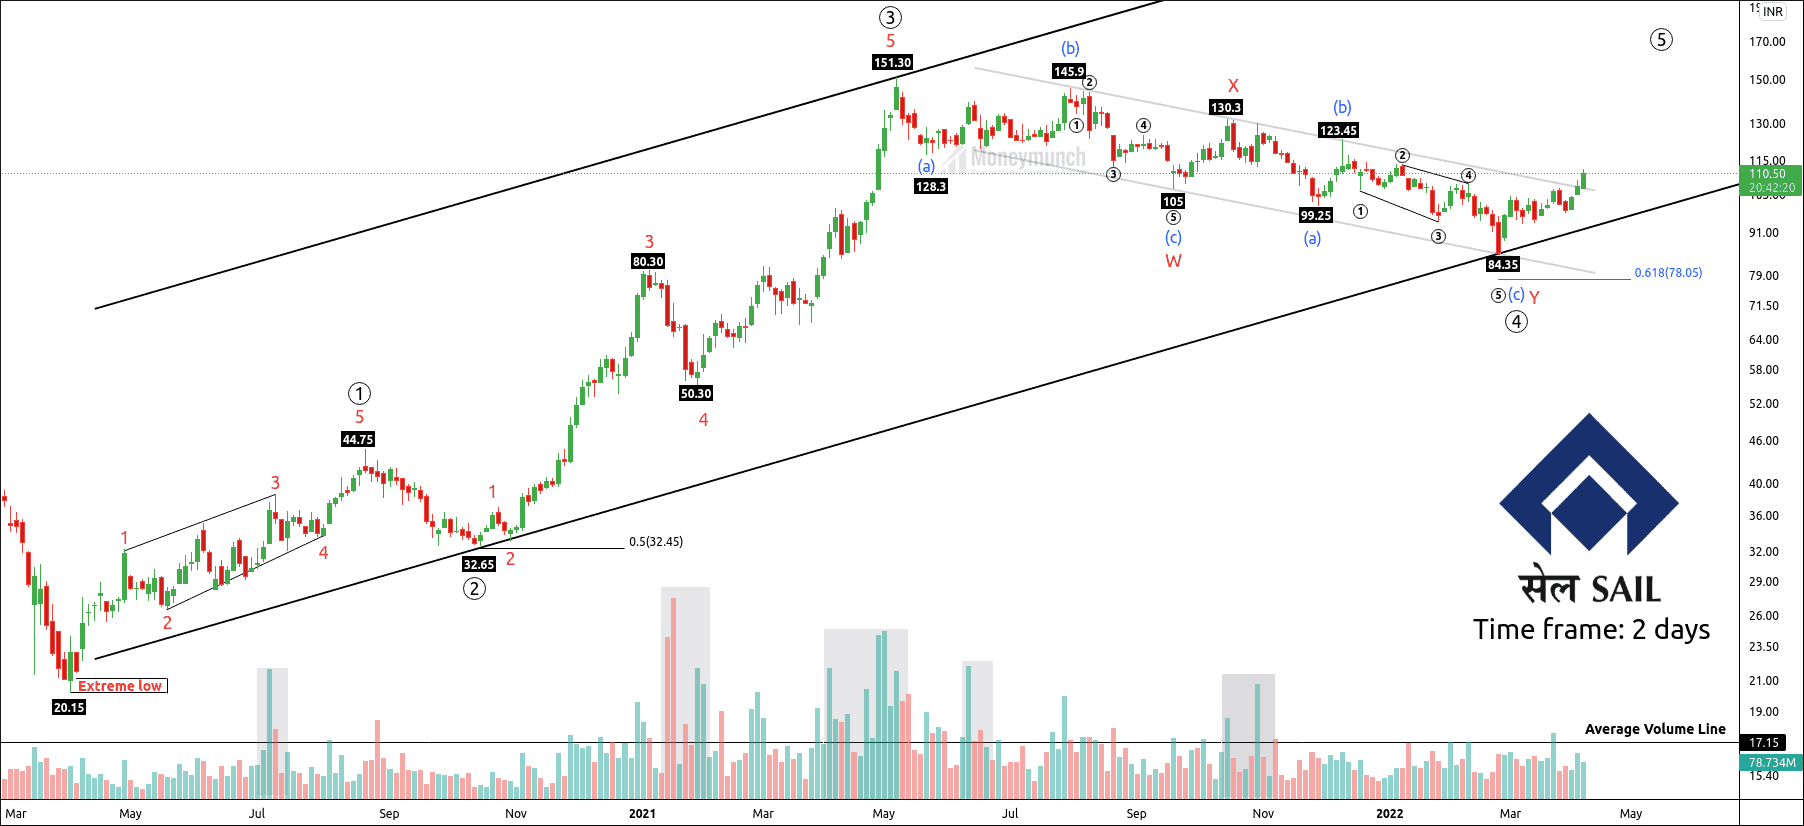
SAIL has been forming descending channels for more than 47 weeks. It has accomplished corrective structure((4)) at 61.8% of wave ((3)).

Wave ((4)) is a double combination pattern. After creating a low of 84.35, the price started marching upward.

If the price breaks out of the corrective channel, traders can trade for the following levels: 123 – 143 – 162+.  But bears can take control if there is a fake-out.

To become a subscriber, subscribe to our free newsletter services. Our service is free for all.

Continue reading

NSE Adani Ports Is Growing Near Truncation Zone

Free nse stock adaniport chart calls

Key Level: 824 & 853
Adani Port has broken down the corrective wave X and started forming an impulse wave ((5)).

Price had broken down the 8-month-old correction, and Adani Port surged rapidly. Adani Port can U-turn from 1.618% at 1049. It is a reverse Fibonacci of wave ((4)). Currently, the price is at the 78.6% reverse Fibonacci level at 853.

If Adani port fails to break the previous high at 901, there will be a case of truncation. It shows that the current impulsive move has a lack of demand pressure. Then the decline will be 3x more powerful than the normal corrective wave.

To become a subscriber, subscribe to our free newsletter services. Our service is free for all.
Continue reading

NSE Apollo Hospital Trading Call – Bearish?

Free nse stock apollohospitals chart calls

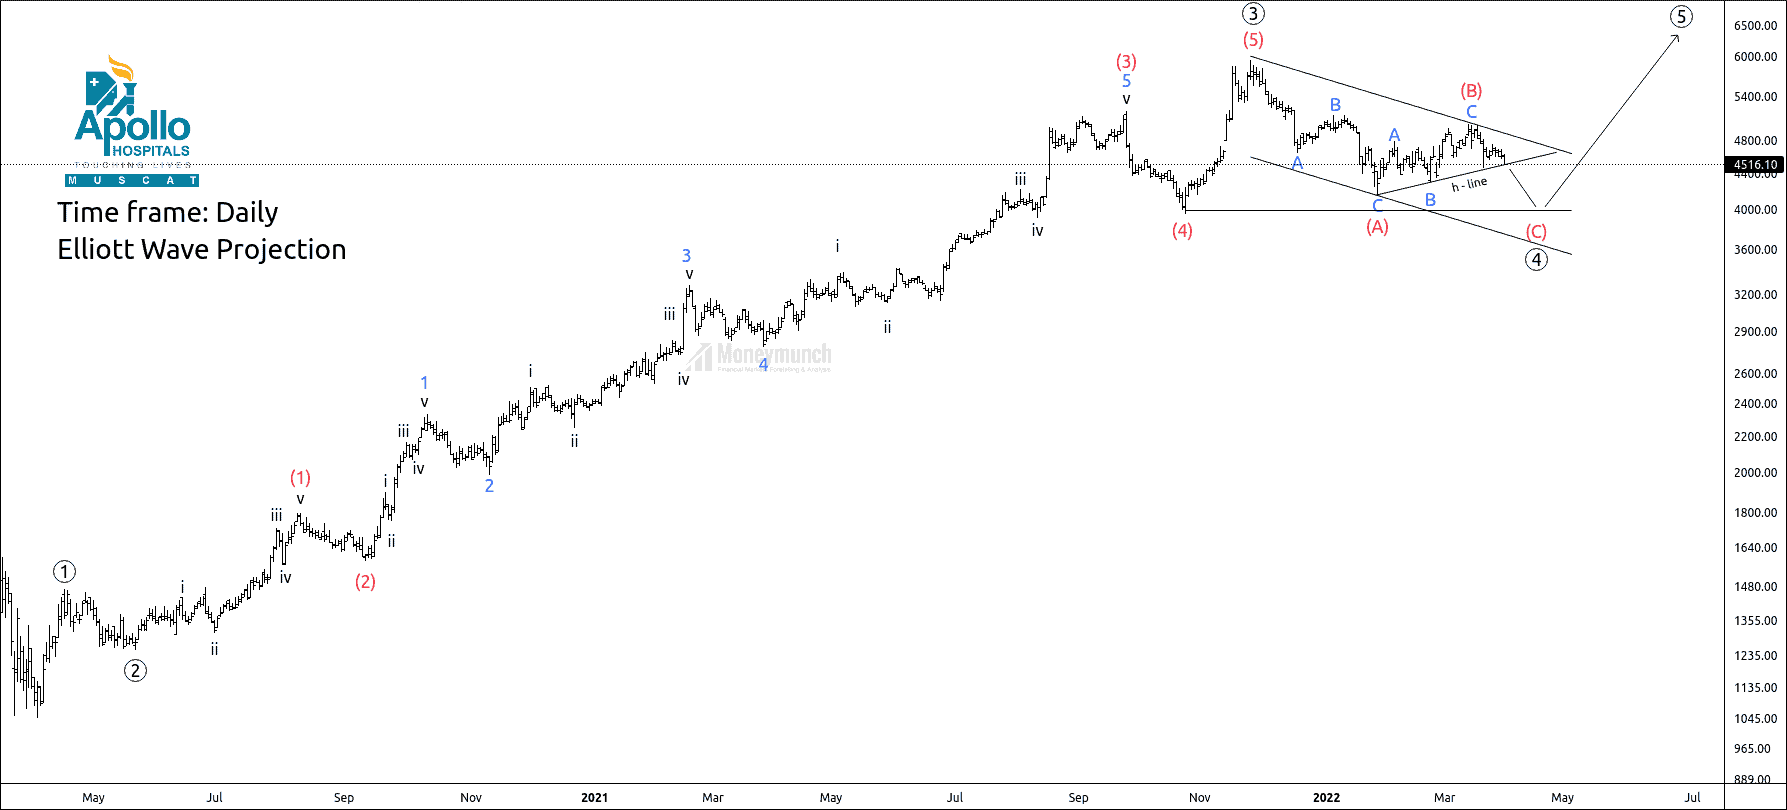
Apollo hospital is preparing for the last corrective move

Key Level: 4475 and 5013

Apollo hospital had completed Impulsive wave ((3)) at 5935 and started corrective wave ((4)).

If the price breaks the H-line, traders can sell for the following target: 4437 – 4356 – 4239 below. These are the price levels where the price can u-turn for an impulsive wave ((5)).

A corrective wave is the construction of a three-wave and evidence of an impending impulsive wave.

Traders can also initiate a long setup only in price breaks the impulsive channel. I will upload a long trade setup after the accomplishment of wave ((4)).

To become a subscriber, subscribe to our free newsletter services. Our service is free for all.
Continue reading