Only premium subscribers can read the full article. Please log in to read the entire text. If you don’t have a login yet, please subscribe now to get access.
Chart Pattern Analysis: 1) Bullish Cup & Handle Pattern:
Timeframe: Weekly
The cup and handle pattern is a bullish continuation pattern. To validate this pattern, traders should look at the following checklist:
Prior trend: As it is a continuation pattern, the price should have a prior bullish trend.
Length & Depth: Normally, a “U” shape longer cup provides a more accurate bottom than a “V” shaped cup. Price has formed 41-week-old cup, which is not too deep. The cup should not retrace more than 61.8% of the depth of the last swing. The general depth of the cup is 50% of the previous move.
Handle: We should not trade deep handles. It suggests weak demand pressure. The handle should not retrace more than 1/3 or 50% of the cup. In this security, the price retraced 50% of the cup.
Volume: Volume decreases during the decline and surges after the breakout.
Breakout, target, and stop-loss: Breakout will confirm when the price will break out the neckline resistance with good volume only. The target of a trade can be determined by the cup’s depth. There are two stop-loss points: (i) low of handle (ii) middle point of the handle
Failure: Failure will result in a double top reversal pattern.
2) Consolidation Box/Value Area:
Timeframe: Daily
NSE KPITTECH has found a consolidation box on the daily timeframe chart. Price took support from the control line as moving toward the upper band of the channel. The upper line indicates resistance, so a resistance breakout increases demand pressure. After retracement, if the price sustains above the upper band of the channel, traders can set their targets up to 940. It’s better to trade after a pullback because the price may face resistance near an all-time high.
Only premium subscribers can read the full article. Please log in to read the entire text. If you don’t have a login yet, please subscribe now to get access.
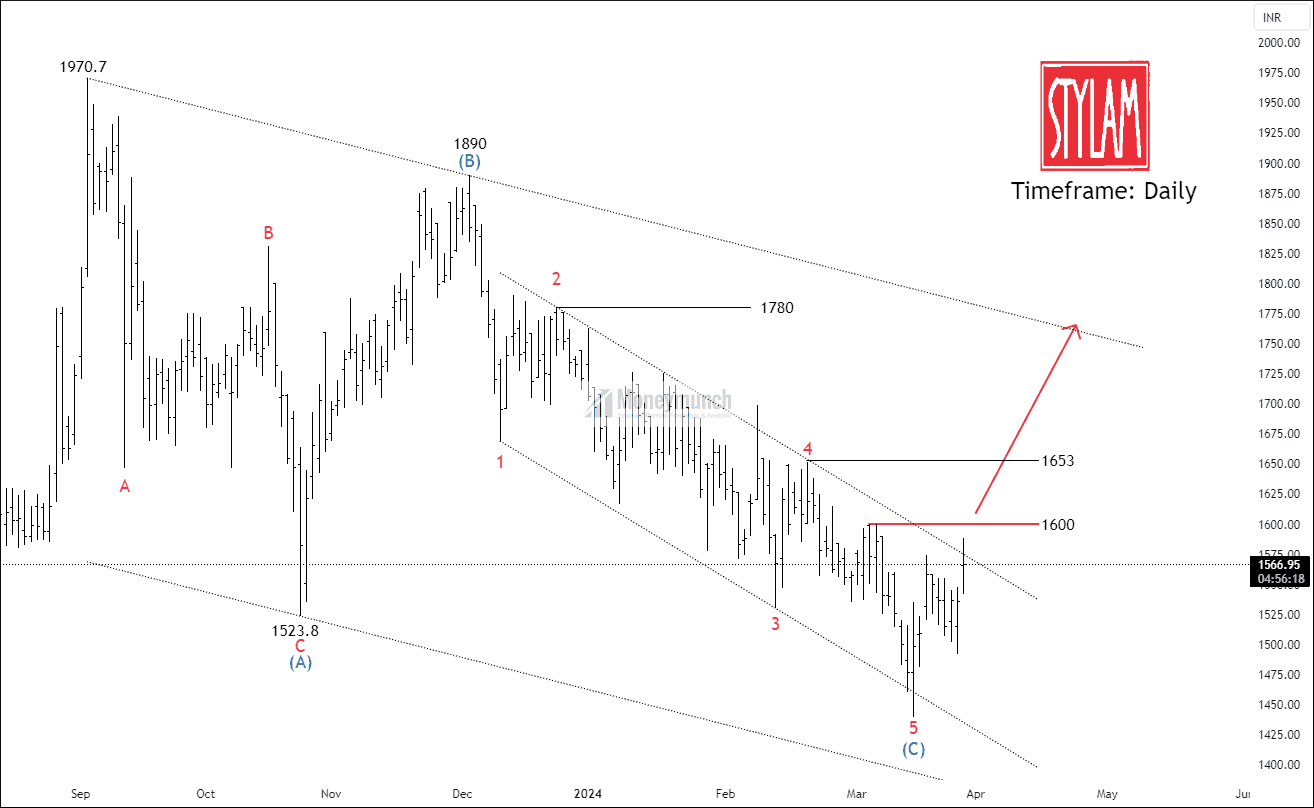
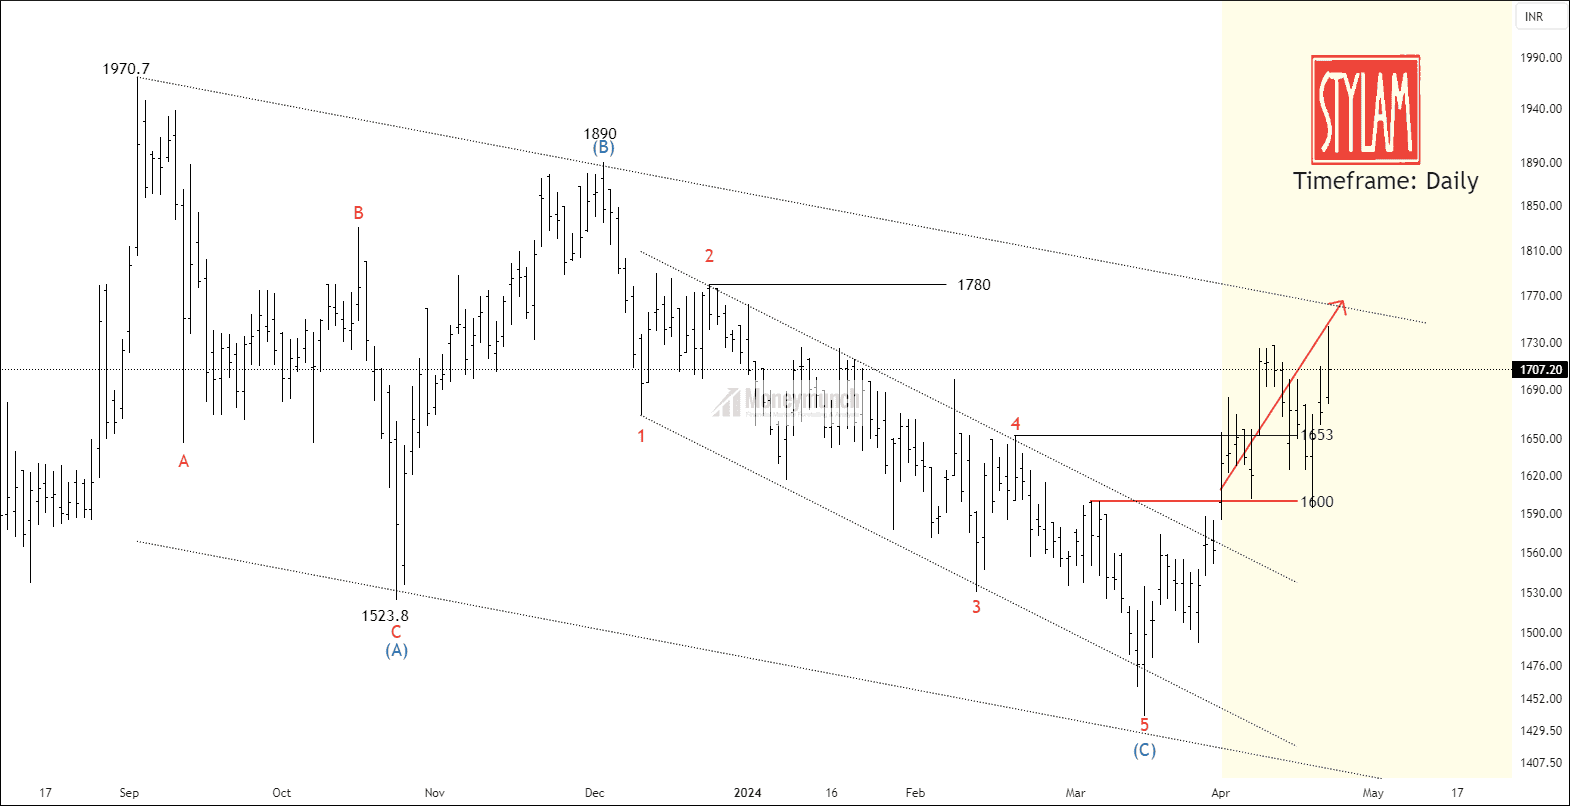
NSE BAJAJ HOLDING has been forming the correction for 19 weeks. Price has established an ending diagonal in wave C, which signals the downward move is not strong enough for a sharp fall.
According to Elliott waves, if the price sustains above the previous wave (4), traders can trade for the following targets: 6120 – 6229 – 6324+.
As you can see, the price has formed a double bottom on the daily timeframe chart, and 6000 is the neckline of the channel. The corrective structure has retraced 61.8% Fibonacci retracement of its previous move.
Lock
Only premium subscribers can read the full article. Please log in to read the entire text. If you don’t have a login yet, please subscribe now to get access.
I will update further information for premium subscribers only.
I have mentioned clearly, “Wave 4 is a crucial support level for the prices. If the price breaks down 4th wave at 905, traders can sell for the following targets: 880 – 857 – 832+. Safe traders can wait for a pullback to minimize their risks.”
Timeline:
[23 January 2023]
09:40 AM – Price gave a pullback by making a lower high of 939.5.
[27 January 2023]
9:15 AM – Price touched the first target of 880.
The first target has delivered more than 70 points or a 7.5% return in just seven trading sessions. Continue reading