Elliott Wave Analysis
Wave ((1))
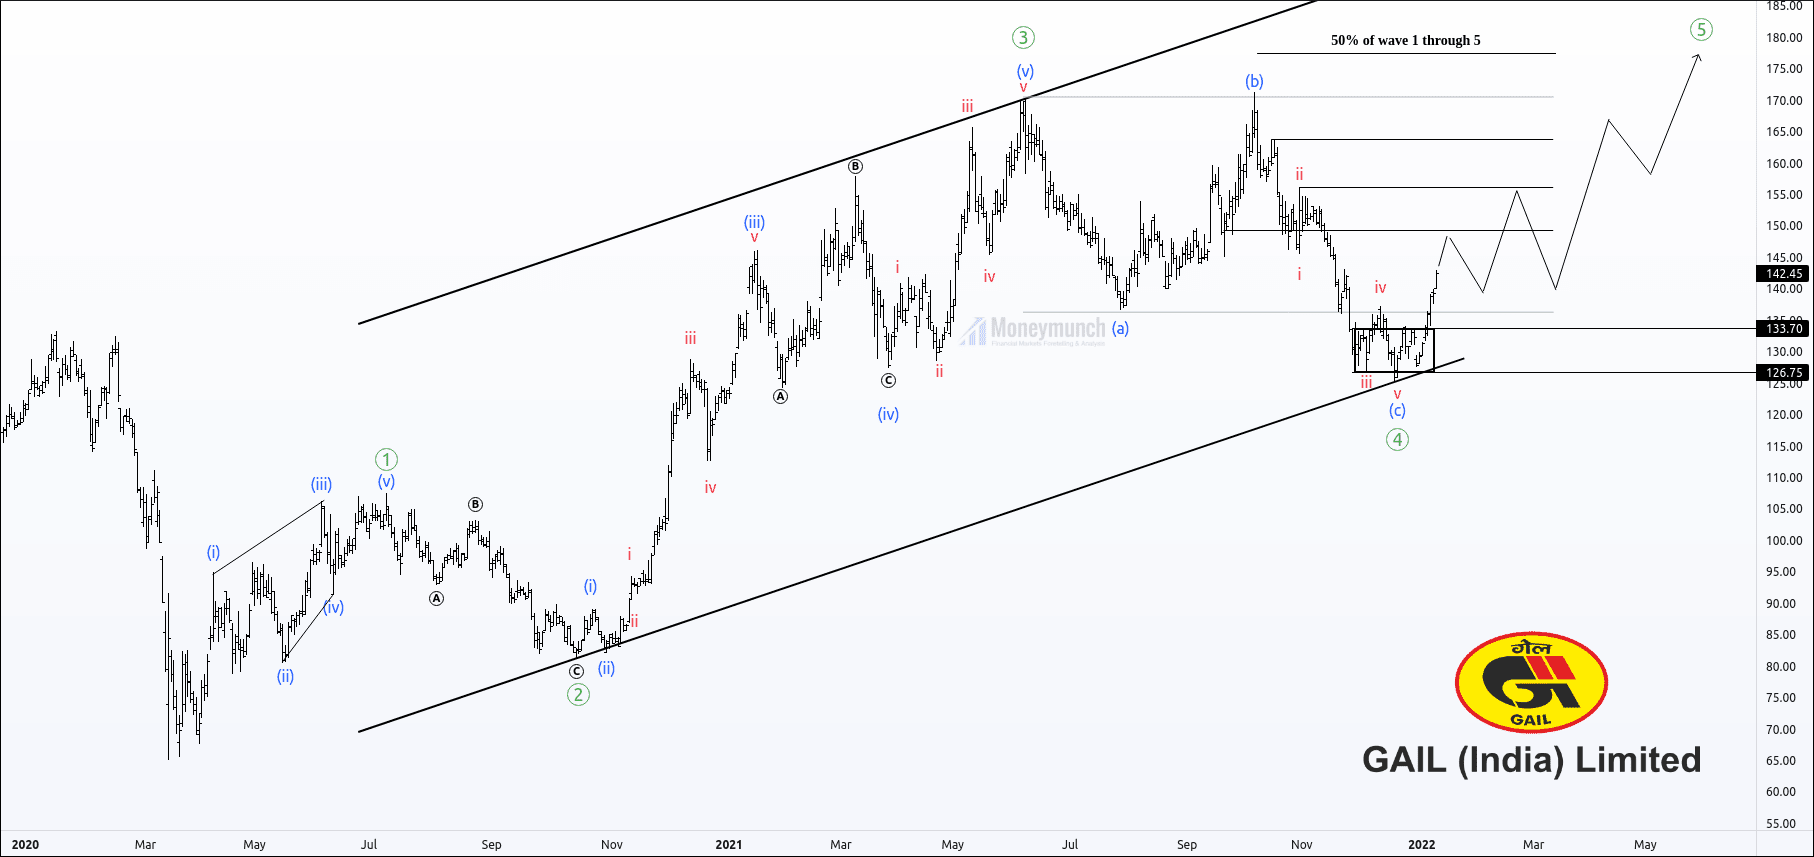
Price has started an impulsive structure on 24 March 2020. It has exceeded the supply pressure by creating demand.
Wave ((1)) formed as a leading diagonal because there was the existence of seller and supply pressure.
All the fundamentals were bearish before this move. So, it was a bit risky to think about a trend change without any proper signal.
Price has made a high of 9989, and the fifth terminating wave completed the wave ((1)). It has started falling downward, and traders thought that price could make another leg down.
Wave ((2))
5th sub-wave has completed the wave ((1)).
Once again, the price hasn’t signaled trend change, and the bearish perspective was less risky than the bullish perspective.
Corrective wave 2 created a sharp correction, but it couldn’t break the 50% level, and the price surged.
Price made a higher low.
Wave ((3))
Price broke the high of wave ((1)) at 9989, which has given evidence of an impulsive atmosphere.
The price is going for a new high with heavy demand pressure, which has crushed supply pressure.
Bullish fundamentals and public participants have skyrocketed towards a new high.
Sub-wave of wave ((3))
Sub-wave 1 is an impulse at 1032.
Sub-wave 2 is and sharp correction.
Sub-wave 3 is an impulse with 161.8% Fibonacci Extension.
Sub-wave 4 is a deep correction at 10790.
Sub-wave 5 is the power extended wave at 15431.
Wave ((3)) has made a high of 15431, and public participants started booking profit.
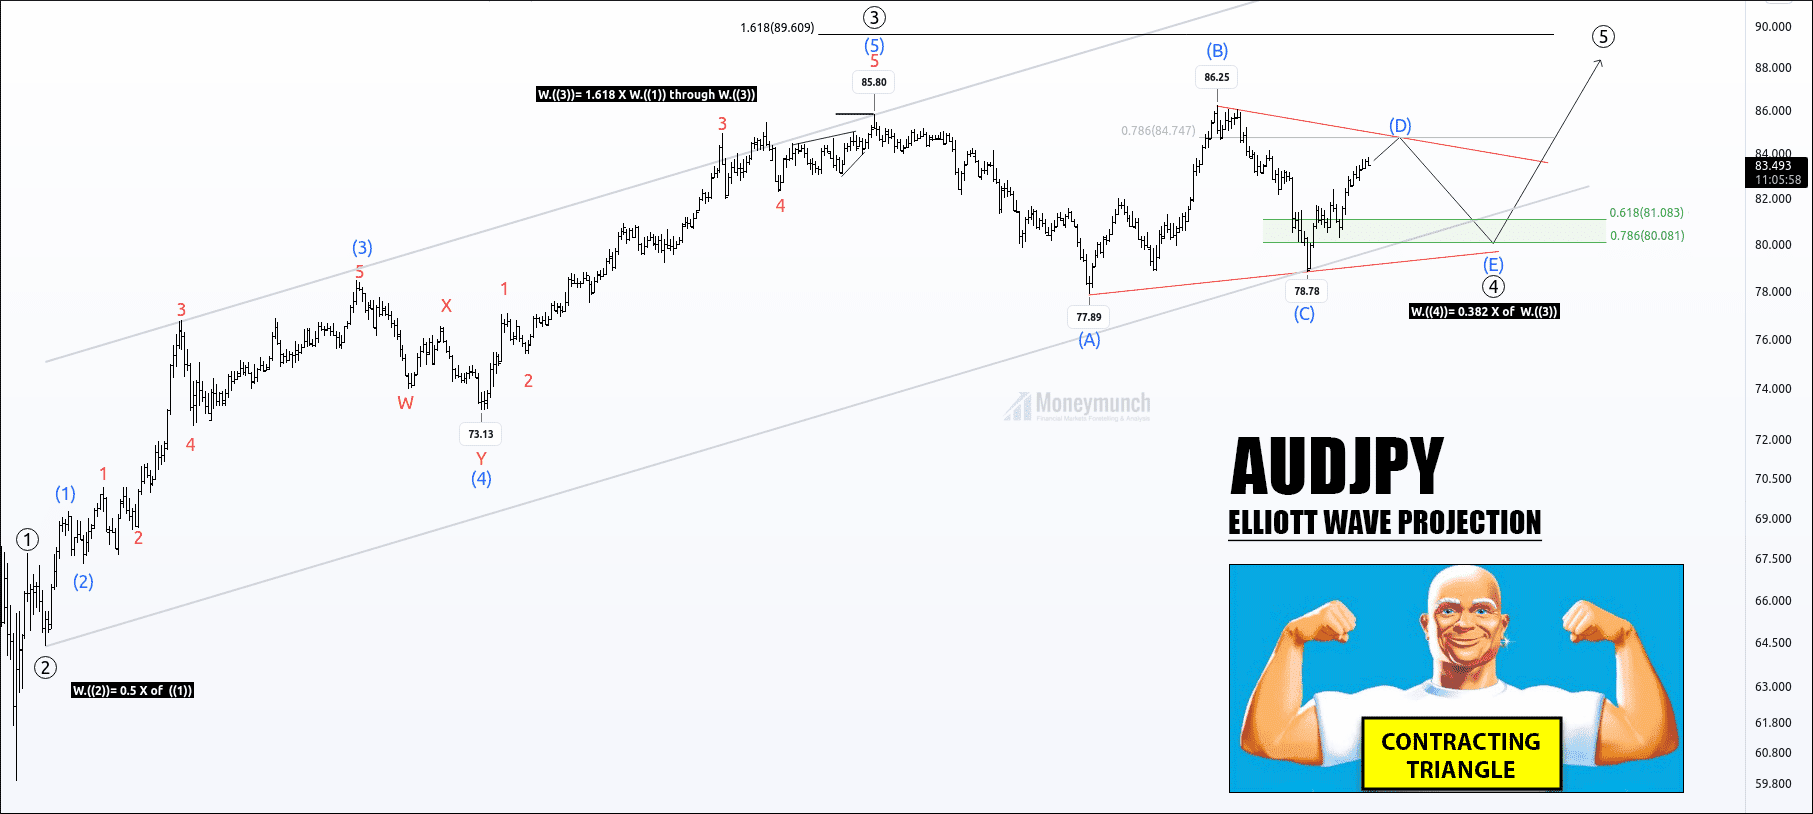
Wave ((4))
After creating a high of 15431, buyers got surprising disappointment.
Price has started falling due to short-term bearish sentiments and the profit booking.
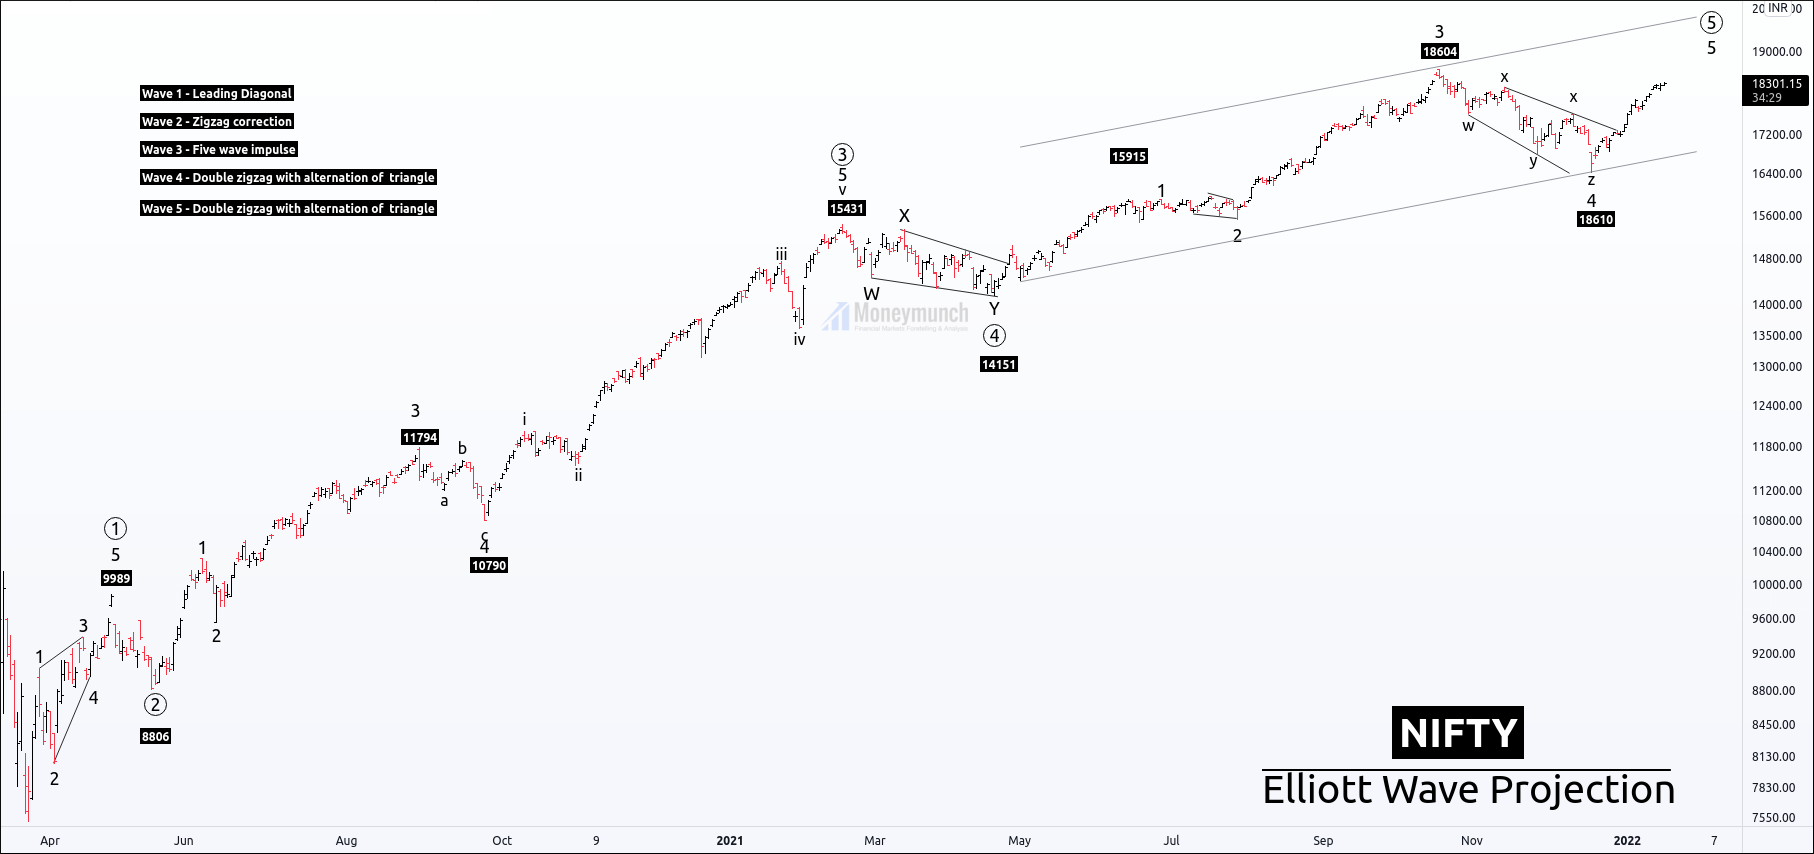
Wave ((4)) is a double zigzag pattern w-x-y, which indicates the single correction was not enough to correct the strong impulse move.
It has an alternation of the triangle.
Price has completed corrective wave ((4)) at 14151.
Wave ((5))
After the accomplishment of wave ((5)), the price started a bullish move.
Price broke wave X, which signaled a bullish atmosphere.
Due to surprising disappointment, the price move is not as strong as we have seen in wave ((3)).
sub-wave of wave ((5))
Wave 1 is a five-wave impulse
Wave 2 is a less time-consuming wave.
Wave 3 is a normal extended wave.
Wave 4 is a deep correction triple zigzag (w-x-y-x-z), and broadning wedge .
Wave 5 is forming and has confirmed its bullish move by breaking wave X.
Conclusion:
I have the following reasons to consider the current move as an impulsive wave.
Wave counts without invalidation.
Price broke the X wave of the corrective structure.
Sub-wave 4 of wave ((5)) retraced 61.8% of wave 3. As per rule, the 4th wave can’t retrace more than 78.6% of wave 3.
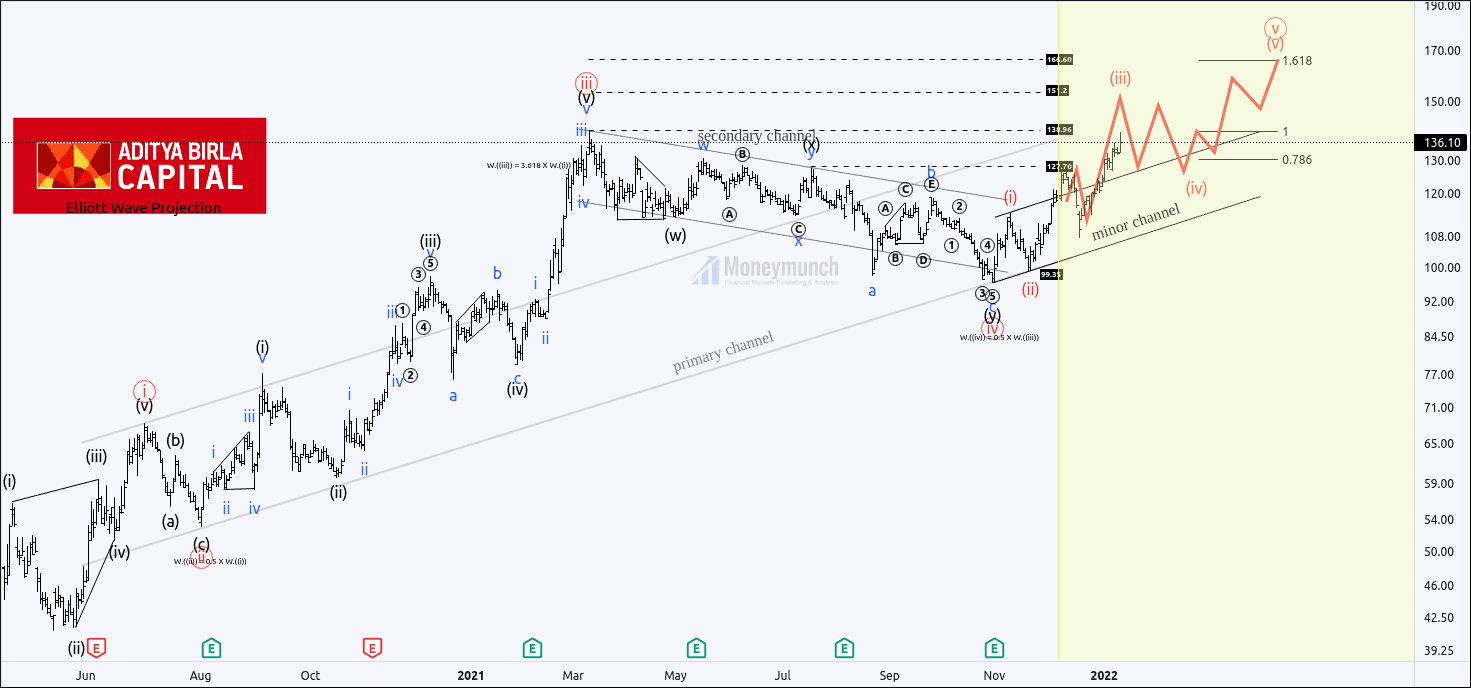
Scenario 1:
Price is on the bullish momentum, but if price breaks down the wave X to take support, we can expect the following levels: 17790-17528-17316.
Scenario 2:
If the price is refusing for a retracement and continuously creating new highs, we price can go for 18600- 18825+
Timeframe: 1 – hour
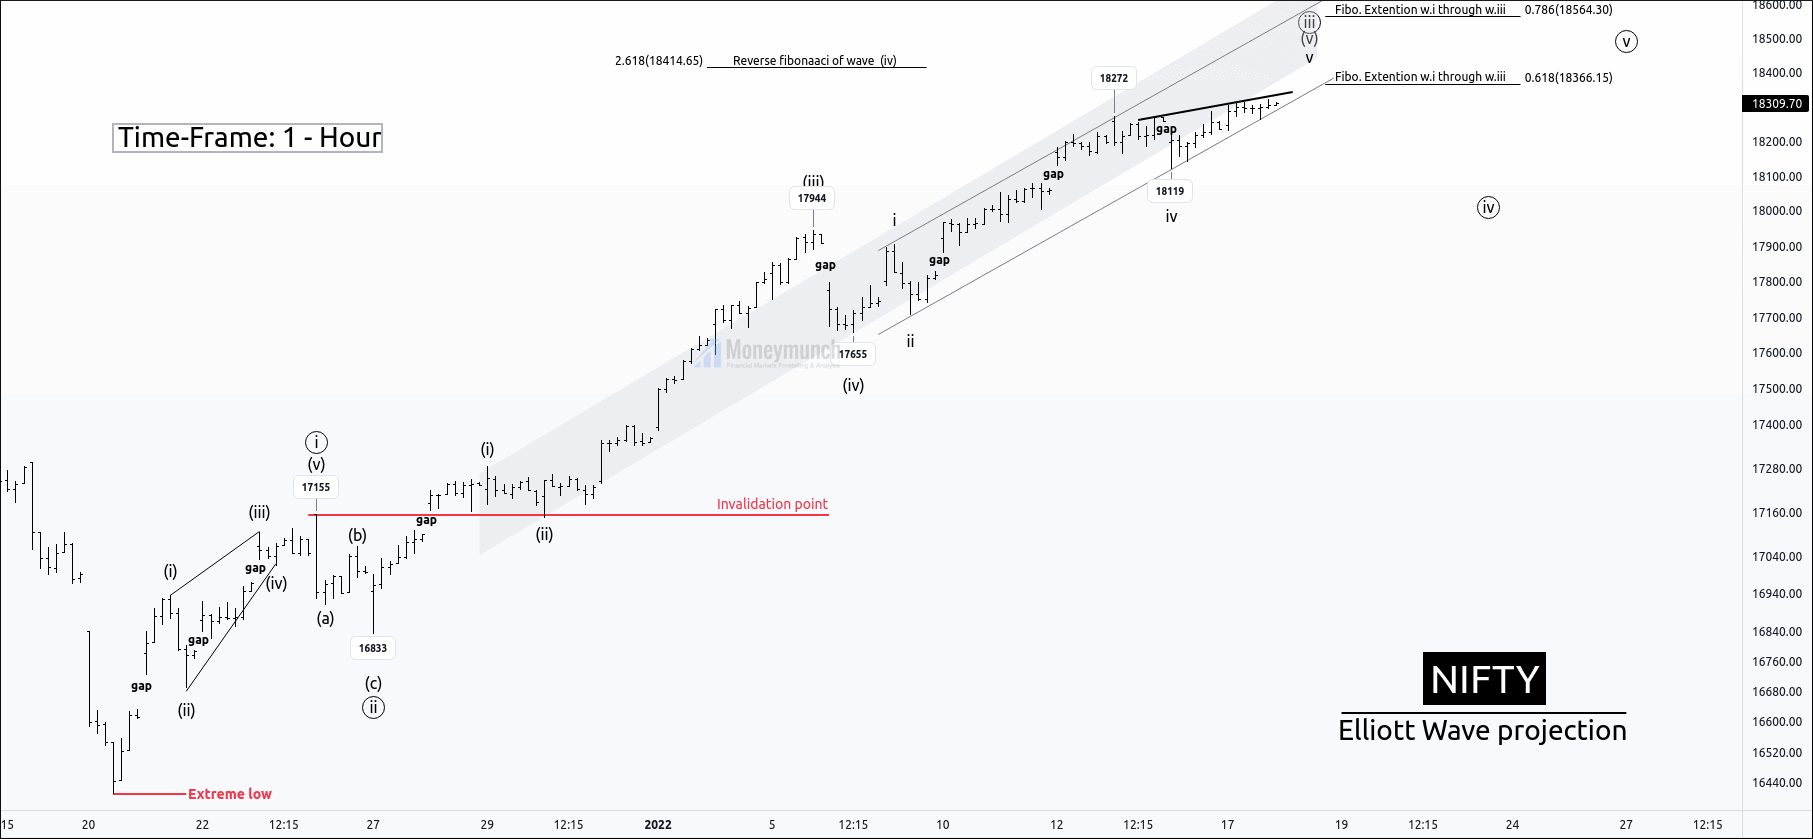
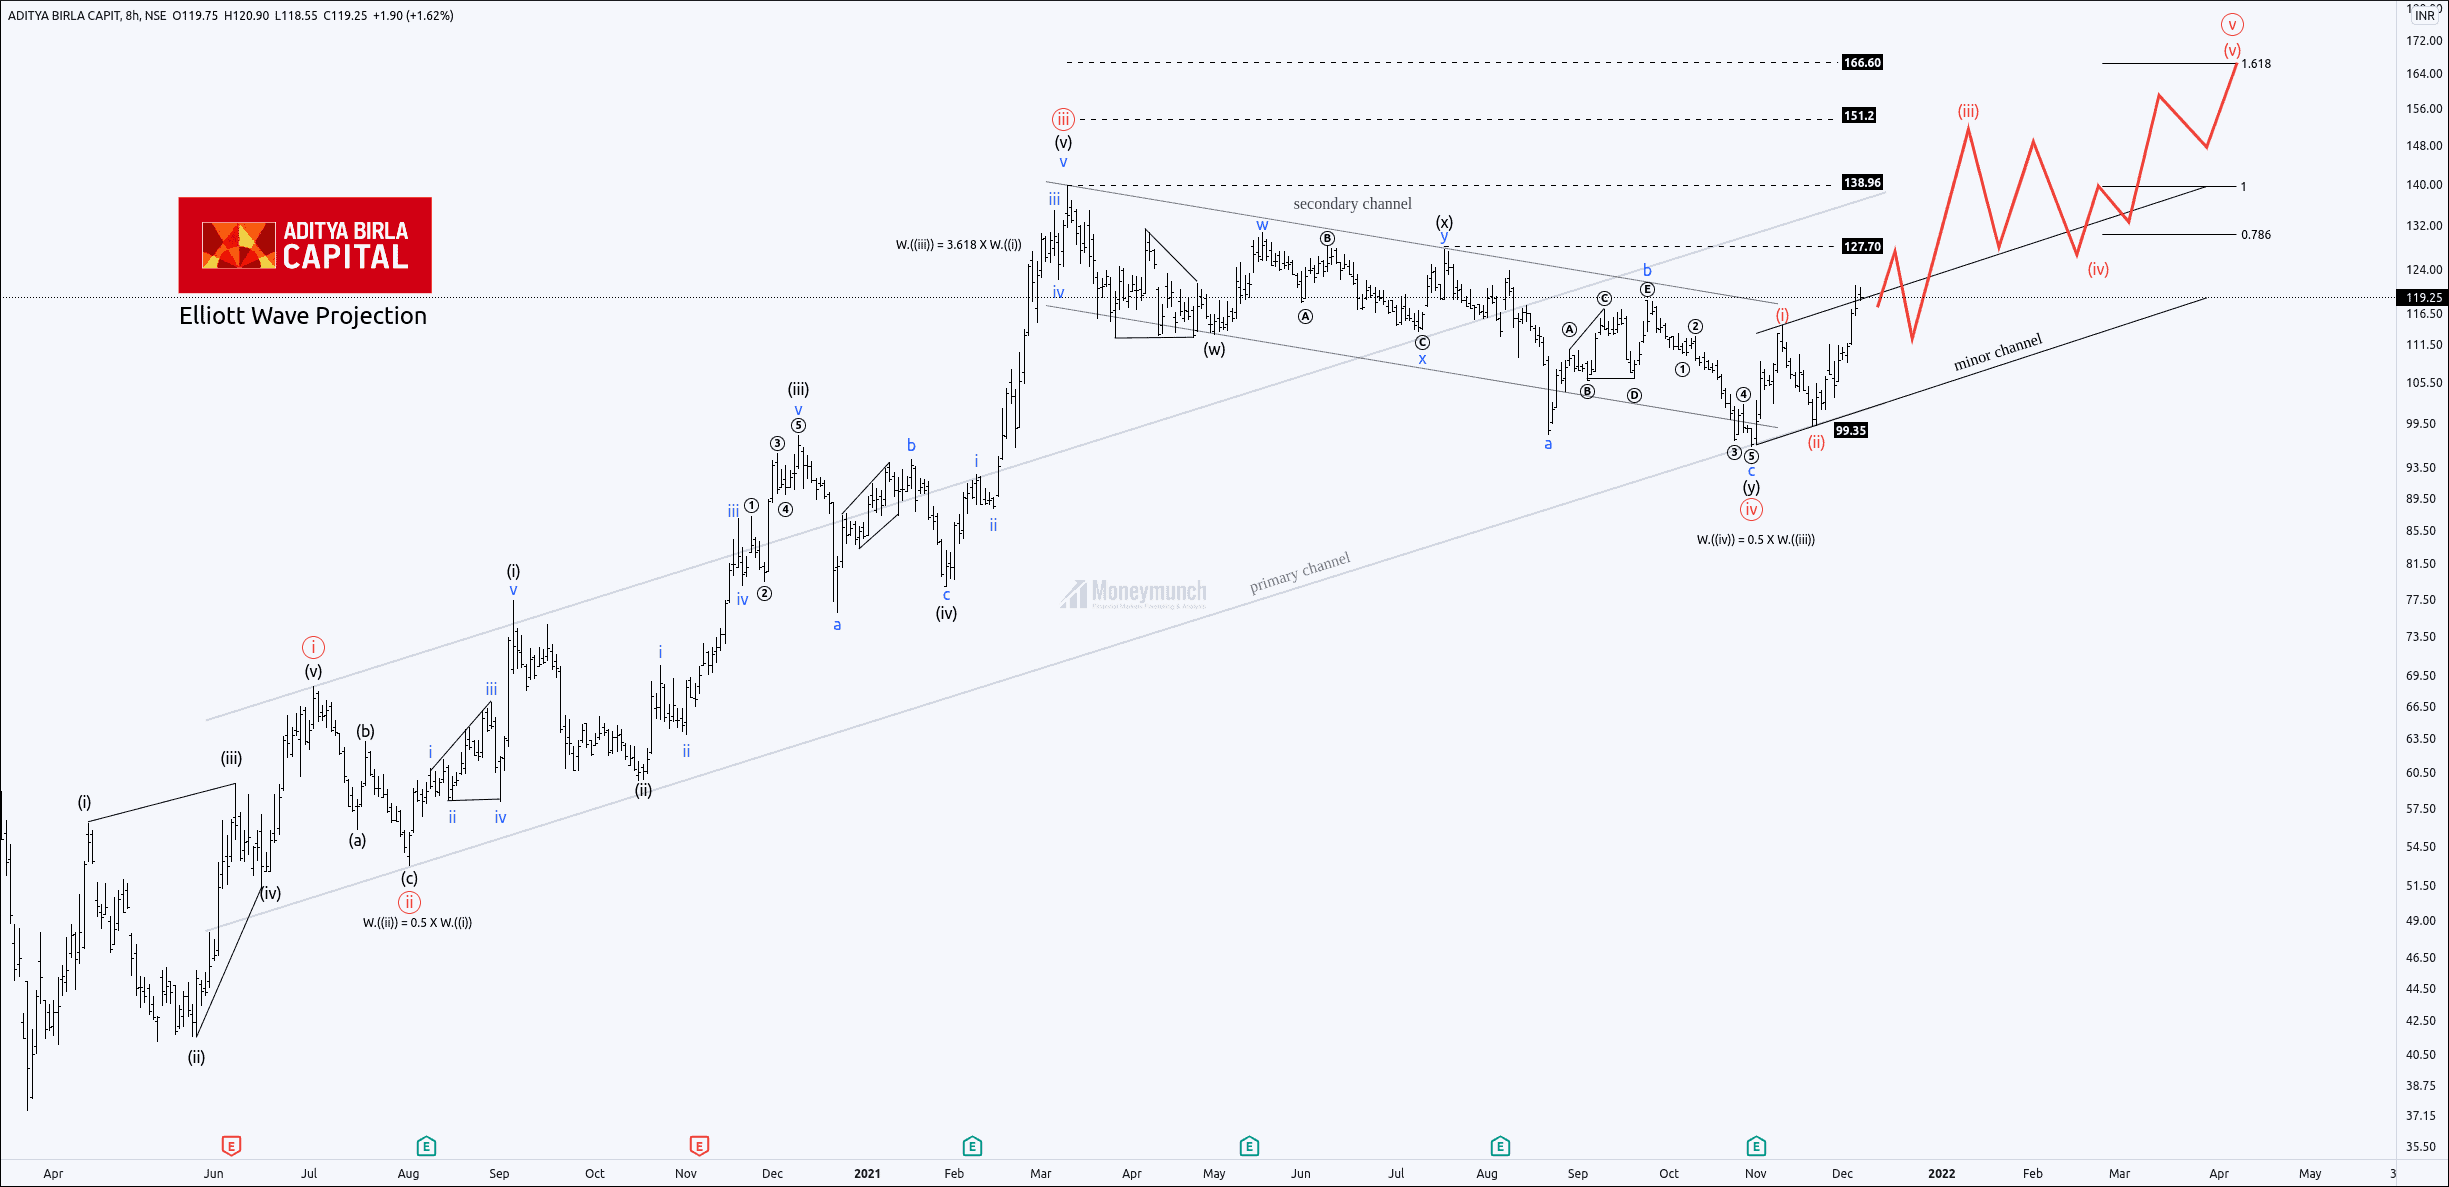
Let’s zoom the 5th impulsive wave of wave ((5)) to know the current situation of the Wave cycle.
The ending point of wave 4 is the starting point of wave 5.
After the accomplishment of, triple zigzag, the price has started an impulsive wave, and it has broken the X wave.
X was had holder the correction, and break out of X wave increased public participant in nifty.
Wave formations of the impulsive wave 5 of wave ((5)).
Wave ((i)) is a leading diagonal.
Wave ((ii)) is a zigzag correction, retraced 50% of wave ((i)).
Wave ((iii)) is a five-wave impulse, where sub-wave v is near to being completed.
After the completion of wave ((iii)), the price will start the corrective wave ((iv)). The question is, how to know if the corrective wave started or not?
The best way to find the starting point of the corrective structure is the breakout of the base channel.
If the price breaks the base channel, it may end near the previous wave (iv). I have already mentioned levels in the daily time-frame analysis.
If the price couldn’t break down the parallel base channel, it can create a new high, but it will give a short pullback to increase public participants.
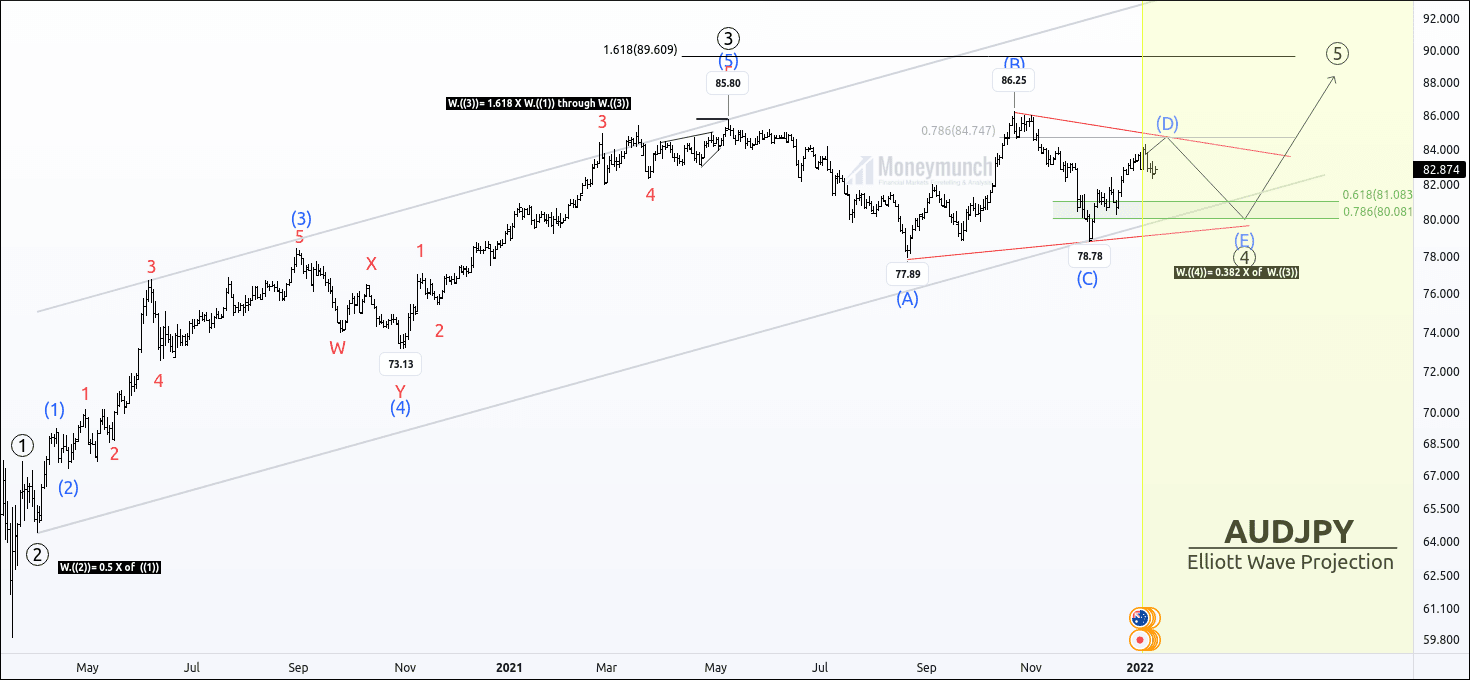
Price Action Analysis
Timeframe: 1 – hour
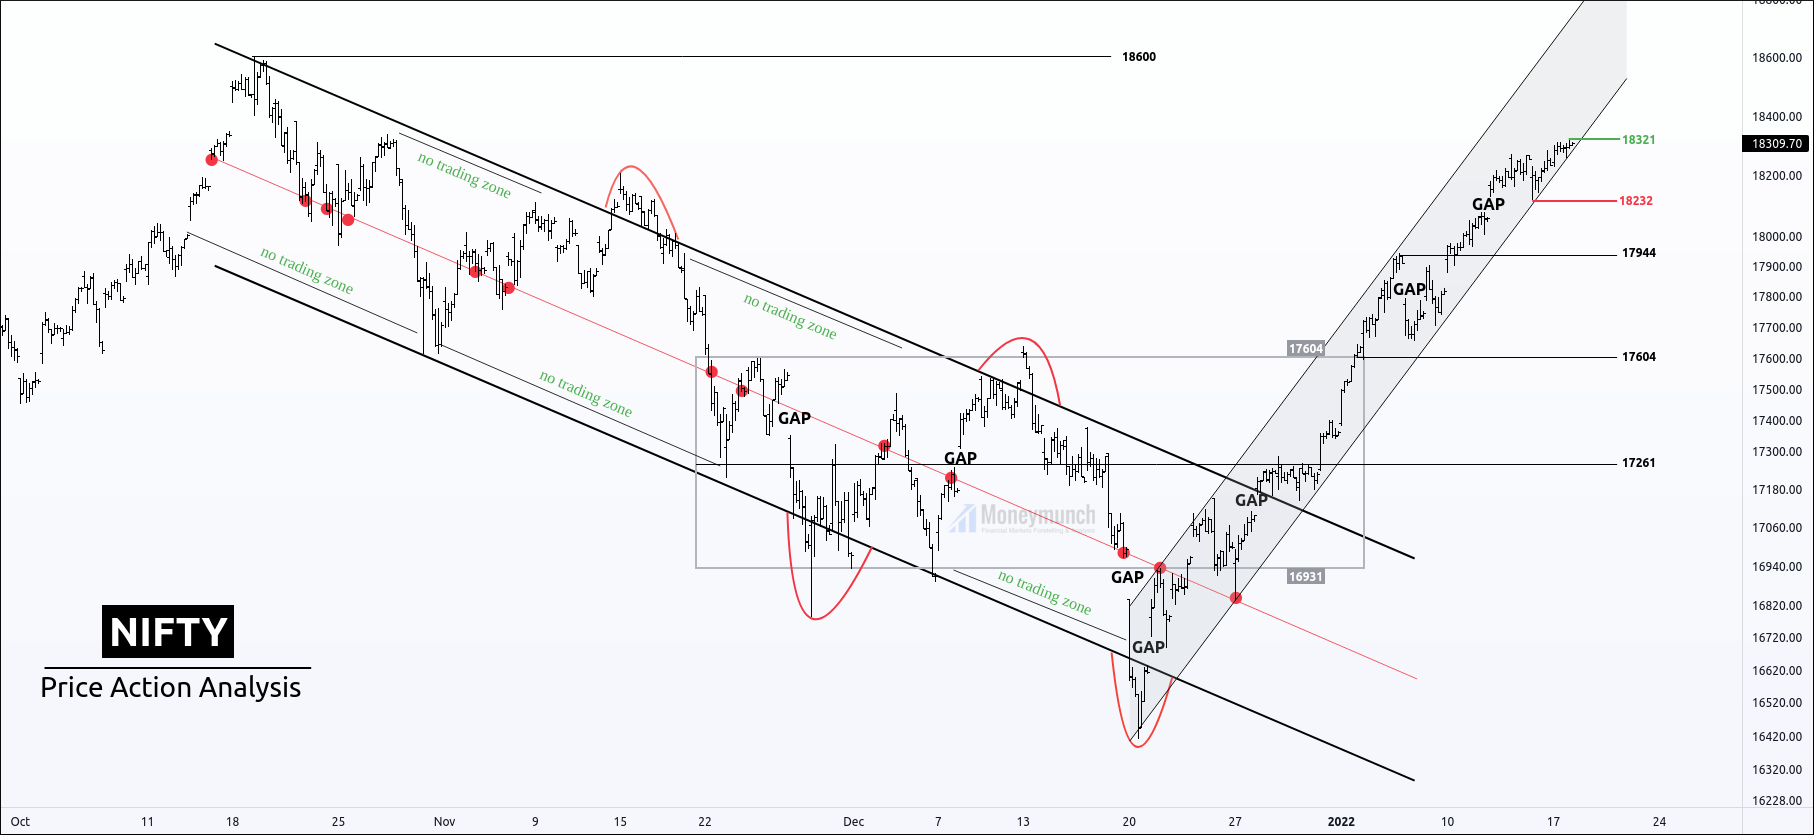
Price has broken out the downtrend channel and started an upward move.
However, the current bullish move looks strong, but the price can’t make a new high without proper retracement.
Nifty can’t get public participants Without trend pause(correction).
If the price breaks the parallel channel, we can expect the following support level: 18232-17944-17604-17261
Please note that the price is bullish above 18250.
If the price takes support on the parallel channel, it can go for 18600-18845+ to touch the upper band of the channel.
To become a subscriber, subscribe to our free newsletter services. Our service is free for all.
 Unlock This Article