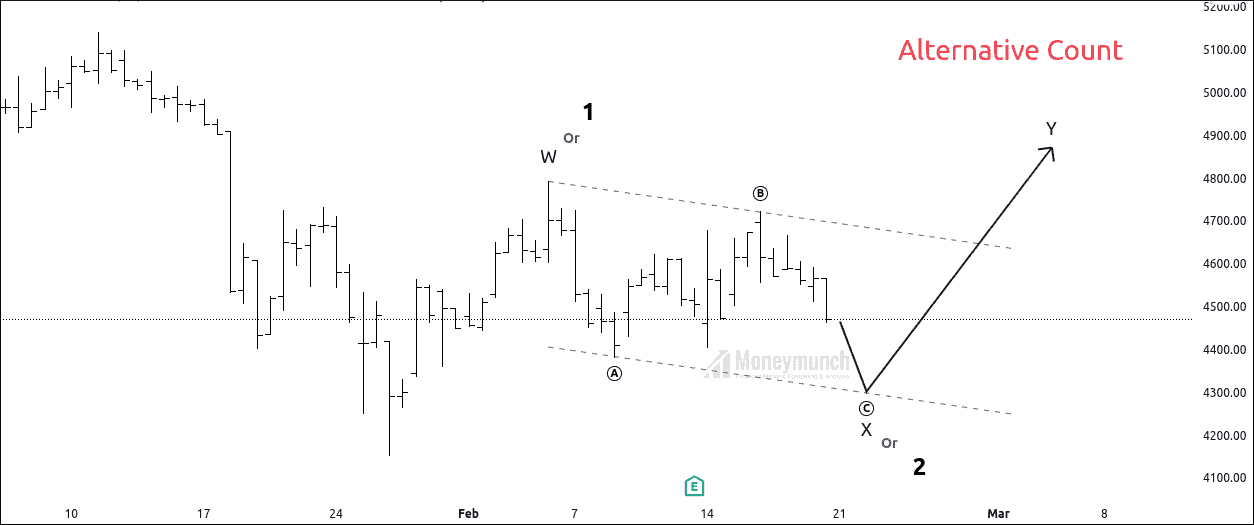
In this outlook, we are covering two scenarios that will be helpful for day traders as well as investors. We should negate the possibilities because Murphy’s law says,
Whatever can happen will happen
Shall we direct jump on the pool? Yes, shallow ends first.
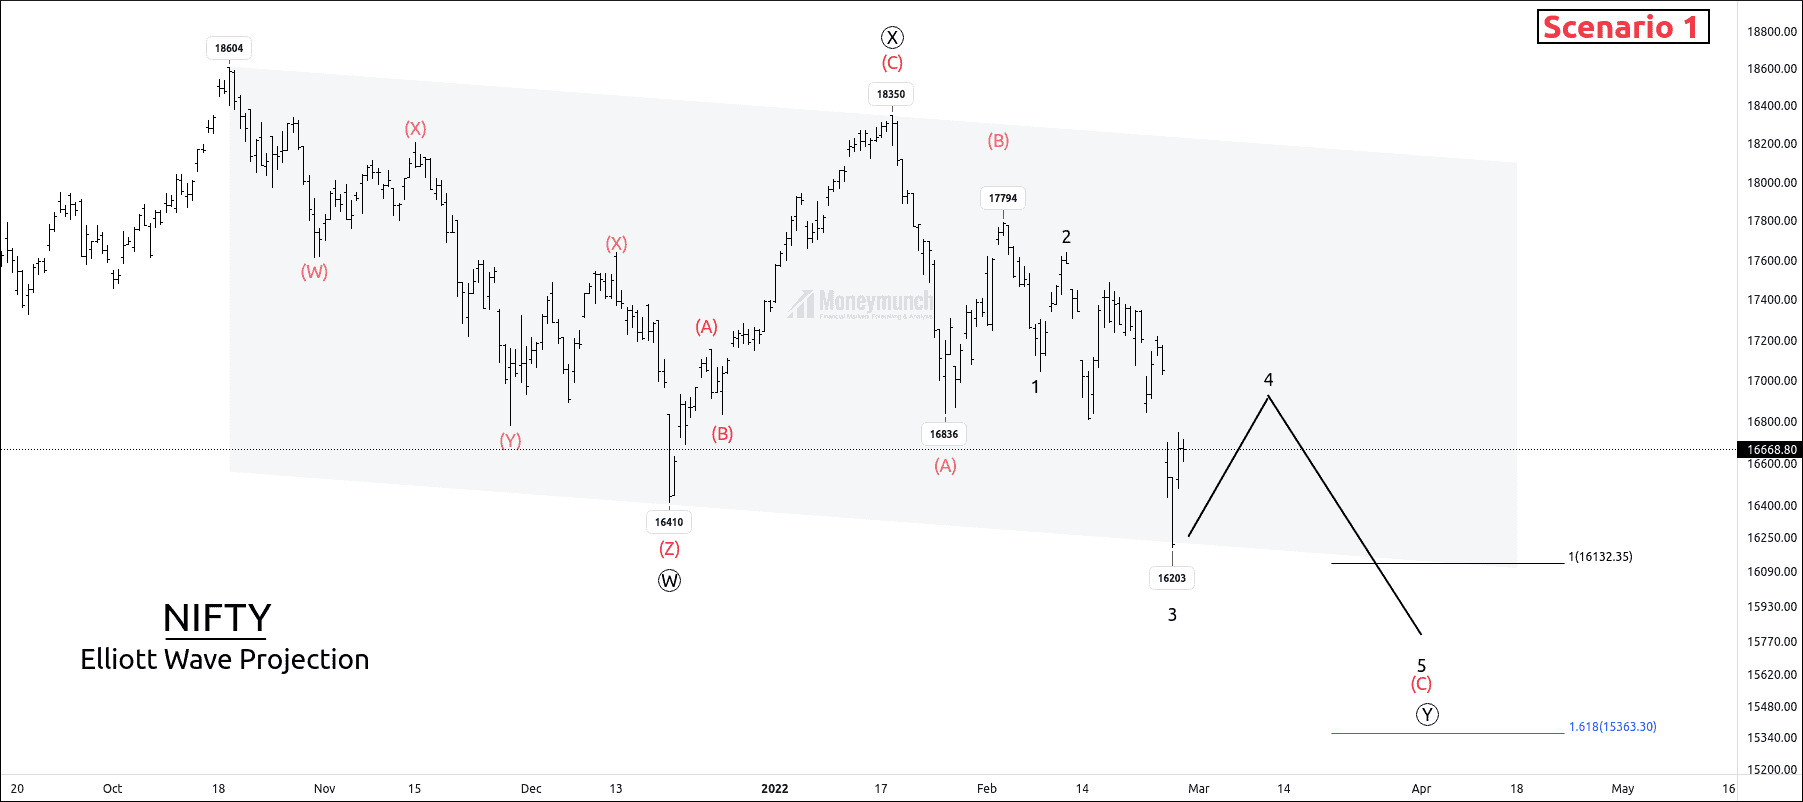
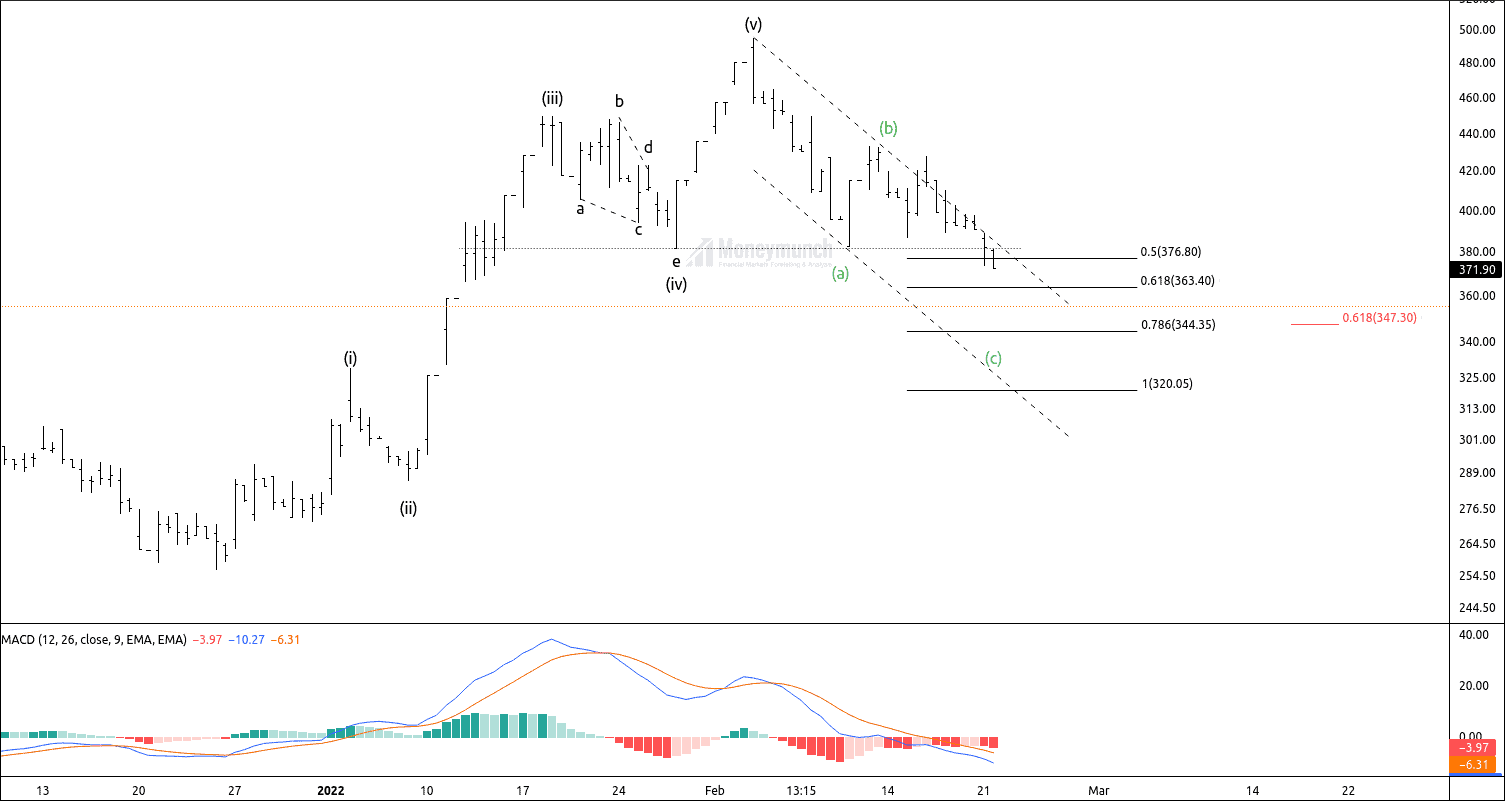
After creating a high of 18600, the price has occurred a double zigzag. Currently, we are riding on the impulsive wave sub-wave 4 of wave C of complex (Y).
Wave Structure:
Wave ((W)) – 16410
+ Internal structure – Triple Zigzag
+ Fibonacci relationship – 50% of wave ((5))
Wave ((X)) – 18350
+ Internal structure – Engaged corrective wave
+ Fibonacci relationship – 100% of wave ((W))
Wave ((Y)) – New low at 16203
+ Internal structure – Zigzag correction
+ Fibonacci relationship – 100% of wave ((w)) at 16156.
Target projection for scenario 1:
- Wave (C) can end near the 1.618% Fibonacci extension of the wave (A) at 15363.
- Wave ((Y)) can cease at 100% Fibonacci extension of wave ((W)) at 16136, but if the price breaks this level, then the next Fibonacci level is 15600.
To become a subscriber, subscribe to our free newsletter services. Our service is free for all.
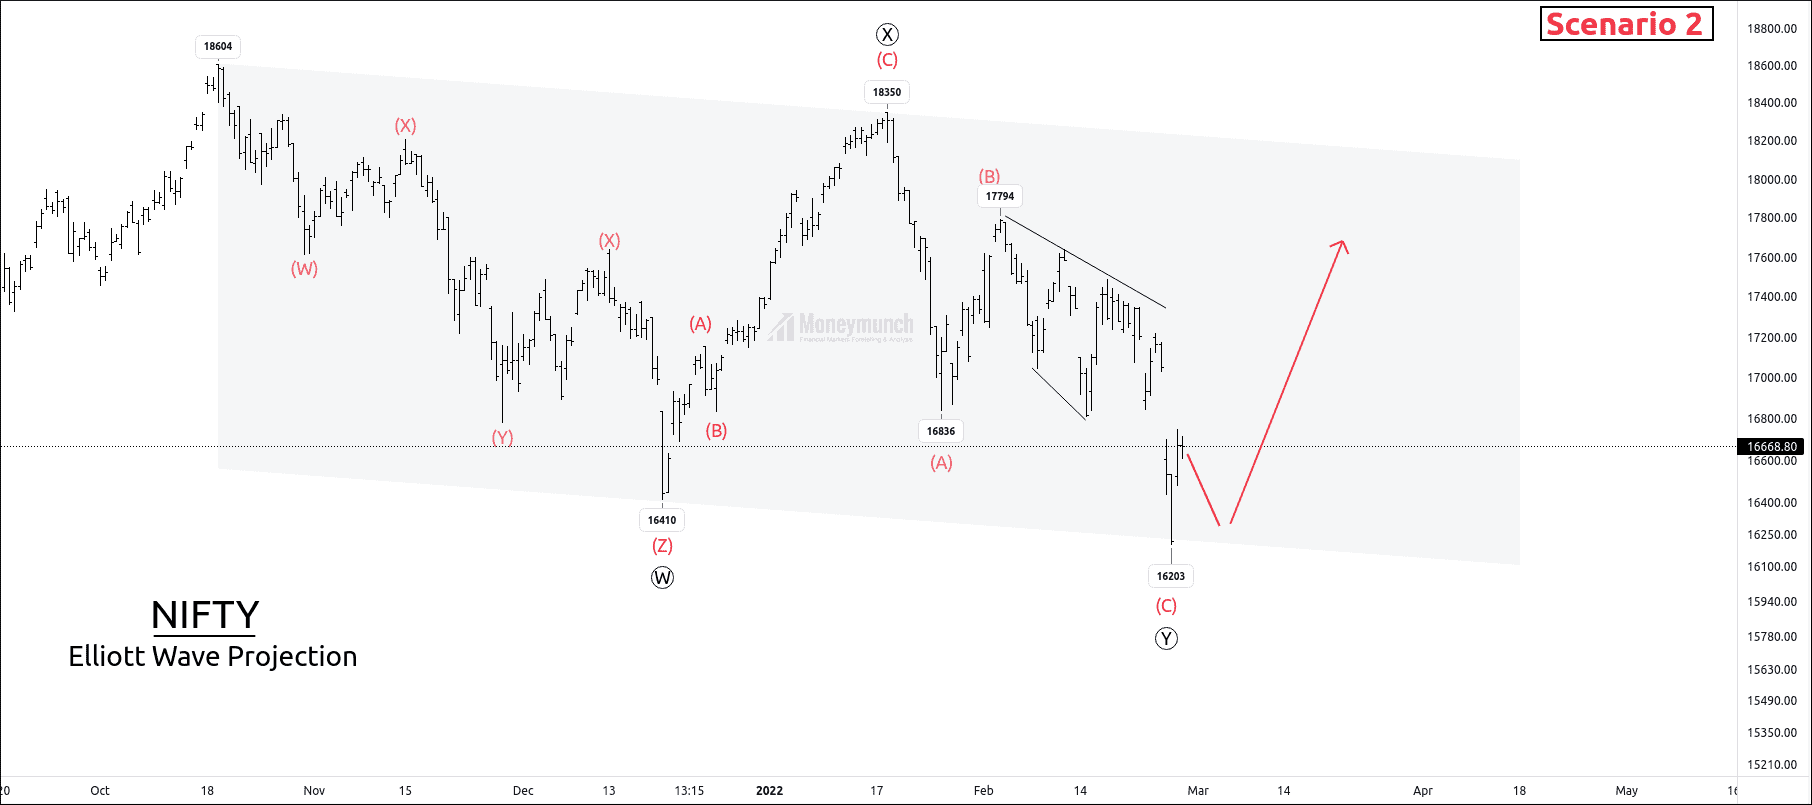
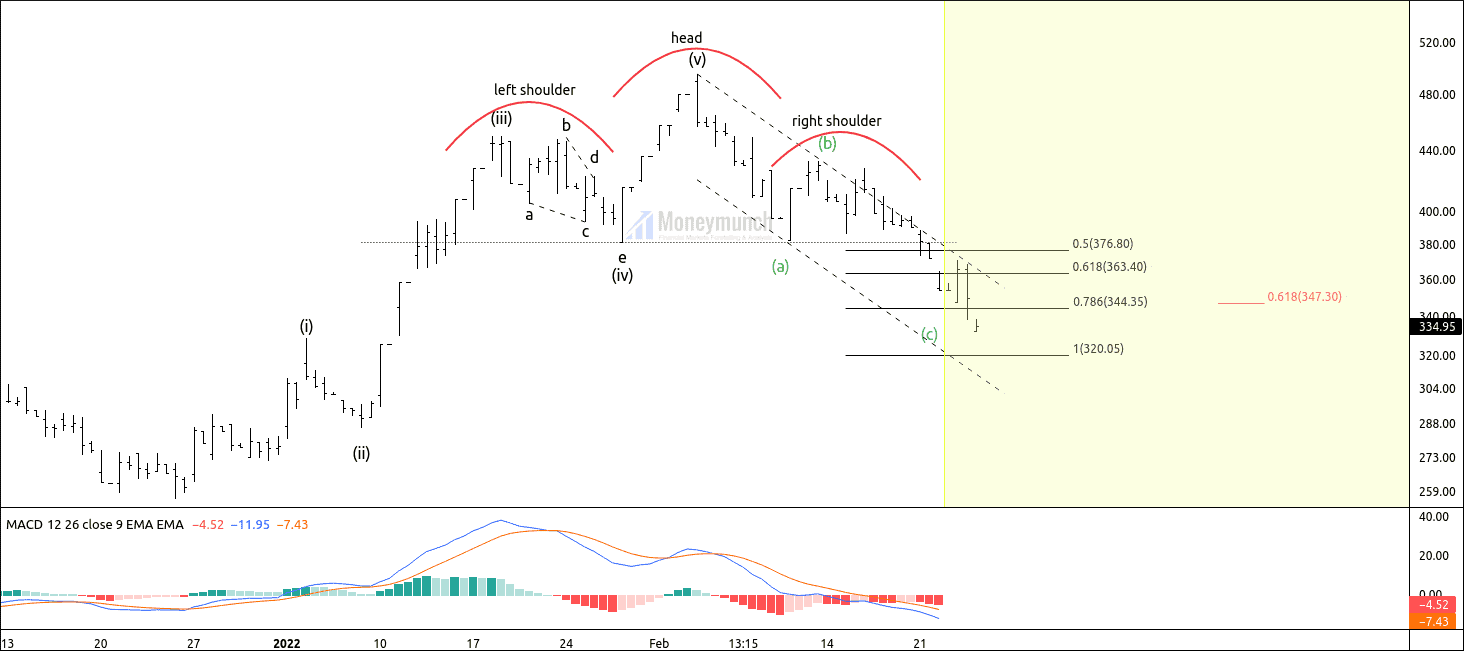
Perspective:
Price has completed the double zigzag correction by completing wave C of wave (Y).
Wave ((Y)) has already traveled 100% of wave ((W)). Price will start an impulsive cycle, which will be the sub-wave of wave ((5)).
Price has to confirm its bullish move by breaking wave B at 17794.
Bullish sentiments can derive a price for 19000 and more.
 Unlock This Article