Free Stock market / Nifty intraday tips, FREE Stock, Commodity & Forex tips

NSE MSUMI – Elliott Wave Projection

Free nse msumi chart calls

Free nse msumi chart calls

Timeframe: Daily
The NSE MSUMI has been experiencing a corrective phase for over 27 weeks, with a notable low of 45.15 before commencing a new impulsive cycle. The current trading range of NSE MSUMI is between the 50 and 20 Daily exponential moving averages.

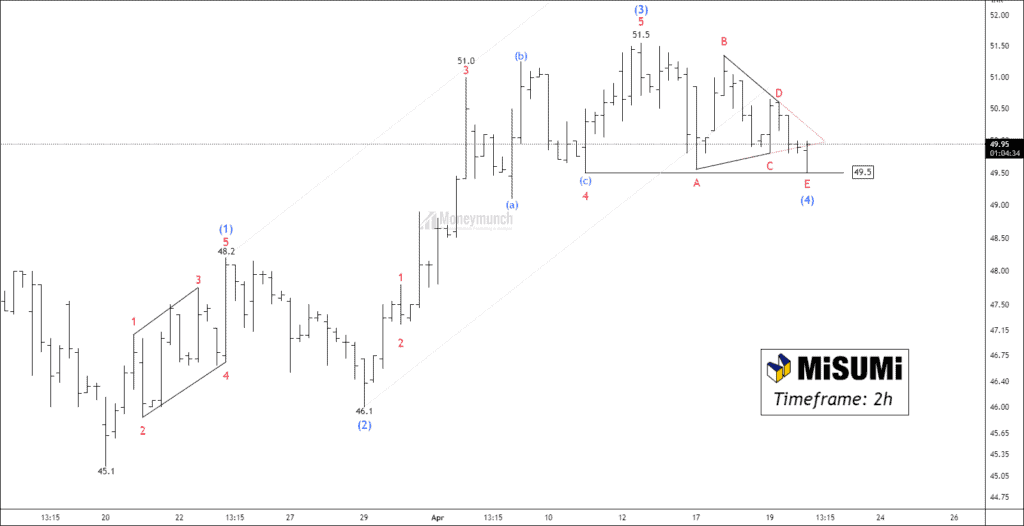
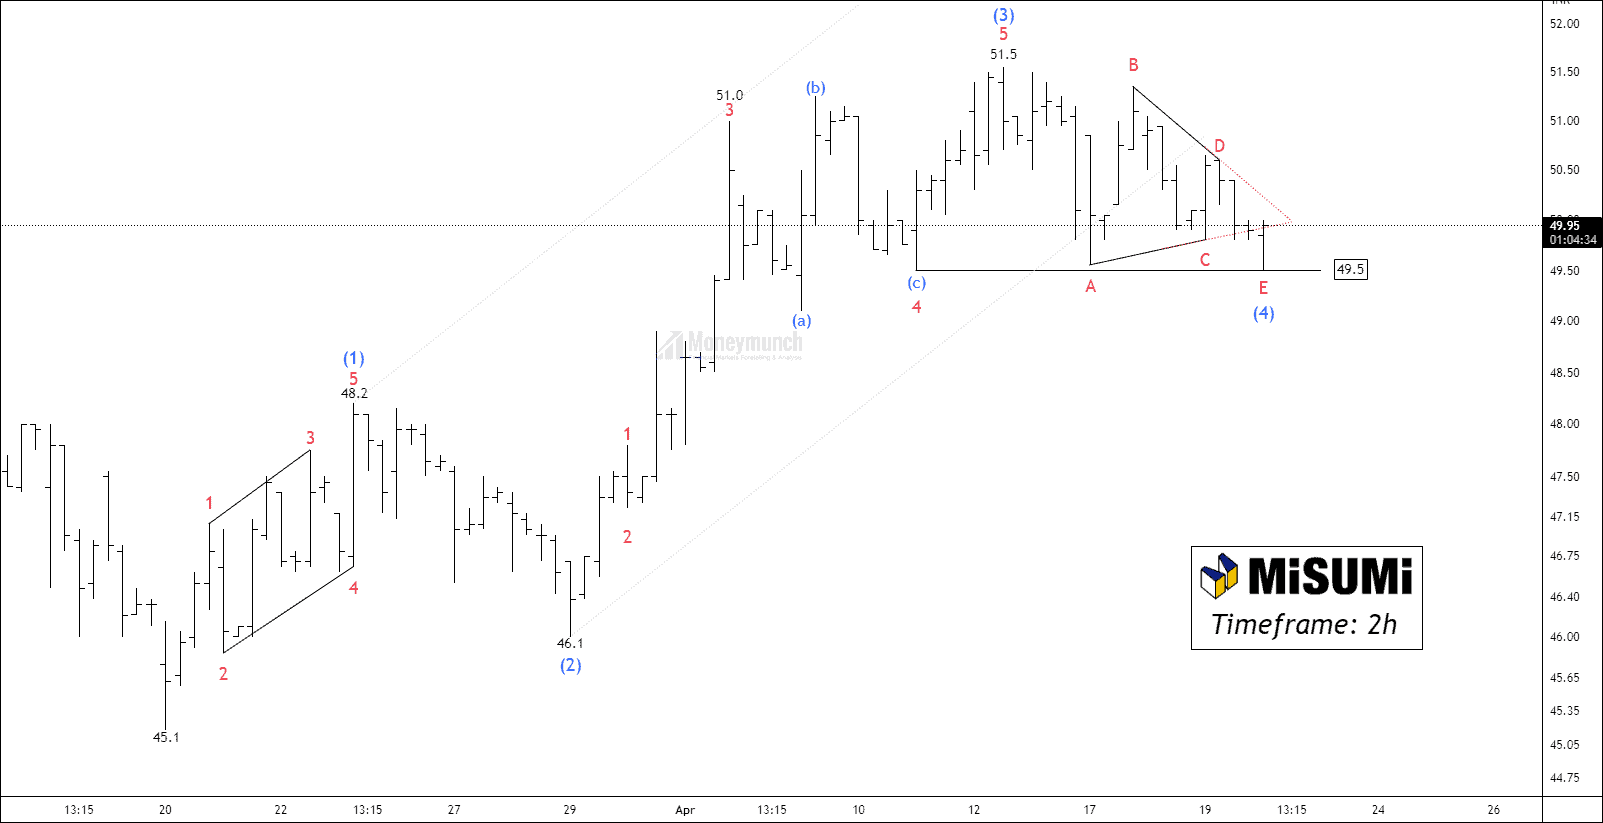
Presently, the price has completed the extension of impulsive wave 3 at 51.5 and has entered a corrective wave 4, which is taking the form of a triangle pattern. The retracement of wave 4 has hit the common 38.2% level.

If the price surpasses wave D, Traders can initiate trades for targets of 51.50 – 52.61 – 54.12+ . However, buyers must keep a close watch on 49.5 as a break below it may result in a bearish sentiment, leading to 47.05.

Get free important share market ideas on stocks & nifty tips chart setups, analysis for the upcoming session, and more by joining the below link: Stock Tips

Have you any questions/feedback about this article? Please leave your queries in the comment box for answers.

Disclaimer: The information provided on this website, including but not limited to stock, commodity, and forex trading tips, technical analysis, and research reports, is solely for educational and informational purposes. It should not be considered as financial advice or a recommendation to engage in any trading activity. Trading in stocks, commodities, and forex involves substantial risks, and you should carefully consider your financial situation and consult with a professional advisor before making any trading decisions. Moneymunch.com and its authors do not guarantee the accuracy, completeness, or reliability of the information provided, and shall not be held responsible for any losses or damages incurred as a result of using or relying on such information. Trading in the financial markets is subject to market risks, and past performance is not indicative of future results. By accessing and using this website, you acknowledge and agree to the terms of this disclaimer.
Previous ArticleNext Article
Mr.Guru(s) is a team of stock market certified technical and research analysts with over 20 years of experience. They are regular guests on popular online channels and contribute articles to several financial publications. Their insights and advice are respected by investors worldwide. With their collective knowledge and expertise, they have a proven track record of successfully predicting market movements and identifying profitable opportunities.

Join Today (Free): Stock & Nifty Tips

7 Comments

  1. 👏👏👏 Great analysis and insights! Your explanation of the hourly chart setup for Msumi is very clear and easy to understand.

  2. Sir
    Elliott’s wave count on stocks from time to time.is well appreciated. I have a query about the time frame. You usually make a study in 2 hr. time frame. Is any significant about this 2 hr.
    Many people do it in 15 minutes.

    I just want to know the ideal time frame for the wave count.

    Is it possible to give an analysis on candlesticks also side by side?

Write a Comment

Comment Policy: We love comments and appreciate the time that readers spend to share ideas and give feedback. However, all comments are manually moderated and those deemed to be spam or solely promotional will be deleted. Your email address will not be published. Required fields are marked *