Timeframe: Daily
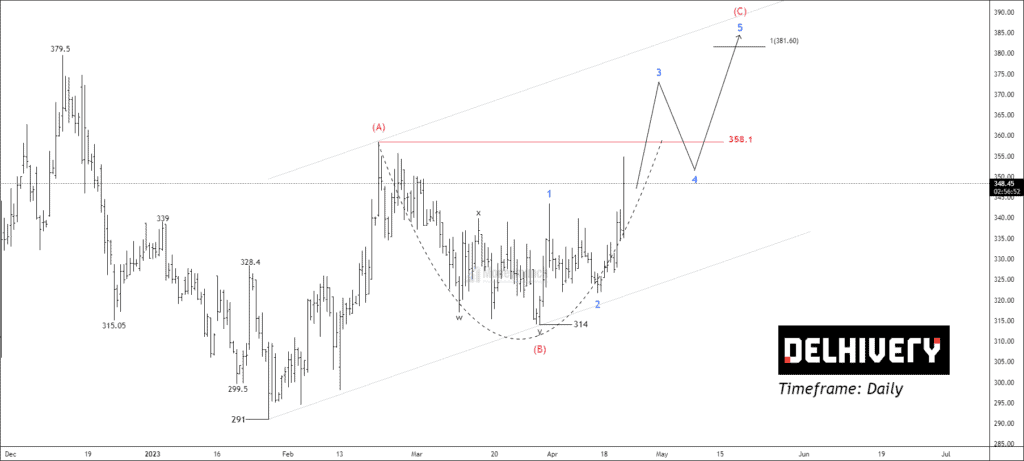
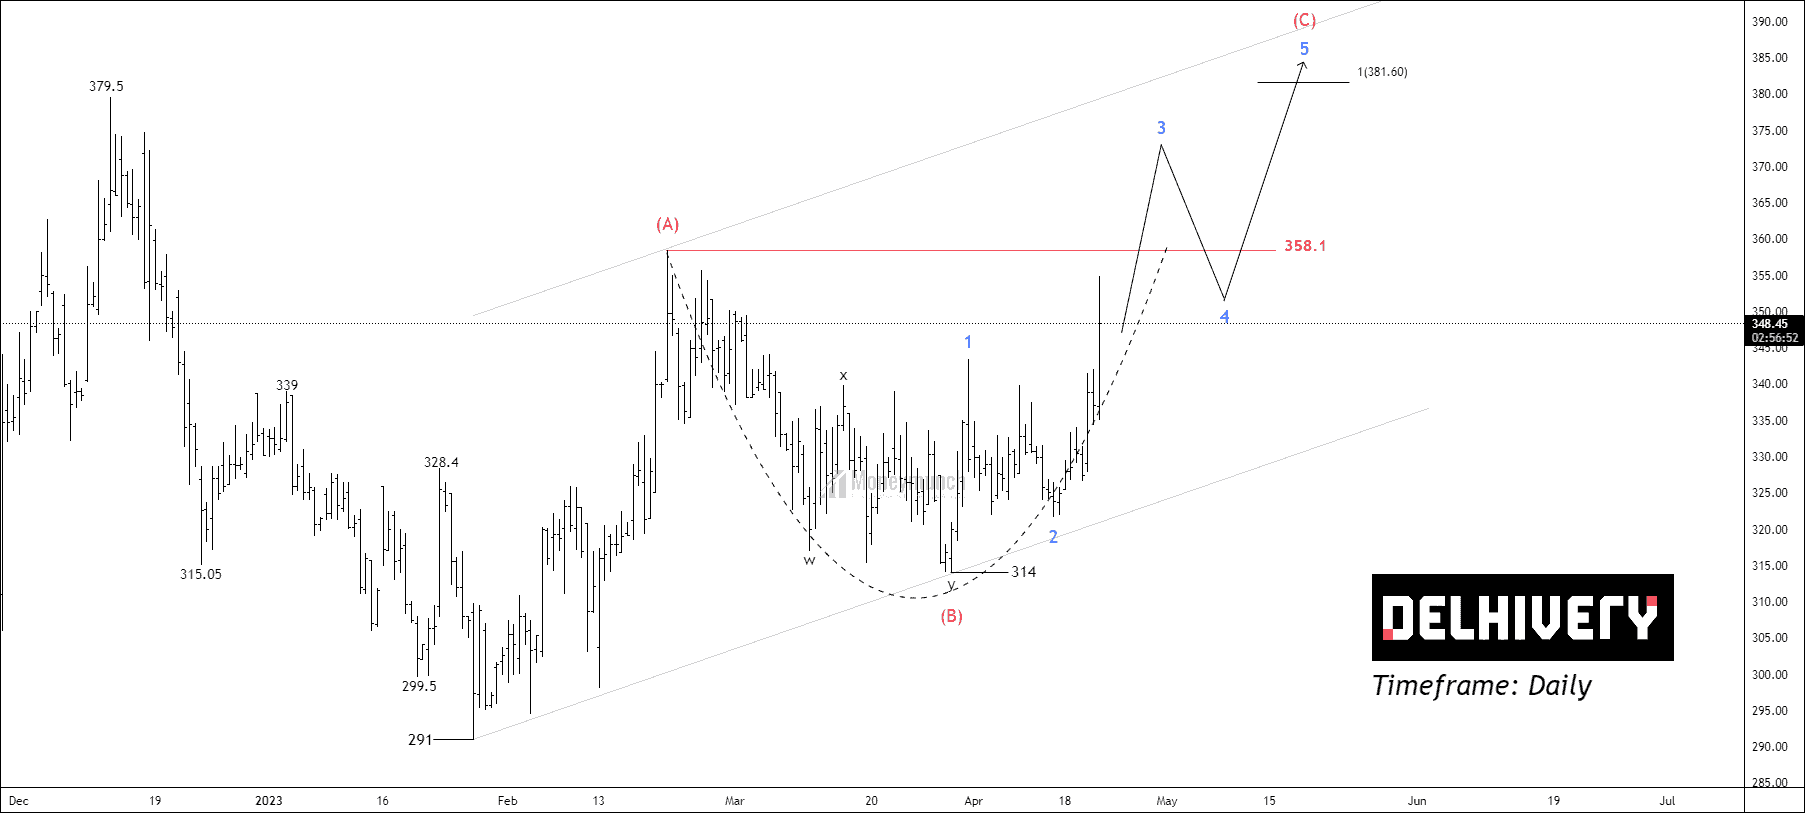
NSE DELHIVERY has formed a technical chart pattern known as the “cup and handle” on the daily timeframe. The pattern is characterized by a “U” shape with a handle on the right-hand side. The neckline of this pattern is located at 358.1, which serves as a key level for traders to watch.
The price of the stock had previously made a new low of 291 and subsequently began forming a new cycle. This cycle appears to be an impulsive five-wave pattern, with traders advised to only count the waves after an extensive wave 3. The price has completed wave (B) and is now forming wave (C).
Based on this analysis, traders can expect wave (C) to reach wave equality, where wave (A) is equal to wave (C). If the price manages to sustain above wave (A), traders can consider trading for the following target levels: 367 – 380 – 397+.
Get free important share market ideas on stocks & nifty tips chart setups, analysis for the upcoming session, and more by joining the below link: Stock Tips
Have you any questions/feedback about this article? Please leave your queries in the comment box for answers.
Your insight and analysis are impressive and demonstrate a keen understanding of the market. Keep up the excellent work!
it clearly showing cup and handle pattern
Thank you for sharing this chart. i was looking for this stock.