
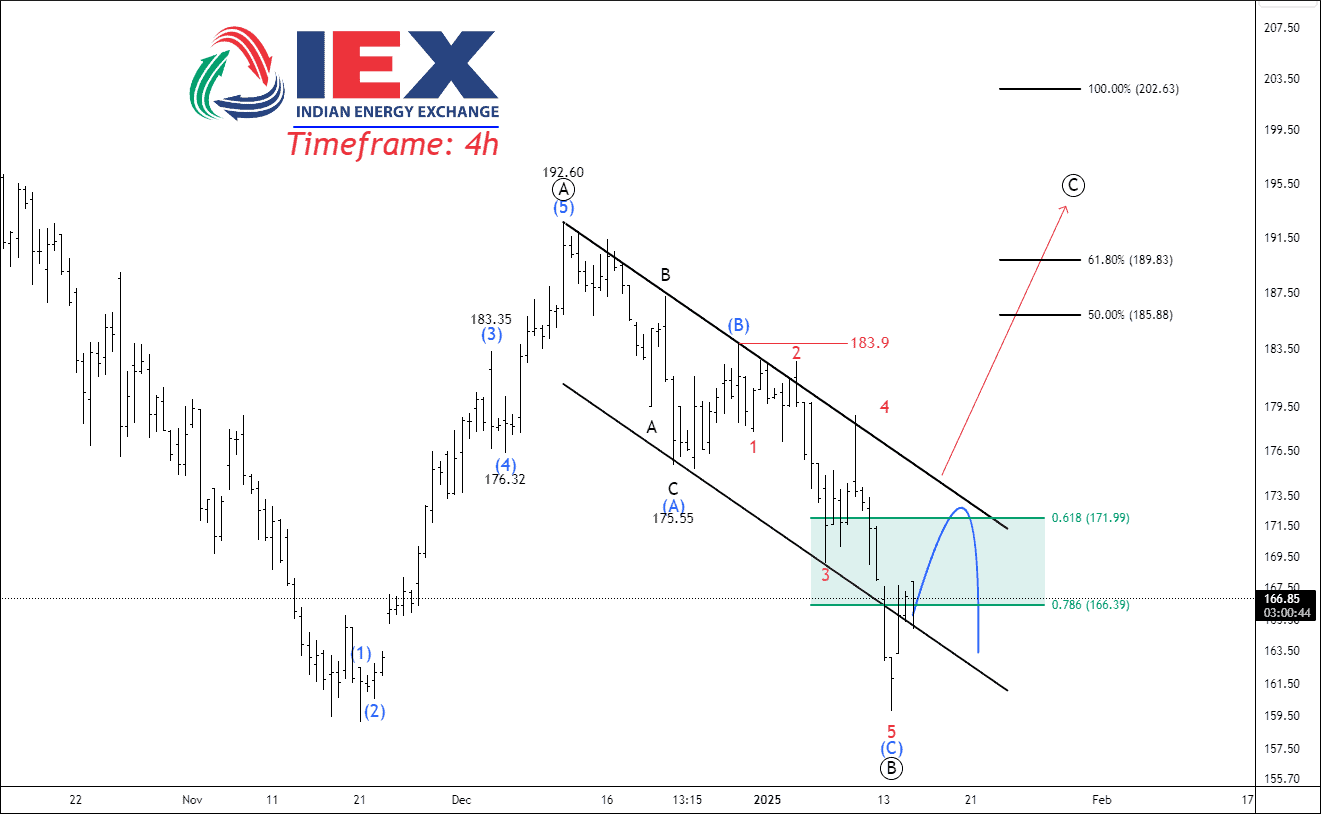
Timeframe: 4h
In our previous analysis, NSE IEX followed the anticipated movement, with the price encountering a supply zone at the upper band of the parallel channel. Wave ((B)) completed a 100% Fibonacci retracement of wave ((A)), and sub-wave 4 overlapped sub-wave 1. A revised wave count analysis is now required for updated insights.
Visit here: NSE IEX – Elliott Wave Projection
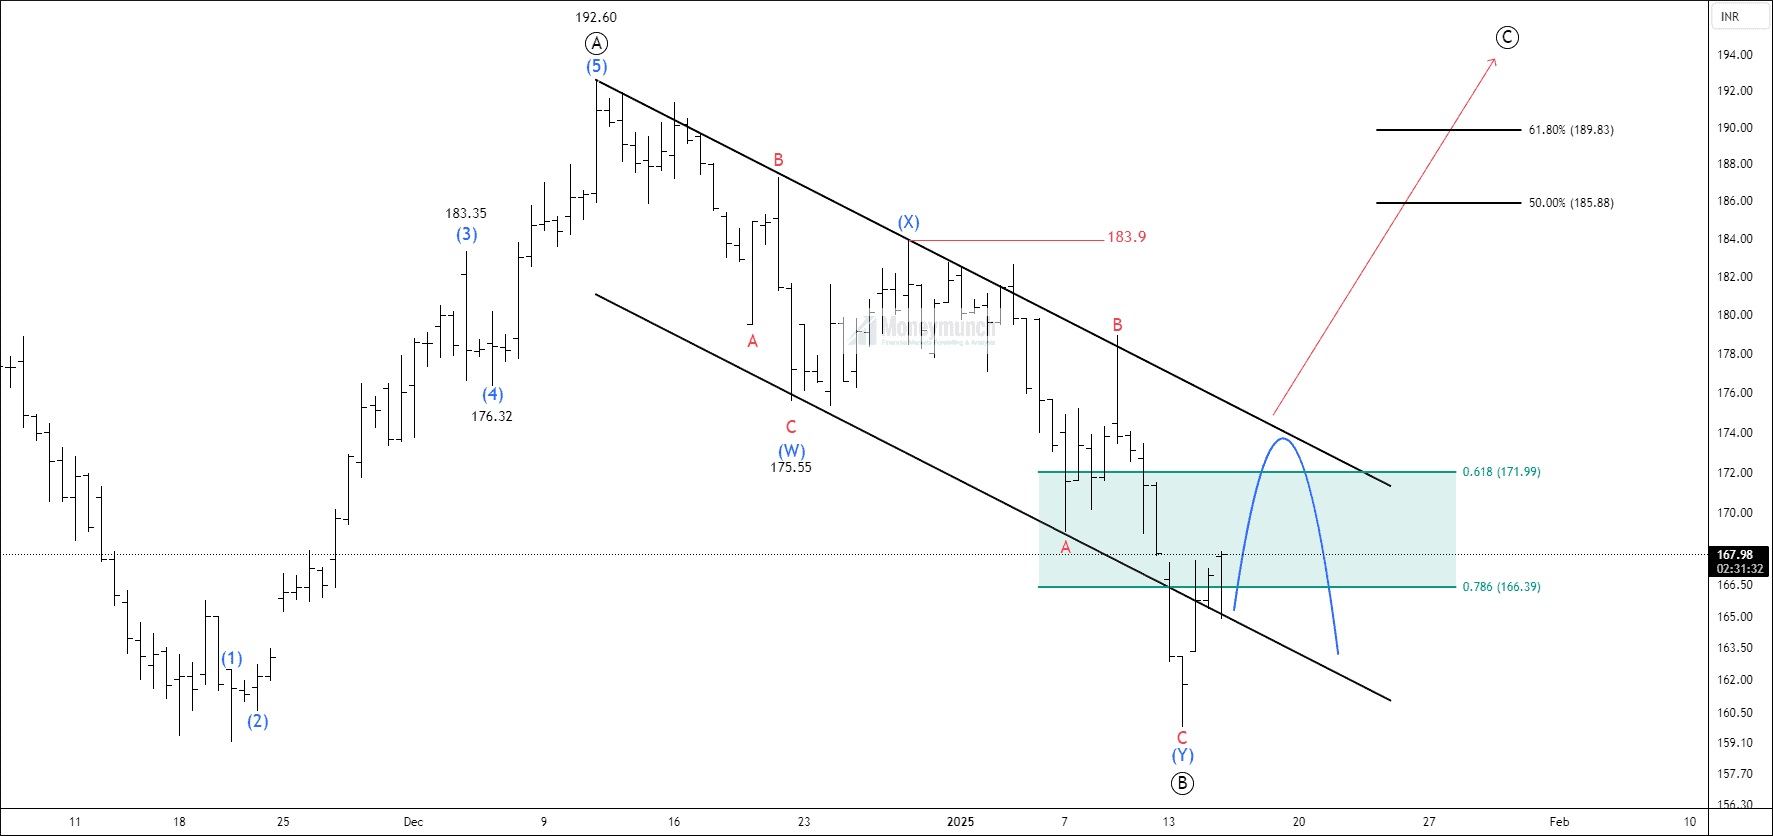
The updated wave count suggests that the labels align more accurately with a double zigzag pattern, either in wave ((B)) or wave ((2)). If the price fails to break out of the corrective channel, it is likely to continue finding support and resistance within the upper and lower bands. In the bullish scenario, the resistance levels that can be considered as potential targets are 178 – 183 – 190+.
Get free important share market ideas on stocks & nifty tips chart setups, analysis for the upcoming session, and more by joining the below link: Stock Tips
Have you any questions/feedback about this article? Please leave your queries in the comment box for answers.
Great chart, love the clarity
Ok sir thank for your information on iex stocks
Love this setup, yes, It looks strong!
This chart is next-level, well done!