
Timeframe: 4h
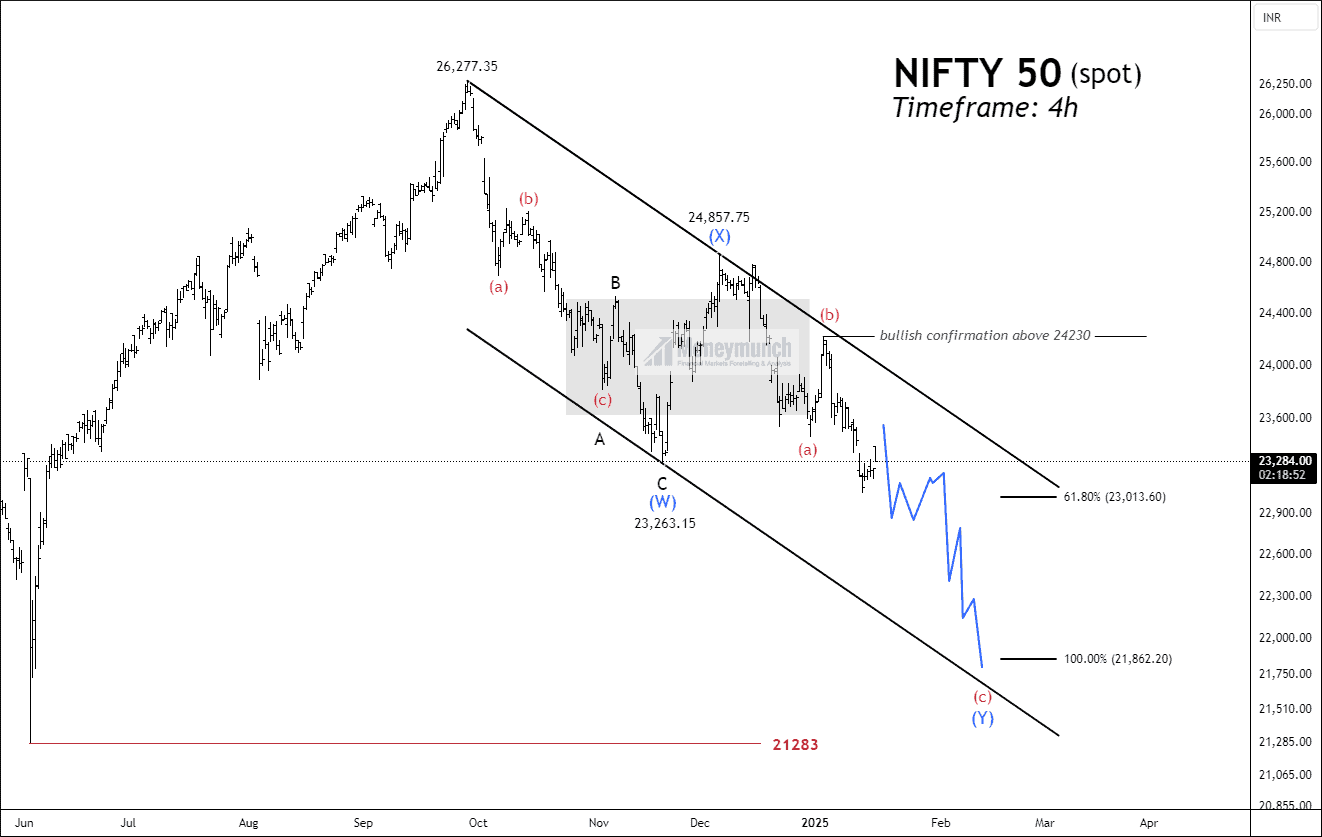
After reaching a peak of 26,277, the NSE NIFTY has begun to decline within a downward parallel channel. The Elliott wave structure can be identified as (W) – (X) – (Y), where wave (X) peaked at 24,867, followed by a downward movement for the final wave (Y). The price has fallen below the 20, 50, 100, and 200 EMA levels, with an ATR of 166.36.
The correction has several key levels to consider:
- At 100% retracement of wave (W) at 21,962
- At 100% retracement of wave (a) at 22,827
- At the lower boundary of the corrective channel
Bearish sentiment is currently stronger than buyer demand. A reversal may occur either after a breakout from the parallel channel or at the lower boundary of the channel. This is possible as long as the swing low of 21,283 remains intact.
We will update further information for premium subscribers soon.
Get free important share market ideas on stocks & nifty tips chart setups, analysis for the upcoming session, and more by joining the below link: Stock Tips
Have you any questions/feedback about this article? Please leave your queries in the comment box for answers.
I love seeing this upward movement! It’s encouraging, especially after the recent volatility. Hoping for more positive trends ahead!
Looks like the market is responding well to recent news and economic indicators. I’m curious if it can maintain this momentum in the coming weeks
This chart looks promising! Excited for what’s next!
Hey! I’ve been a subscriber for a while now, and I really appreciate all the great content you’ve been sharing. I’m looking to upgrade to your premium subscription. What are the benefits, and how can I get started? Thanks!
Is there a paid plan available for stock market and commodity insights?