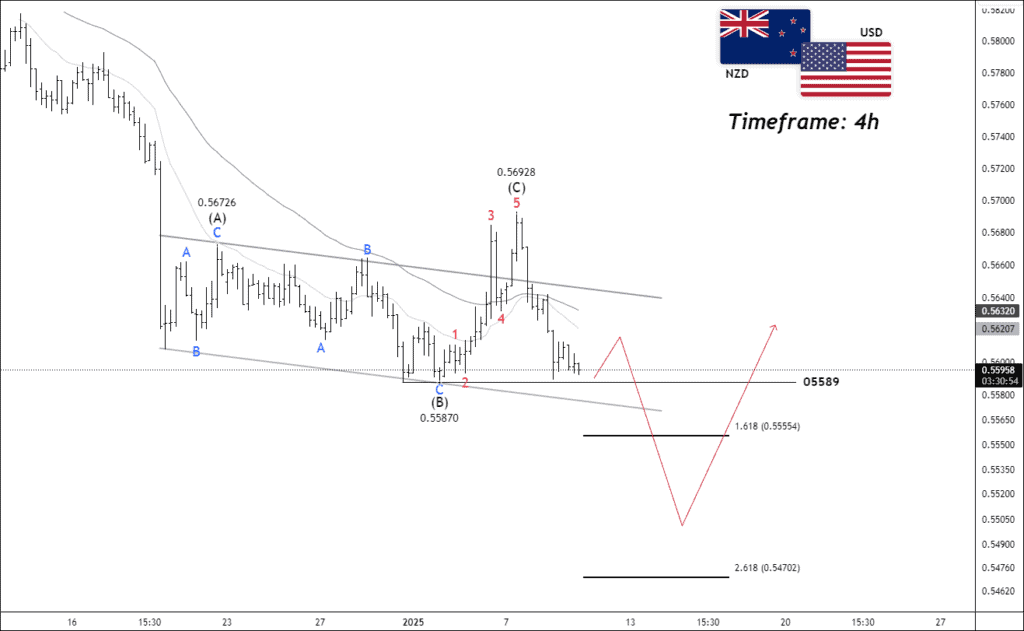
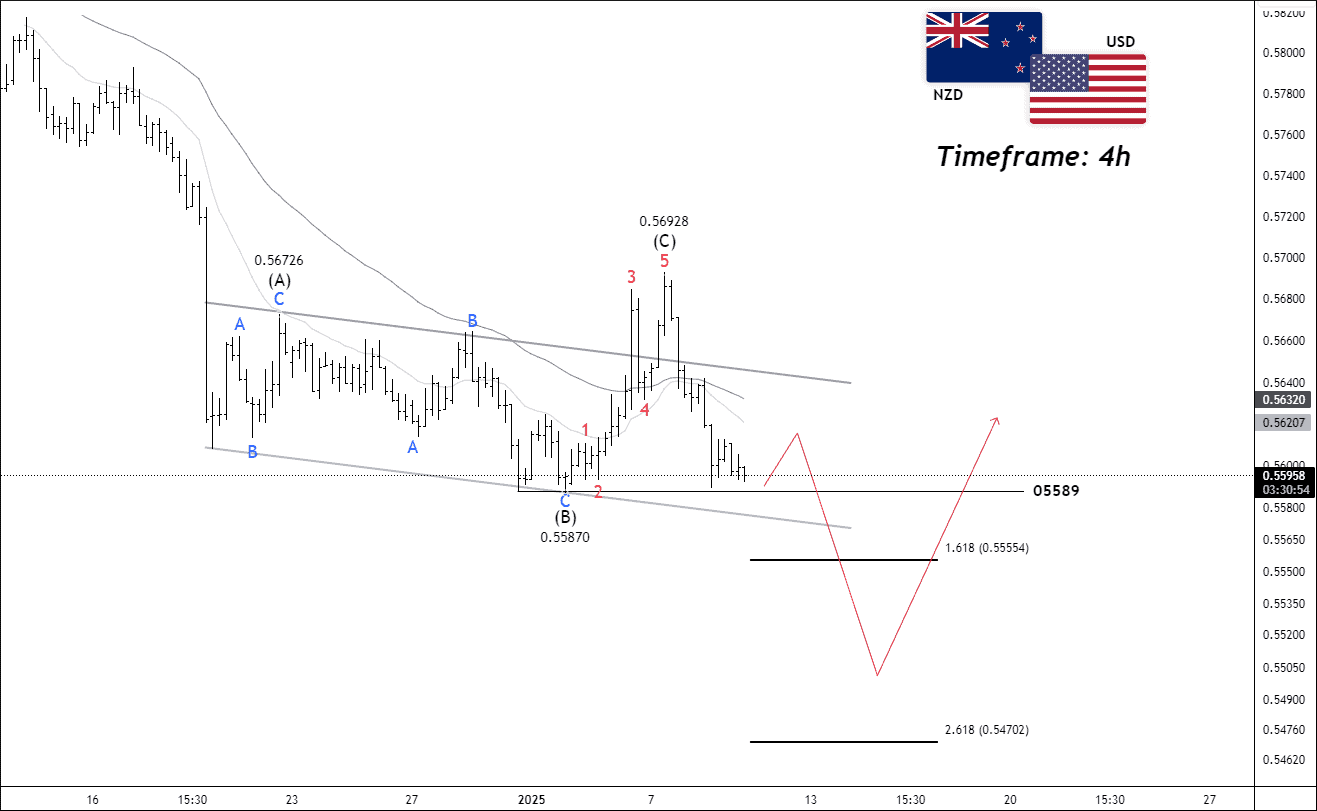
Timeframe: 4h
NZD/USD has broken below the 50/20 EMA on the 4-hour timeframe chart. The price experienced a sharp decline, followed by a corrective pause that appears to form an expanded flat correction. Wave (C) completed at 0.5692. The ATR has decreased to 0.00189, while the ADX has dropped to 22.87. The impulsive move is expected to occur downward. If the price breaks below wave B at 0.55870, it may reverse from the following targeted Fibonacci levels: 0.5555 (1.618) and 0.5470 (2.618).
 Unlock This Article
We will update further information soon.
Get free forex & currency ideas, chart setups, and analysis for the upcoming session: Forex Signals →
Want to get premium trading alerts on GBPUSD, EURUSD, USDINR, XAUUSD, etc., and unlimited access to Moneymunch? Join today and start potentially multiplying your net worth: Premium Forex Signals
Premium features: daily updates, full access to the Moneymunch #1 Rank List, Research Reports, Premium screens, and much more. You΄ll quickly identify which commodities to buy, which to sell, and target today΄s hottest industries.
Have you any questions/feedback about this article? Please leave your queries in the comment box for answers.
Killer chart, this one shines!
Good pick
Love the details on this one!
Good observation, Thanks for sharing!