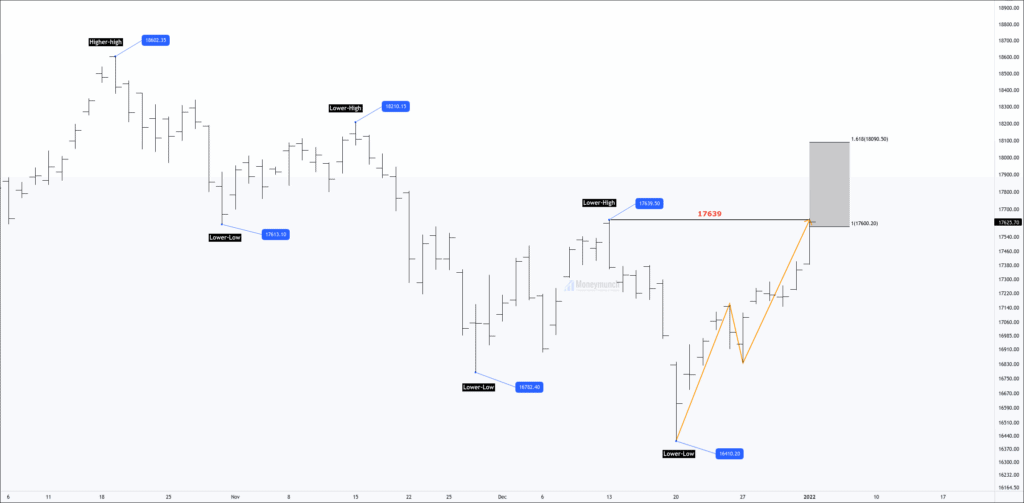
Daily Chart
Price Action perspective:
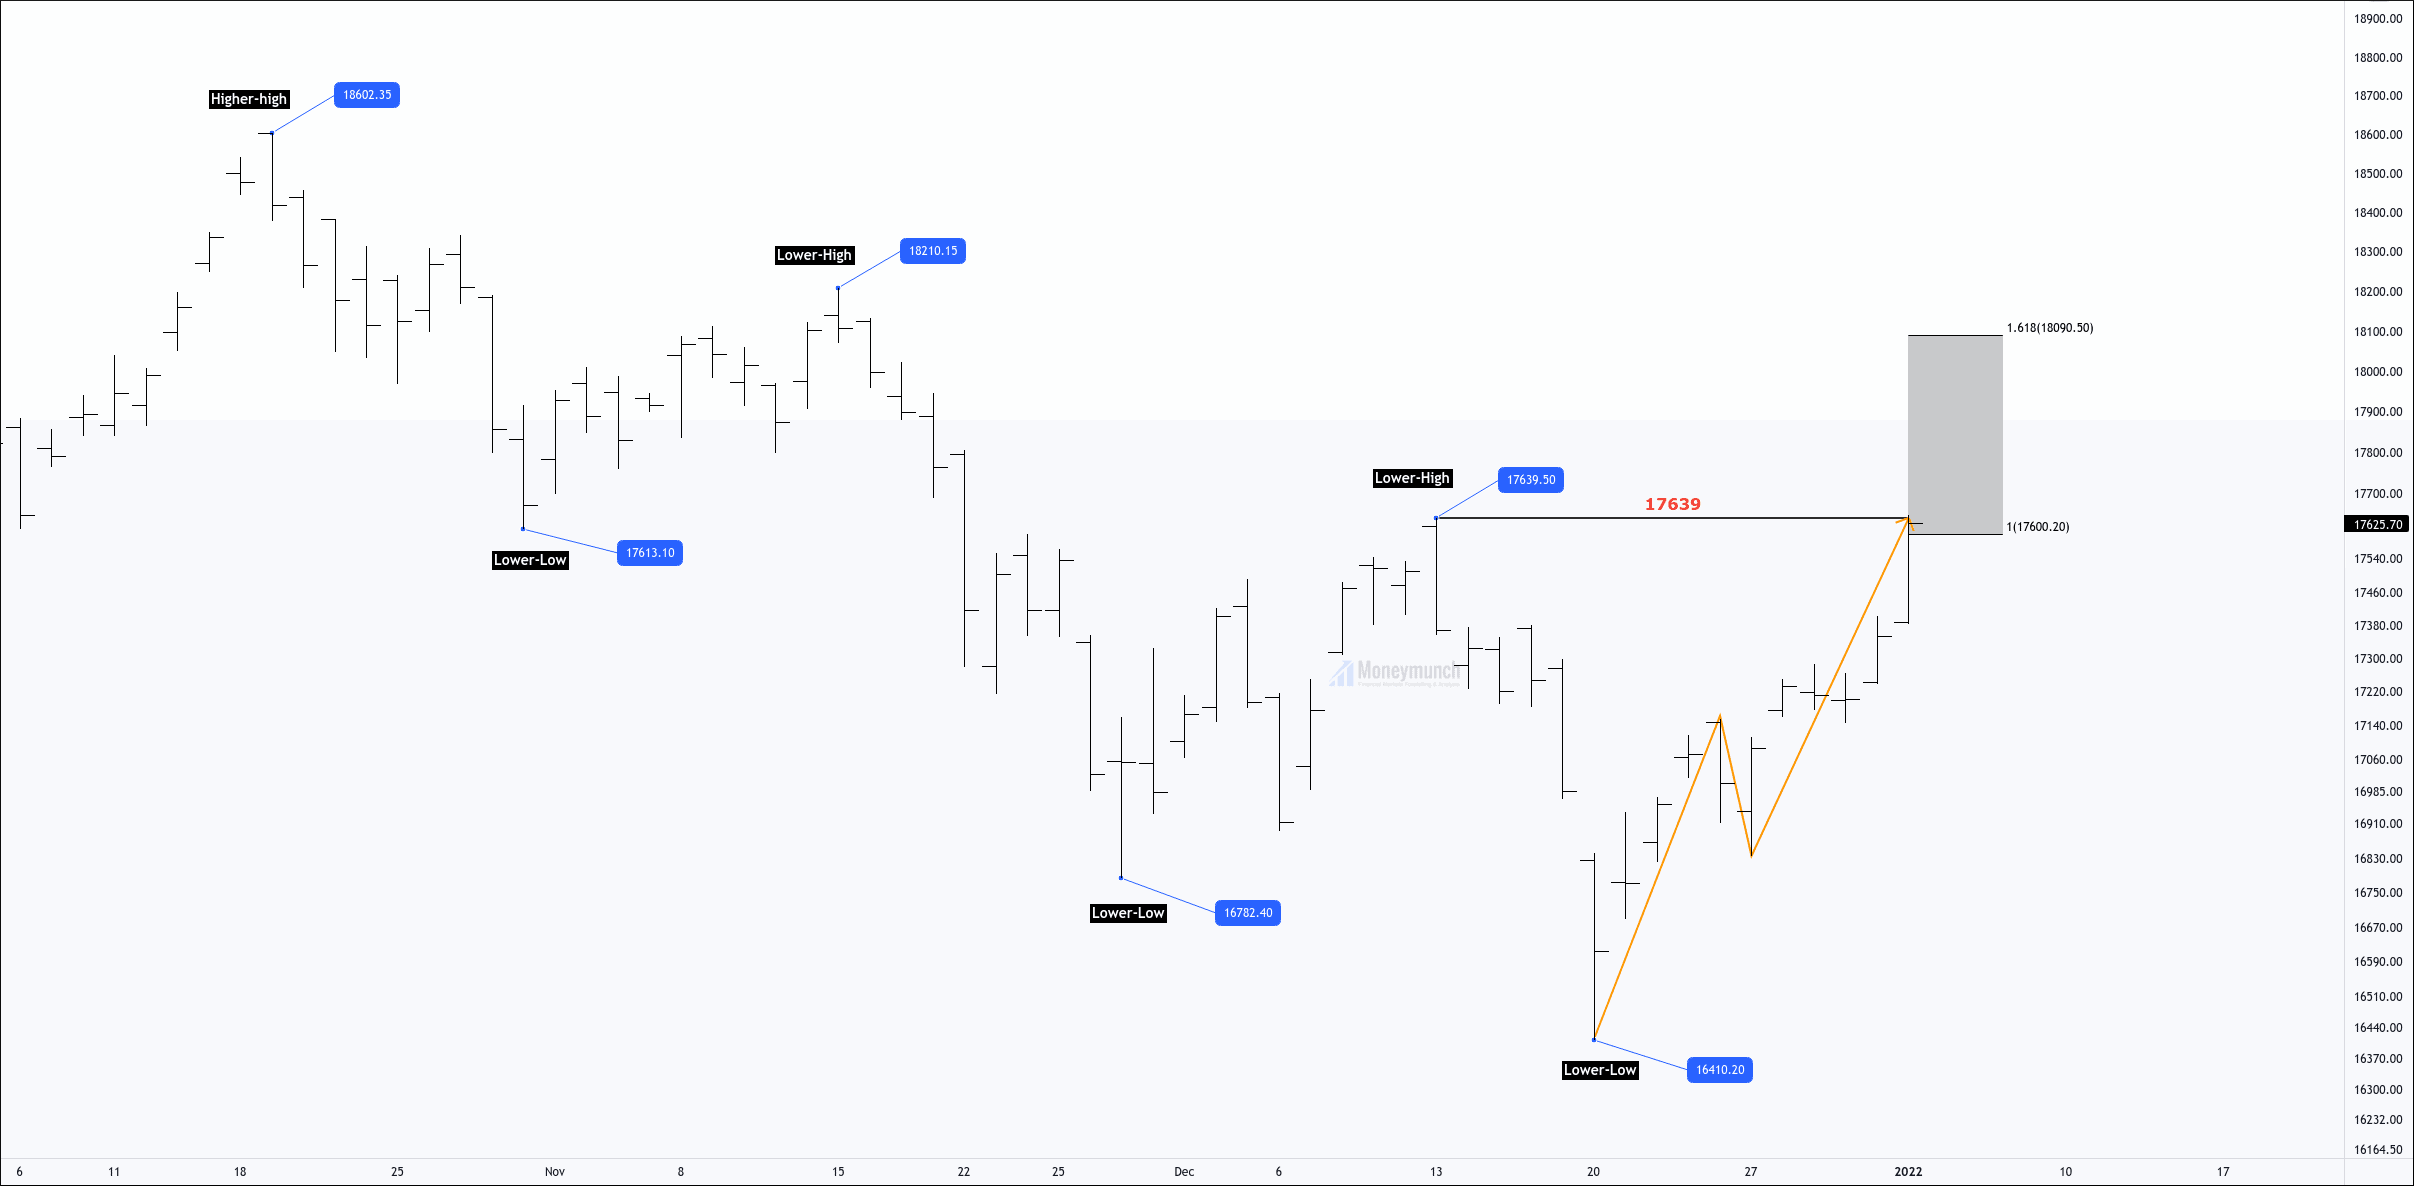
After the accomplishment of the lower-low, nifty surged and reached near the previous lower-high point at 17639.
As mentioned in down theory, An upward trend is a series of successively higher highs and higher lows.
Price is weak below 17639, which is a previous lower high.
If nifty creates a swing failure, supply will exceed the demand.
Daily Chart:
Elliott Wave Perspective:
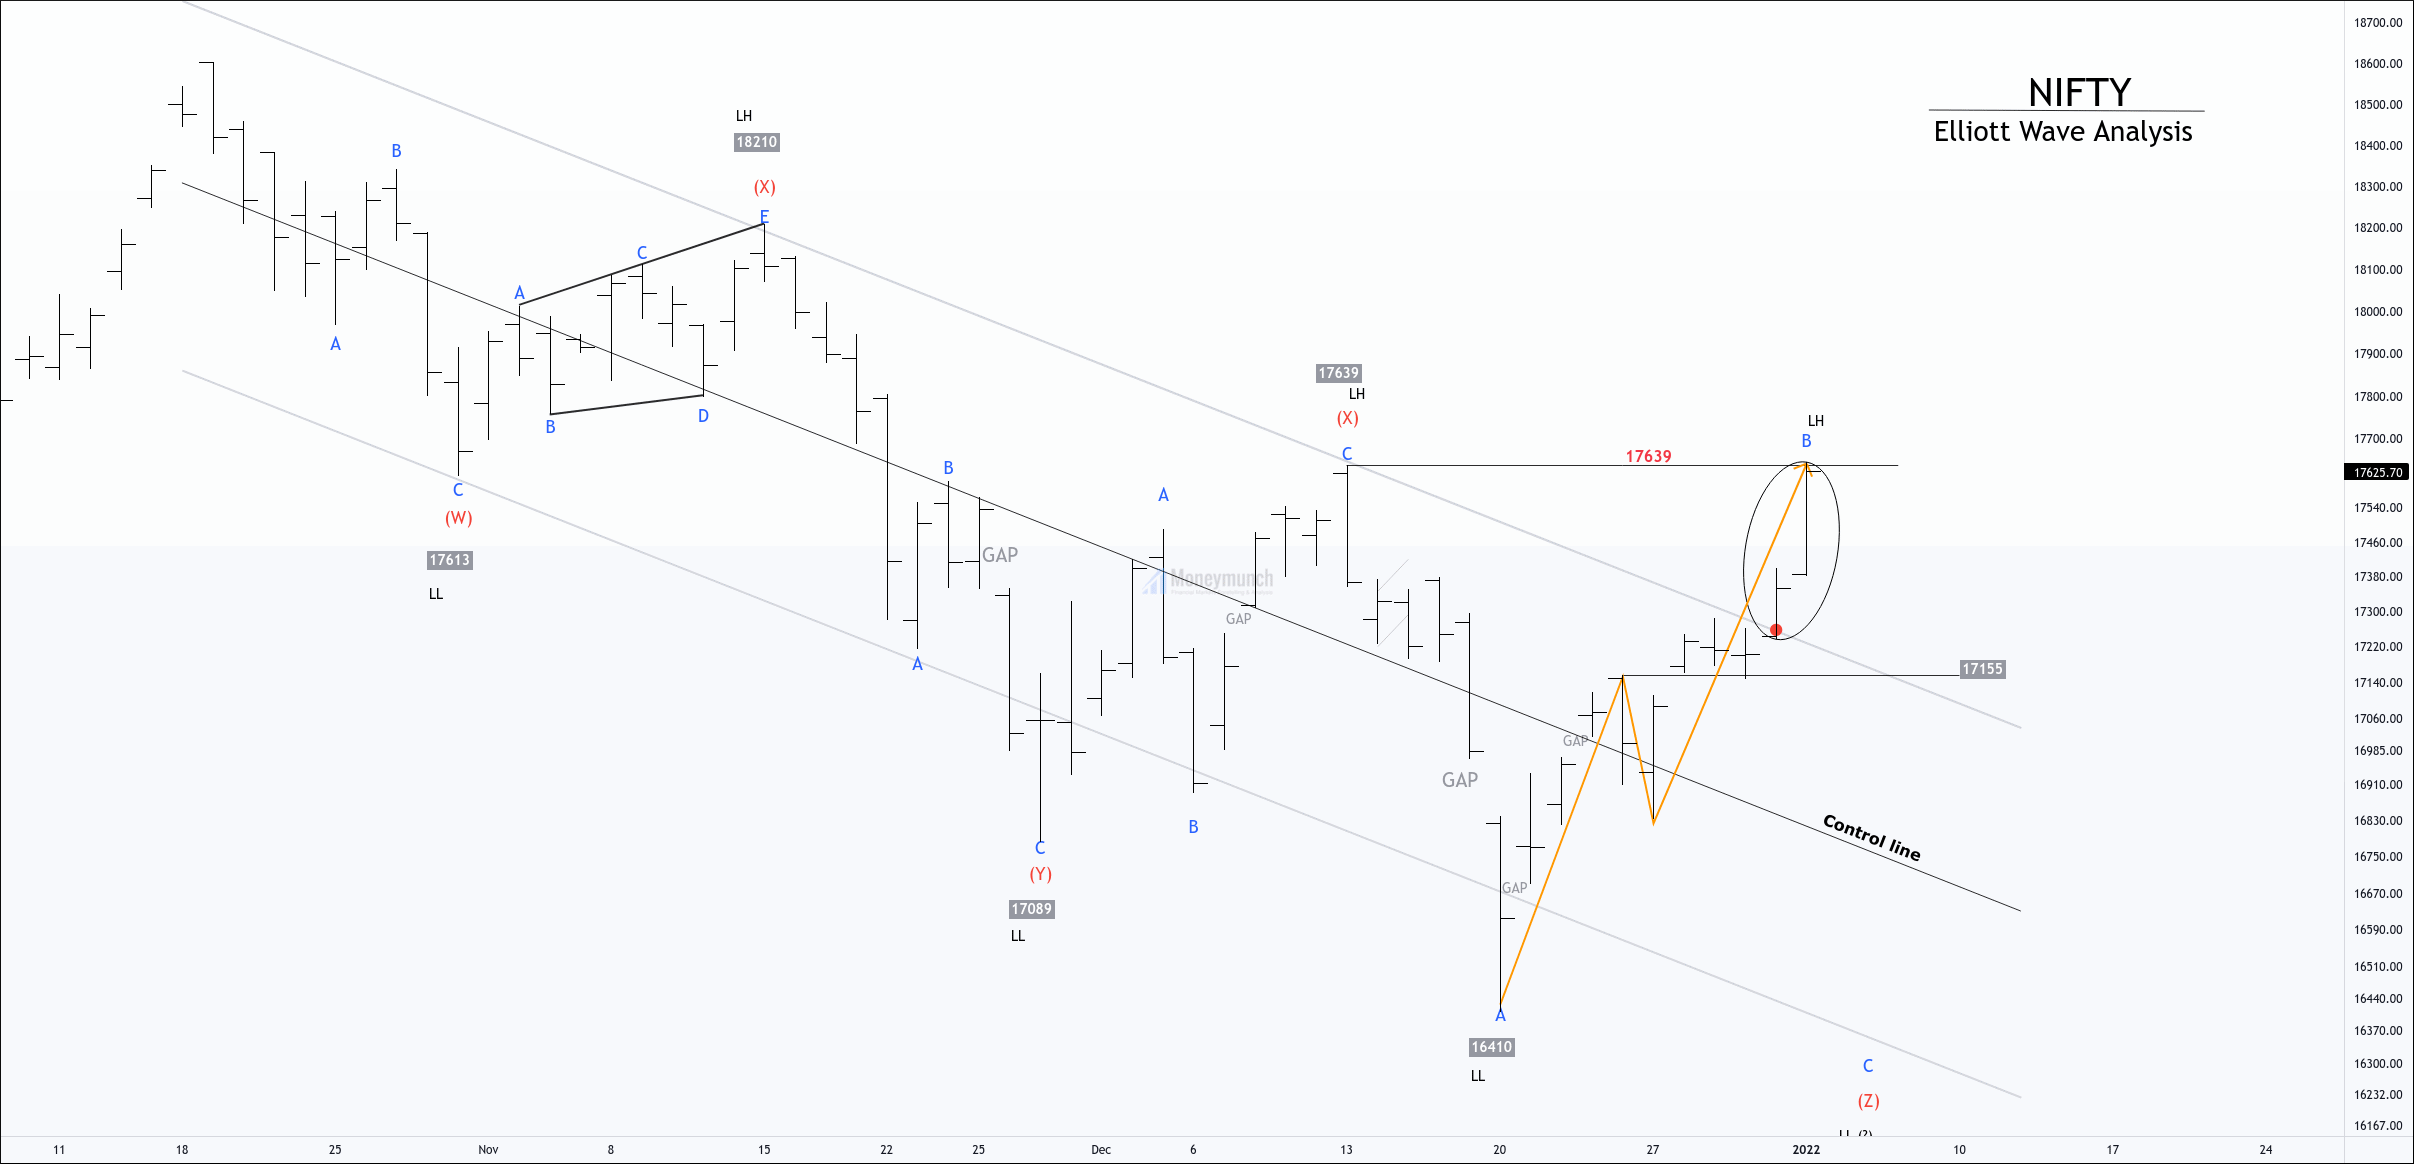
Nifty has completed the corrective wave A of triple zigzag (Z)
If the price gives a consecutive close above (X), it suggests that corrective structure has occurred and an impulsive wave started.
However, the price has given three moves after wave A.
Sub-wave a traveled 100% of wave B.
The price is weak below 17639 and strong above 17650.
In my previous idea, I have mentioned the price can be out of the channel. Sellers can enter after a rejection of the candle on a higher timeframe.
Safe traders can enter when the price enters into the downtrend channel.
Today’s close will initiate positional views.To become a subscriber, subscribe to our free newsletter services. Our service is free for all.
Get free important share market ideas on stocks & nifty tips chart setups, analysis for the upcoming session, and more by joining the below link: Stock Tips
Have you any questions/feedback about this article? Please leave your queries in the comment box for answers.