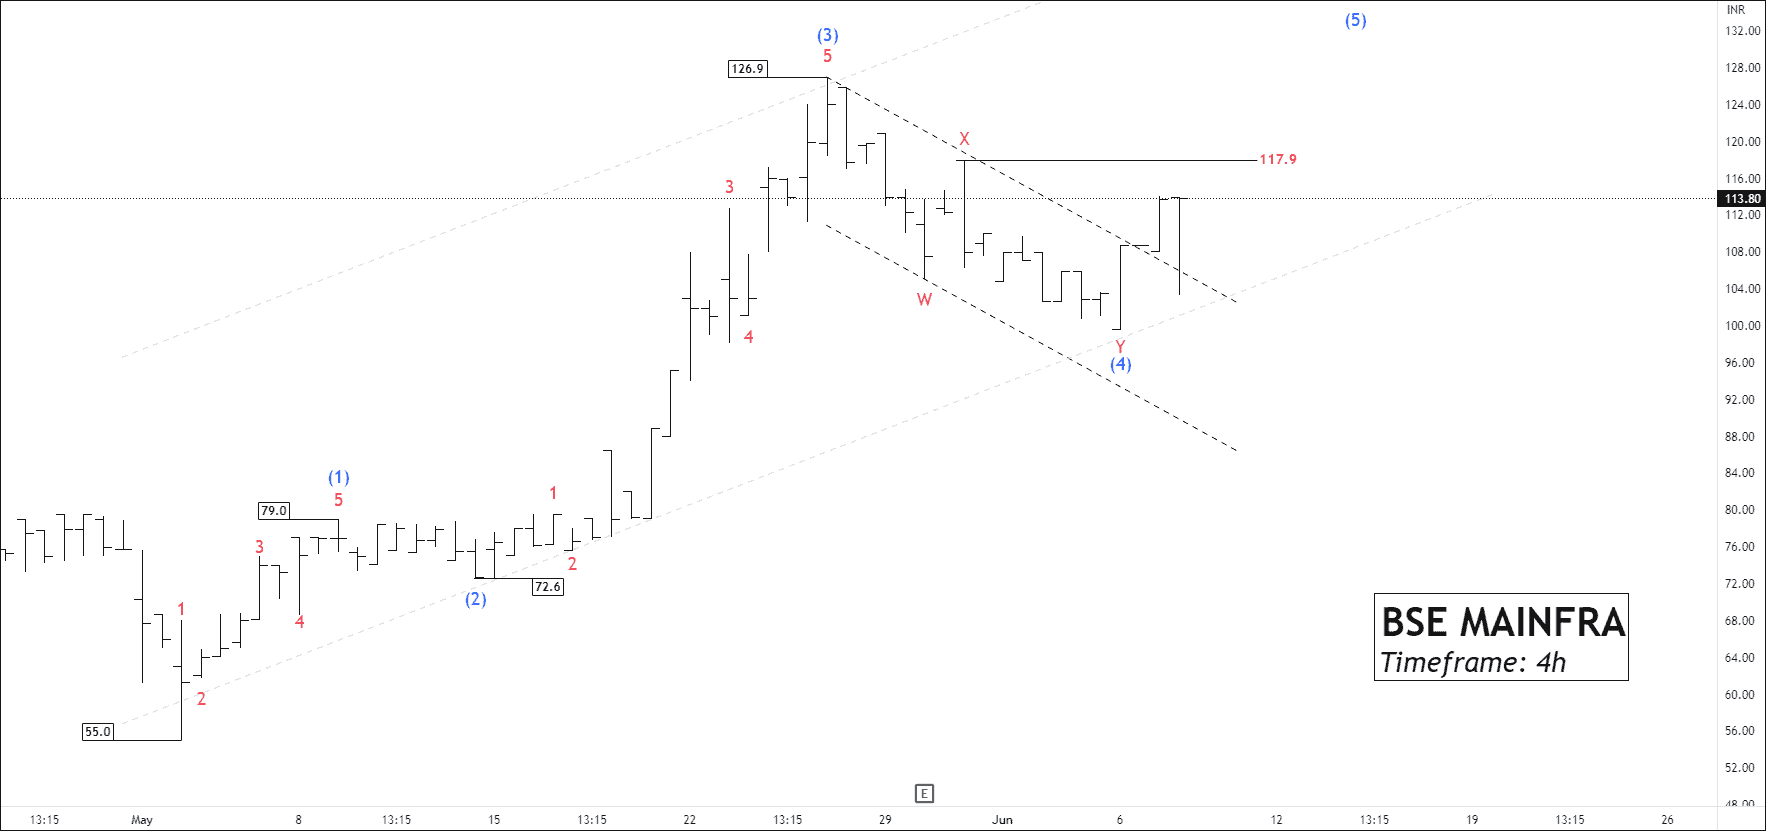
BSE MAINFRA – Trading Insights & Update
Have you executed trades using wave analysis on BSE MAINFRA?
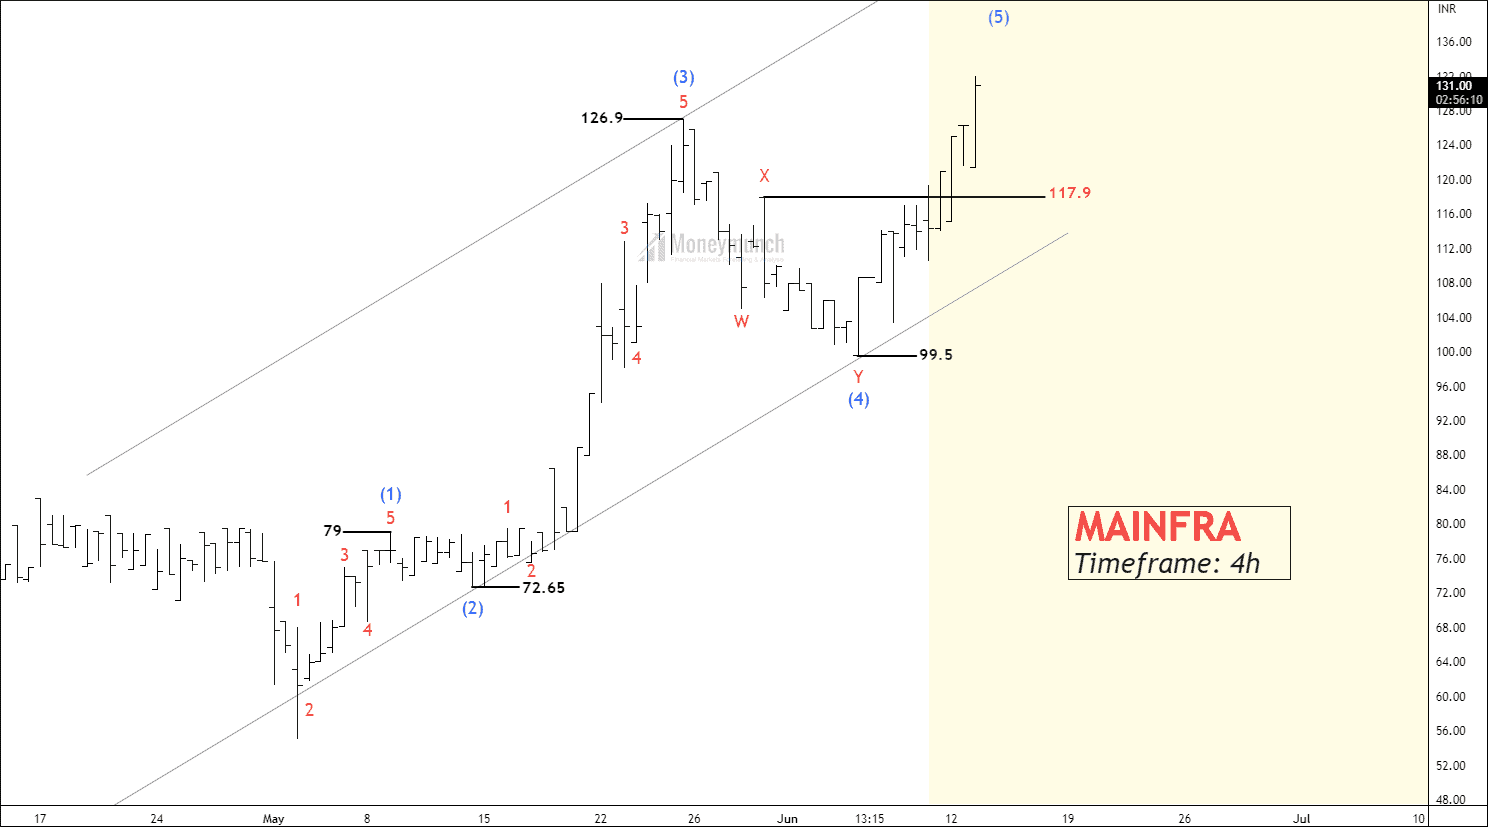
Visit here: BSE MAINFRA – Unfolding Impulse Wave 5
 BEFORE
We had written clearly, “If the price breaks out above wave X at 117.9, traders may consider buying the stock with the following target levels: 126.9 – 139.2 – 148.3.”
 AFTER
AFTER
NSE INFOSYS – Is This The Last Dip Before The Bull Charge?
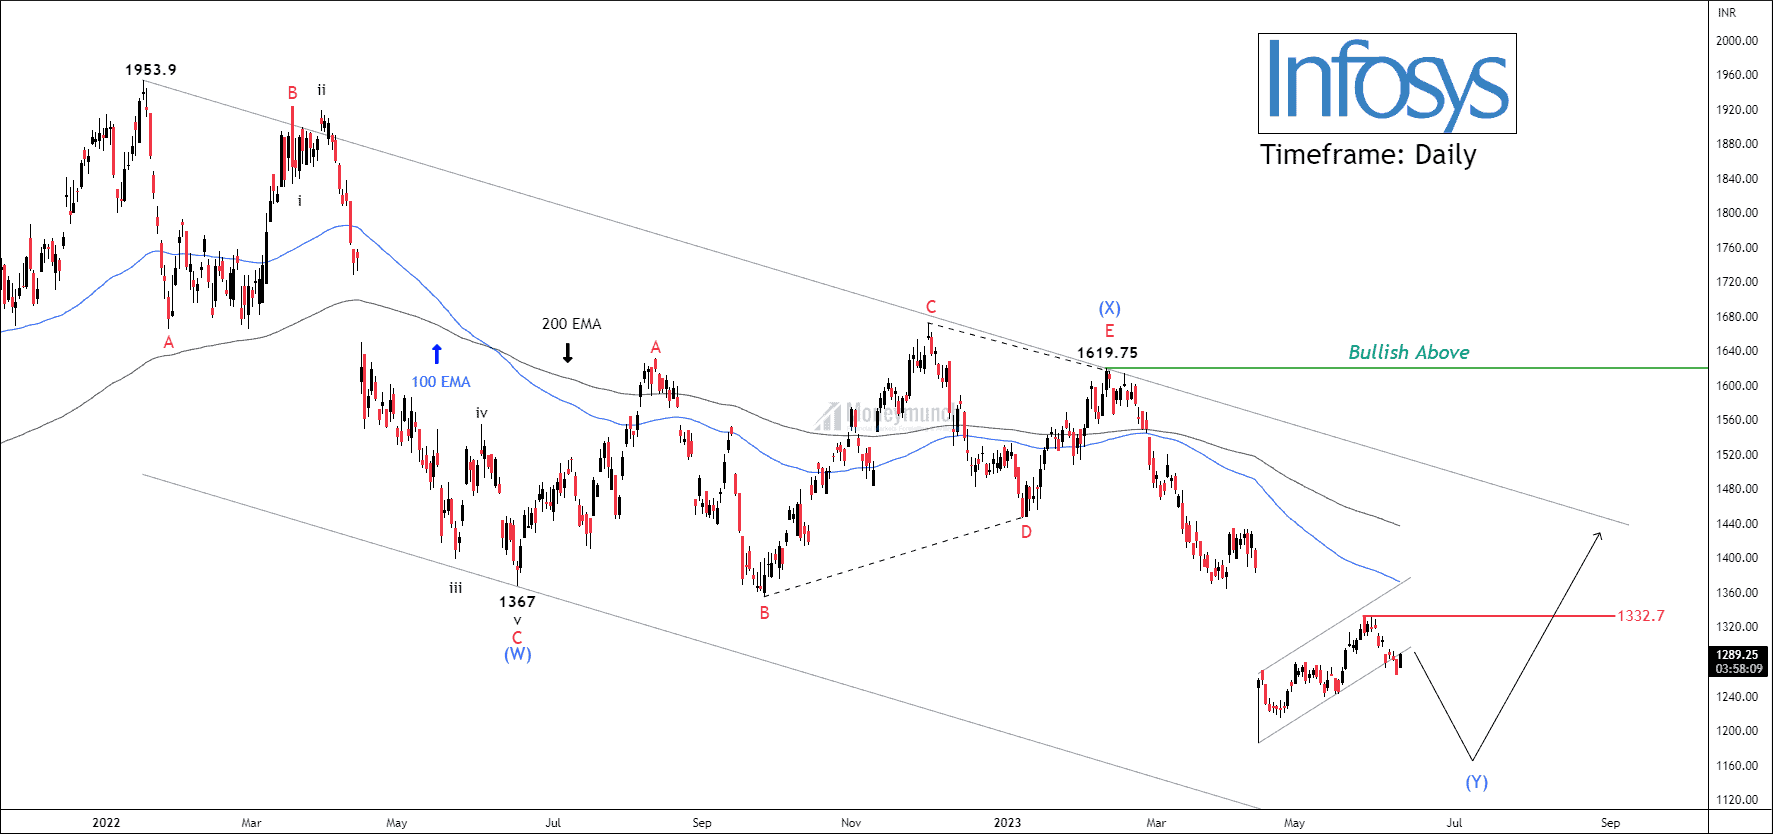
Timeframe: Daily NSE INFOSYS has been experiencing a prolonged corrective phase lasting over 73 weeks, with its movement consistently below the 50/100/200 EMA. This indicates a bearish sentiment for the security. On the daily timeframe chart, price action has formed double three patterns.Continue reading
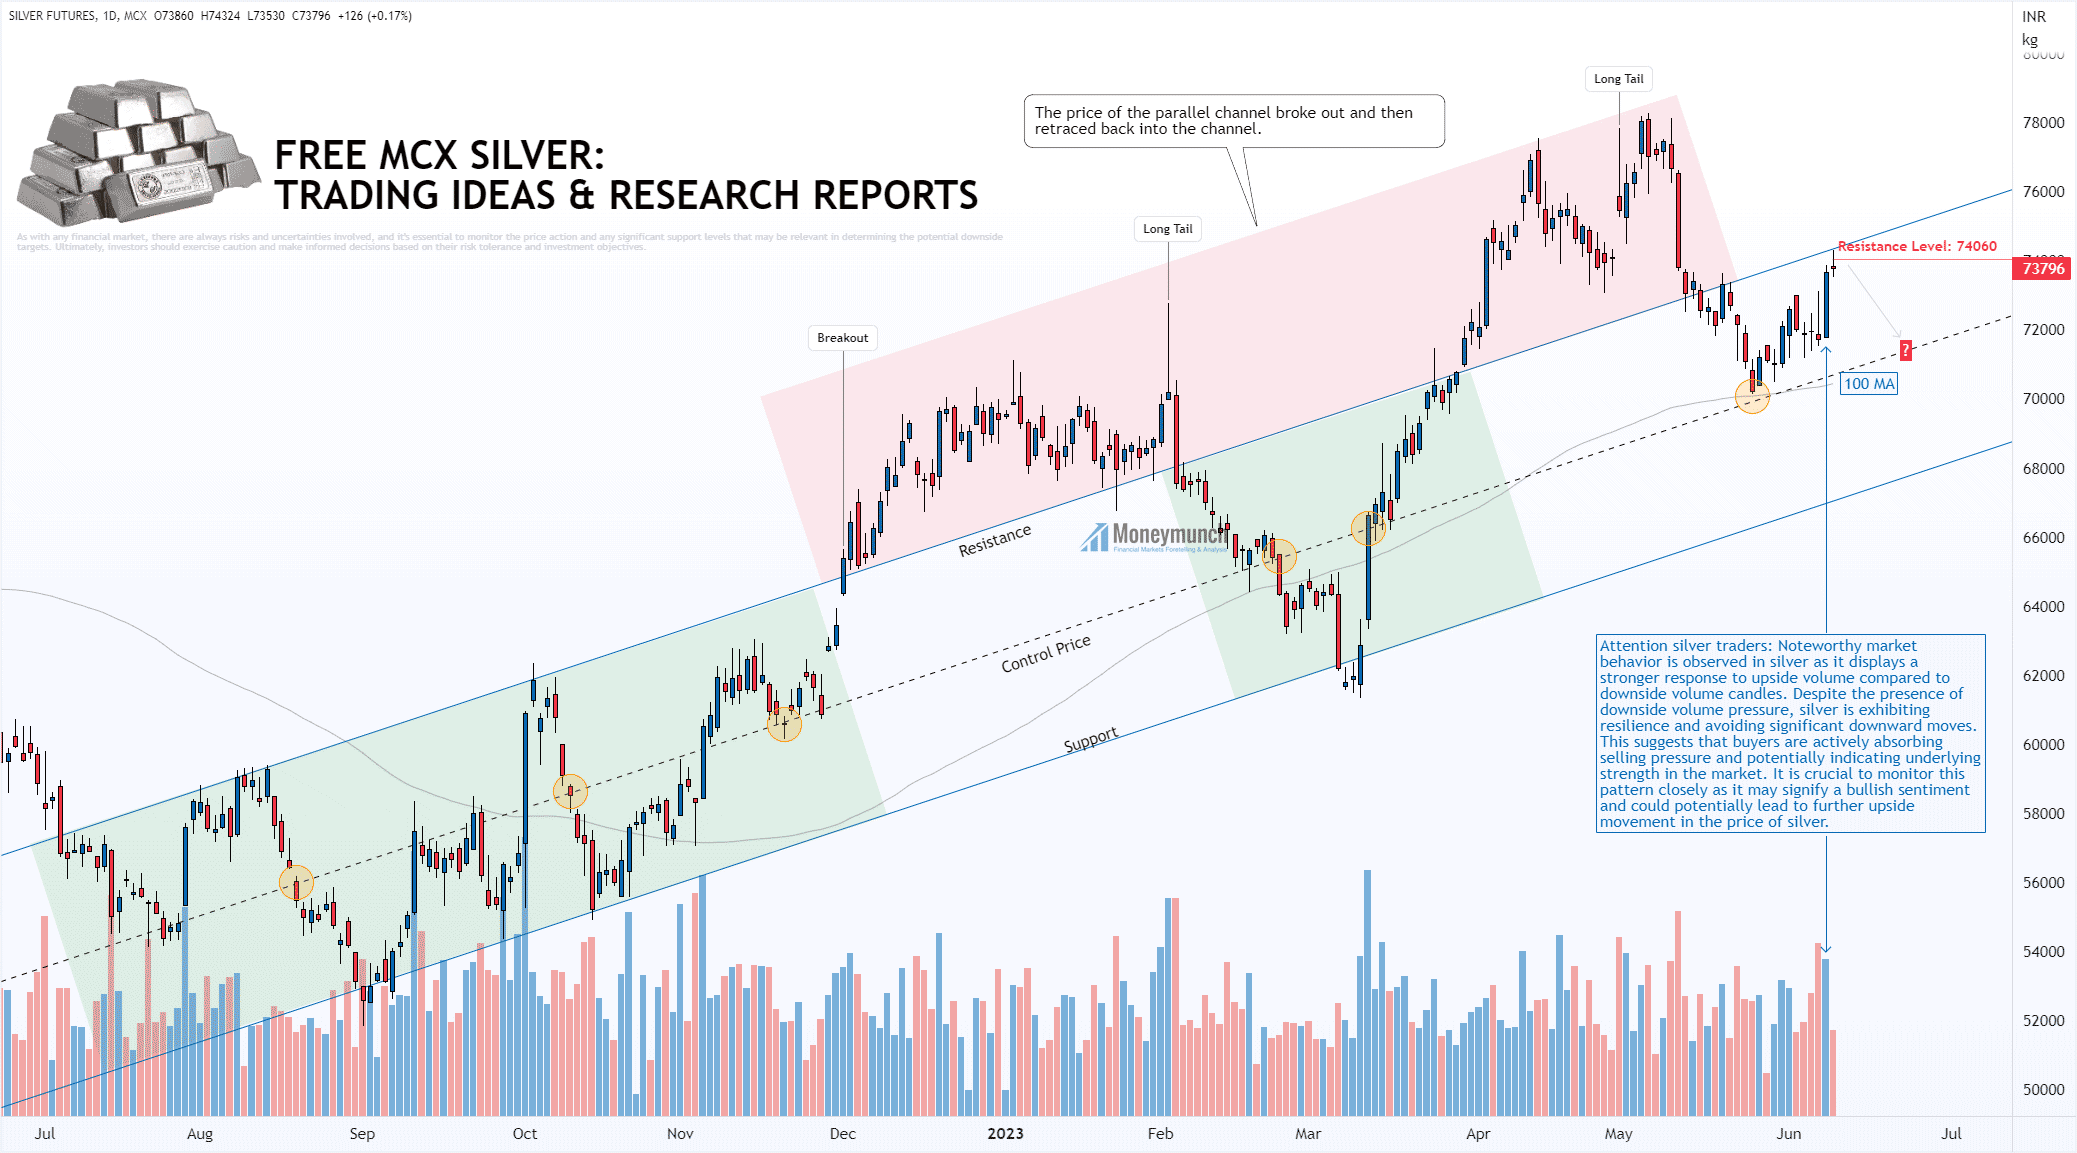
Silver Price Analysis: Exploring Resistance, Control Price, & Volume Dynamics